7. Interface do QGIS
A interface gráfica do usuário do QGIS (GUI) é mostrada na figura abaixo (os números de 1 a 5 em círculos amarelos indicam elementos importantes da GUI do QGIS e são discutidos abaixo).
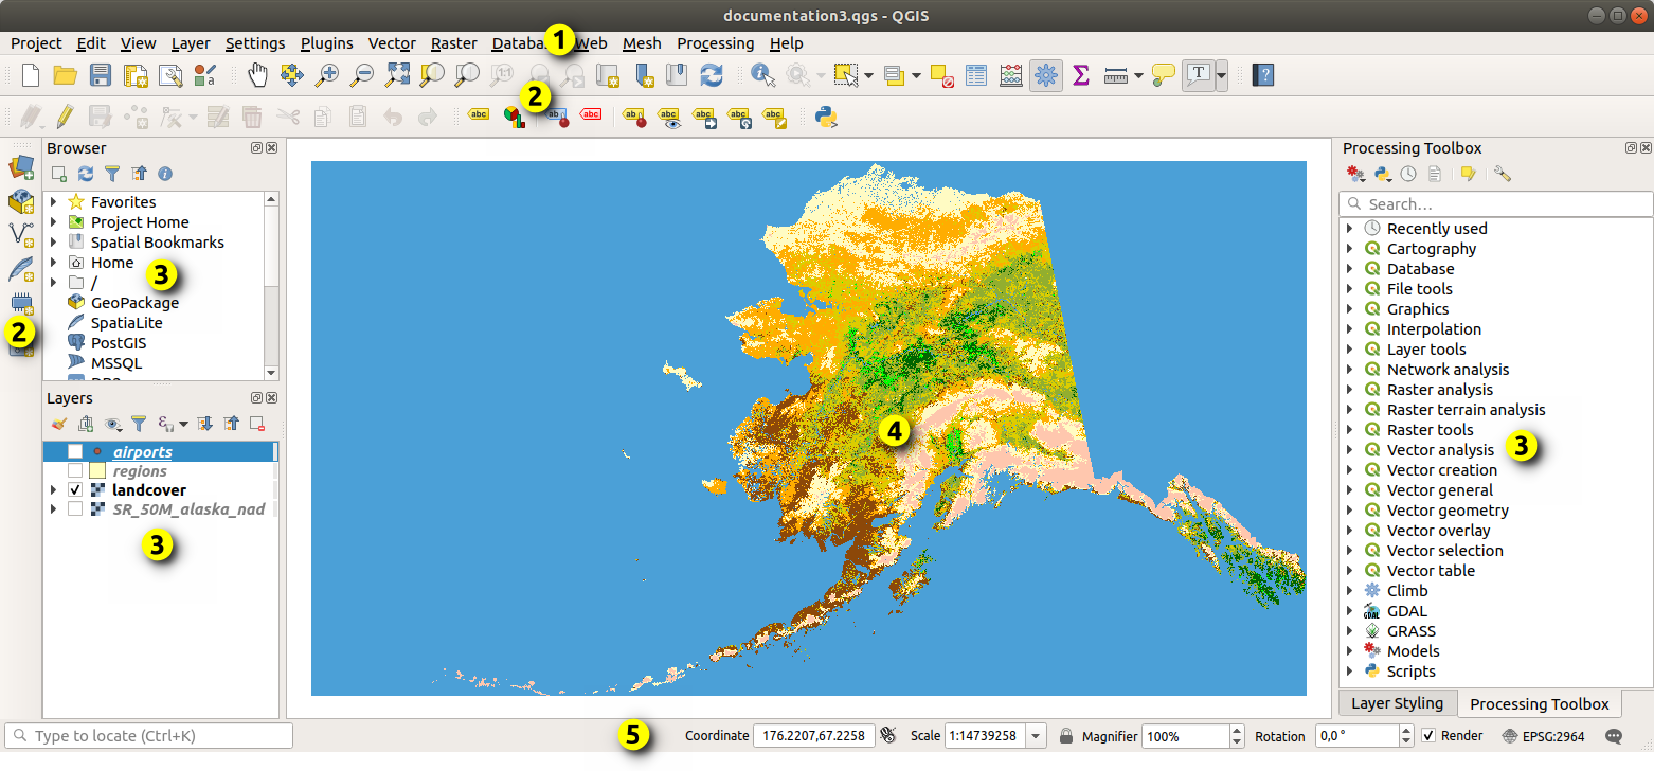
Fig. 7.1 GUI QGIS com dados de amostra do Alasca
Nota
Suas decorações de janela (barra de título, etc) podem parecer diferentes dependendo do seu sistema operacional e gerenciador de janelas.
A principal GUI QGIS (Fig. 7.1) consiste em cinco componentes / tipos de componentes:
Role para baixo para informações mais detalhadas destes.
7.1. Barra de Menu
A barra de menus fornece acesso às funções QGIS usando menus hierárquicos padrão. Os Menus, suas opções, ícones associados e atalhos de teclado são descritos abaixo. Os atalhos de teclado podem ser reconfigurados ().
A maioria das opções de menu possui uma ferramenta correspondente e vice-versa. No entanto, os menus não estão organizados exatamente como as barras de ferramentas. Os locais das opções de menu nas barras de ferramentas são indicados abaixo na tabela. Os complementos podem adicionar novas opções aos menus. Para mais informações sobre ferramentas e barras de ferramentas, veja Barra de ferramentas.
Nota
O QGIS é um aplicativo multiplataforma. As ferramentas geralmente estão disponíveis em todas as plataformas, mas podem ser colocadas em menus diferentes, dependendo dos sistemas operacionais. As listas abaixo mostram os locais mais comuns, incluindo variações conhecidas.
7.1.1. Projeto
O menu fornece pontos de acesso e saída para project files. Fornece ferramentas para:
Criar um Novo arquivo de projeto do zero ou utilizar outro arquivo de projeto como modelo (veja Opções de arquivos de projeto para configuração de modelo)
guilabel:Abrir…um projeto a partir de um arquivo, um GeoPackage ou um banco de dados PostgreSQL
guilabel:Fechar um projeto ou revertê-lo para seu último estado salvo
guilabel:Salvar um projeto em
.qgsou.qgzformato de arquivo, seja como um arquivo ou dentro de um banco de dados GeoPackage ou PostgreSQLExporta a tela do mapa para diferentes formatos ou usa um print layout para saída mais complexa
Definir as propriedades do projeto e as opções de snapping para edição de geometria.
Opção de menu |
Atalho |
Barra de Ferramentas |
Referência |
|---|---|---|---|
|
Ctrl+N |
Projeto |
|
|
Ctrl+O |
Projeto |
|
Alt+J + R |
|||
Fechar |
|||
|
Ctrl+S |
Projeto |
|
|
Ctrl+Shift+S |
Projeto |
|
Reverter… |
|||
|propriedadesDoProjeto| Propriedades… |
Ctrl+Shift+P |
||
Snapping Options… |
|||
|
|||
|
|||
|
Ctrl+P |
Projeto |
|
|
|||
|
Projeto |
||
|
Ctrl+Q |


Sob  no macOS, o comando Sair do QGIS corresponde a (Cmd+Q).
7.1.2. Editar
O menu fornece a maior parte das ferramentas nativas necessárias para editar atributos de camada ou geometria (veja Editando para mais detalhes).
Opção de menu |
Atalho |
Barra de Ferramentas |
Referência |
|---|---|---|---|
|
Ctrl+Z |
Digitalização |
|
|
Ctrl+Shift+Z |
Digitalização |
|
|
Ctrl+X |
Digitalização |
|
|
Ctrl+C |
Digitalização |
|
|
Ctrl+V |
Digitalização |
|
Ctrl+Alt+V |
|||
|
Digitalização |
||
|
Seleção |
||
|
Seleção |
||
|
Seleção |
||
|
Seleção |
||
|
F3 |
Seleção |
|
|
Ctrl+F3 |
Seleção |
|
|
Ctrl+Alt+A |
Seleção |
|
|
Ctrl+Shift+A |
Seleção |
|
|
Ctrl+A |
Seleção |
|
|
Seleção |
||
|
Ctrl+. |
Digitalização |
|
|
Ctrl+. |
Digitalização |
|
|
Ctrl+. |
Digitalização |
|
|
Ctrl+. |
Digitalização |
|
|
Shape Digitizing |
||
|
Shape Digitizing |
||
Shape Digitizing |
|||
|
Shape Digitizing |
||
|
Shape Digitizing |
||
|
Shape Digitizing |
||
|
Shape Digitizing |
||
|
Shape Digitizing |
||
Shape Digitizing |
desenhar_retângulos |
||
|
Shape Digitizing |
desenhar_retângulos |
|
|
Shape Digitizing |
desenhar_retângulos |
|
|
Shape Digitizing |
desenhar_retângulos |
|
|
Shape Digitizing |
desenhar_retângulos |
|
Shape Digitizing |
desenhar_poligono_regular |
||
|
Shape Digitizing |
desenhar_poligono_regular |
|
|
Shape Digitizing |
desenhar_poligono_regular |
|
|
Shape Digitizing |
desenhar_poligono_regular |
|
Shape Digitizing |
desenhar_elipse |
||
|
Shape Digitizing |
desenhar_elipse |
|
|
Shape Digitizing |
desenhar_elipse |
|
|
Shape Digitizing |
desenhar_elipse |
|
|
Shape Digitizing |
desenhar_elipse |
|
|
Annotations |
||
|
Annotations |
||
|
Annotations |
||
|
Annotations |
||
|
Digitalização |
||
|
Advanced Digitizing |
||
|
Advanced Digitizing |
||
|
Advanced Digitizing |
||
|
Advanced Digitizing |
||
|
Advanced Digitizing |
||
|
Advanced Digitizing |
||
|
Advanced Digitizing |
||
|
Advanced Digitizing |
||
|
Advanced Digitizing |
||
|
Advanced Digitizing |
||
|
Advanced Digitizing |
||
|
Advanced Digitizing |
||
|
Advanced Digitizing |
||
|
Advanced Digitizing |
||
|
Advanced Digitizing |
||
|
Advanced Digitizing |
||
|
Digitalização |
||
|
Digitalização |
||
|
Advanced Digitizing |
||
|
Advanced Digitizing |
||
|
Advanced Digitizing |
||
|
Advanced Digitizing |


As ferramentas que dependem do tipo de geometria da camada selecionada, ex., ponto, polilinha ou polígono, são ativadas de acordo:
Opção de menu |
Ponto |
Linha |
Polígono |
|---|---|---|---|
Mover Feição(ões) |
|
|
|
Copiar e Mover Elemento(s) |
|
|
|


7.1.3. Ver
O mapa é renderizado nas visualizações de mapa. Você pode interagir com essas visualizações usando as opções :menuselection: Exibir (veja Working with the map canvas para mais informações). Por exemplo, você pode:
Criar novas vistas de mapa 2D ou 3D ao lado da tela principal do mapa
Zoom or pan para qualquer lugar
Consultar atributos ou geometria dos elementos visualizados
Aprimore o mapa com modos de visualização, anotações ou decorações
Acesse qualquer painel ou barra de ferramentas
O menu também permite reorganizar a própria interface do QGIS usando ações como:
Alternar Modo de Ecrã Completo: preenche a totalidade do ecrã e oculta a barra de título
Alternar visibilidade do painel: ativa mostrar ou ocultar panels - útil ao digitalizar recursos (para máxima visibilidade da tela) e para apresentações (projetadas/gravadas) usando a tela principal do QGIS
Toggle Map Only: esconde painéis, barras de ferramentas, menus e barras de status e mostra apenas a tela do mapa. Combinada com a opção tela cheia, faz sua tela mostrar apenas o mapa
Opção de menu |
Atalho |
Barra de Ferramentas |
Referência |
|---|---|---|---|
|
Ctrl+M |
||
|
Ctrl+Alt+M |
||
|
Navegação de mapa |
||
|
Navegação de mapa |
||
|
Ctrl+Alt++ |
Navegação de mapa |
|
|
Ctrl+Alt+- |
Navegação de mapa |
|
|
Ctrl+Shift+I |
Atributos |
|
Atributos |
|||
|
Ctrl+Shift+M |
Atributos |
|
|
Ctrl+Shift+J |
Atributos |
|
|
Atributos |
||
|
Atributos |
||
|
Ctrl+Shift+F |
Navegação de mapa |
|
|
Ctrl+J |
Navegação de mapa |
|
|
Navegação de mapa |
||
|
Navegação de mapa |
||
|
Navegação de mapa |
||
|
Navegação de mapa |
||
Alt+V + D |
|||
|
|||
|
|||
|
|||
|
|||
|
|||
|
|||
|
|||
|
Atributos |
||
|
Ctrl+B |
Navegação de mapa |
|
|
Ctrl+Shift+B |
Navegação de mapa |
|
|
|||
|
F5 |
Navegação de mapa |
|
|
Ctrl+Shift+U |
||
|
Ctrl+Shift+H |
||
|
|||
|
|||
|
|||
Toggle Selected Layers Independently |
|||
|
|||
F12 |
|||
Menuselection:`–> Controlador Temporal’ |
controlador_temporal |
||
Alternar Modo de Tela Cheia |
F11 |
||
Mostrar / Ocultar Painéis |
Ctrl+Tab |
||
Alternar apenas Mapa |
Ctrl+Shift+Tab |


Under  Linux KDE, ,
and Toggle Full Screen Mode
are in the menu.
Linux KDE, ,
and Toggle Full Screen Mode
are in the menu.
7.1.4. Camada
O menu fornece um grande conjunto de ferramentas para novas fontes de dados create , add as fontes a um projeto ou save modifications a elas. Usando as mesmas fontes de dados, você também pode:
Duplicate a layer to generate a copy where you can modify the name, style (symbology, labels, …), joins, … The copy uses the same data source as the original.
Copy and Paste layers or groups from one project to another as a new instance whose properties can be modified independently. As for Duplicate, the layers are still based on the same data source.
ou Incorporar camadas e grupos … de outro projeto, como cópias somente leitura que você não pode modificar (veja Incorporando camadas de projetos externos)
The menu also contains tools to configure, copy or paste layer properties (style, scale, CRS…).
Opção de menu |
Atalho |
Barra de Ferramentas |
Referência |
|---|---|---|---|
|
Ctrl+L |
Data Source Manager |
|
|
Ctrl+Shift+N |
Data Source Manager |
|
|
Data Source Manager |
||
|
Data Source Manager |
||
|
Data Source Manager |
||
|
Data Source Manager |
||
|
Data Source Manager |
||
|
Data Source Manager |
||
|
Ctrl+Shift+V |
Gerenciar camadas |
|
|
Ctrl+Shift+R |
Gerenciar camadas |
|
|
Gerenciar camadas |
||
|
Ctrl+Shift+T |
Gerenciar camadas |
|
|
Ctrl+Shift+D |
Gerenciar camadas |
|
|
Ctrl+Shift+L |
Gerenciar camadas |
|
|
Gerenciar camadas |
||
|
Gerenciar camadas |
||
|
Gerenciar camadas |
||
|
Ctrl+Shift+W |
Gerenciar camadas |
|
|
|||
|
Gerenciar camadas |
||
|
Gerenciar camadas |
||
|
Gerenciar camadas |
||
|
|||
Incorporar Camadas e Grupos… |
|||
Add from Layer Definition File… |
|||
|
|||
|
|||
|
|||
|
|||
|
F6 |
Atributos |
|
|
Shift+F6 |
Atributos |
|
|
Ctrl+F6 |
Atributos |
|
|
Atributos |
||
|
Digitalização |
||
|
Digitalização |
||
|
Digitalização |
||
Digitalização |
|||
Digitalização |
|||
Digitalização |
|||
Digitalização |
|||
Digitalização |
|||
Digitalização |
|||
Salvar Como… |
|||
Save As Layer Definition File… |
|||
|
Ctrl+D |
||
|
|||
Definir Escala de Visibilidade da(s) Camada(s) |
|||
Set CRS of Layer(s) |
Ctrl+Shift+C |
||
Usar o mesmo SRC da camada no Projecto |
|||
Propriedades da Camada… |
Janela de Propriedades de Vetor, Caixa de Diálogo de Propriedades do Raster, Mesh Dataset Properties |
||
Filtrar… |
Ctrl+F |
||
|
|||
|
|||
|
|||
|


7.1.5. Configurações
Opção de menu |
Referência |
|---|---|
|
|
|
|
|
|
|
|
|


Under Linux KDE, you’ll find more tools in the
menu such as ,
and Toggle Full Screen Mode.
7.1.6. Complementos
Opção de menu |
Atalho |
Barra de Ferramentas |
Referência |
|---|---|---|---|
|
|||
“ |
Ctrl+Alt+P |
Complementos |


Ao iniciar o QGIS pela primeira vez, nem todos os complementos principais são carregados.
7.1.7. Vetor
This is what the Vector menu looks like if all core plugins are enabled.
Opção de menu |
Atalho |
Barra de Ferramentas |
Referência |
|---|---|---|---|
|
|||
|
Alt+O + G |
Vetor |
|
|
Vetor |
||
Alt+O + G |
|||
Alt+O + E |
|||
Alt+O + A |
|||
Alt+O + D |
|||
Alt+O + R |
|||


Por padrão, o QGIS inclui algortimos Processing ao menu Vector, agrupado por submenus. Isso fornece atalhos para muitas tarefas GIS baseadas em vetores comuns de diferentes fornecedores. Se nem todos esses submenus estiverem disponíveis, ative o complemento Processing em :menuselection: Plugins -> Manage and Install Plugins ….
Note that the list of algorithms and their menu can be modified/extended with any Processing algorithms (read Configuring the Processing Framework) or some external plugins.
7.1.8. Raster
É assim que o menu :guilabel: Raster se parece se todos os complementos principais estiverem ativados.
Opção de menu |
Atalho |
Barra de Ferramentas |
Referência |
|---|---|---|---|
|
|||
Alinhar Raster… |
|||
|
Alt+R + G |
Raster |
|


By default, QGIS adds Processing algorithms to the Raster menu, grouped by sub-menus. This provides a shortcut for many common raster-based GIS tasks from different providers. If not all these sub-menus are available, enable the Processing plugin in .
Note that the list of algorithms and their menu can be modified/extended with any Processing algorithms (read Configuring the Processing Framework) or some external plugins.
7.1.9. Base de dados
This is what the Database menu looks like if all the core plugins are enabled. If no database plugins are enabled, there will be no Database menu.
Opção de menu |
Atalho |
Barra de Ferramentas |
Referência |
|---|---|---|---|
Offline editing… |
Alt+D + O |
||
|
Banco de Dados |
||
|
Banco de Dados |
||
|
Banco de Dados |


Ao iniciar o QGIS pela primeira vez, nem todos os complementos principais são carregados.
7.1.10. Web
This is what the Web menu looks like if all the core plugins are enabled. If no web plugins are enabled, there will be no Web menu.
Opção de menu |
Atalho |
Barra de Ferramentas |
Referência |
|---|---|---|---|
Alt+W + M |
|||
|
Web |
||

Ao iniciar o QGIS pela primeira vez, nem todos os complementos principais são carregados.
7.1.11. Malha
O menu fornece as ferramentas necessárias para manipular mesh layers.
Opção de menu |
Atalho |
Barra de Ferramentas |
Referência |
|---|---|---|---|
|
|||
|


7.1.12. Processamento
Opção de menu |
Atalho |
Barra de Ferramentas |
Referência |
|---|---|---|---|
|
Ctrl+Alt+T |
||
|
Ctrl+Alt+G |
||
|
Ctrl+Alt+H |
||
|
Ctrl+Alt+R |
||
|


Ao iniciar o QGIS pela primeira vez, nem todos os complementos principais são carregados.
7.1.13. Ajuda
Opção de menu |
Atalho |
Barra de Ferramentas |
Referência |
|---|---|---|---|
|
F1 |
Ajuda |
|
API Documentation |
|||
Reportar Problema |
|||
Necessita de suporte comercial? |
|||
|
Ctrl+H |
||
|
|||
|
|||
|


7.1.14. QGIS
This menu is only available under macOS and contains some OS
related commands.
Opção de menu |
Atalho |
|---|---|
Preferências |
|
Sobre o QGIS |
|
Ocultar QGIS |
|
Mostrar Todas |
|
Ocultar os Outros |
|
Sair do QGIS |
Cmd+Q |
Preferências correspondem a , Sobre o QGIS corresponde to e Sair do QGIS corresponde a para outras plataformas.
7.2. Painéis e Barras de Ferramentas
From the menu (or
), you can switch QGIS widgets
() and toolbars
() on and off.
To (de)activate any of them, right-click the menu bar or toolbar and
choose the item you want.
Panels and toolbars can be moved and placed wherever you like within
the QGIS interface.
The list can also be extended with the activation of Core or
external plugins.
7.2.1. Barra de ferramentas
The toolbars provide access to most of the functions in the menus, plus additional tools for interacting with the map. Each toolbar item has pop-up help available. Hover your mouse over the item and a short description of the tool’s purpose will be displayed.
Cada barra de ferramentas pode ser movida de acordo com suas necessidades. Além disso, elas podem ser desativadas usando o menu de contexto do botão direito do mouse ou mantendo o mouse sobre as barras de ferramentas.
As barras de ferramentas disponíveis são:
Nome |
Referência principal para ferramentas |
|---|---|
Advanced Digitizing Toolbar |
|
Annotations Toolbar |
|
Atributos |
|
Data Source Manager |
|
Banco de Dados |
|
Digitalização |
|
Ajuda |
|
Rótulo |
|
Gerenciar camadas |
|
Navegação de mapa |
|
Mesh Digitizing Toolbar |
|
Complementos |
|
Projeto |
Trabalhando com Arquivos de Projetos, Preparando os mapas, Biblioteca de estilo |
Processing Algorithms |
|
Raster |
|
Seleção |
|
Shape digitizing |
|
Snapping |
|
Vetor |
|
Web |
Nota
Third-party plugins can extend the default toolbar with their own tools or provide their own toolbar.
Dica
Restaurar barra de ferramentas
Se você ocultou acidentalmente uma barra de ferramentas, é possível recuperá-la usando: (ou ). Se, por algum motivo, uma barra de ferramentas (ou qualquer outro widget) desaparecer totalmente da interface, você encontrará dicas para recuperá-la em restoring initial GUI.
7.2.2. Painéis
O QGIS fornece muitos painéis. Painéis são widgets especiais com os quais você pode interagir (selecionar opções, marcar caixas, preencher valores…) para executar tarefas mais complexas.
Abaixo está uma lista dos painéis padrão fornecidos pelo QGIS:
the Result Viewer Panel
7.3. Visualização do mapa
7.3.1. Explorando a visualização do mapa
The map view (also called Map canvas) is the “business end” of QGIS — maps are displayed in this area, in 2D. The map displayed in this window will reflect the rendering (symbology, labeling, visibilities…) you applied to the layers you have loaded. It also depends on the layers and the project’s Coordinate Reference System (CRS).
When you add a layer (see e.g. Abrir Dados), QGIS automatically looks for its CRS. If a different CRS is set by default for the project (see Sistemas referência de coordenadas projetadas) then the layer extent is “on-the-fly” translated to that CRS, and the map view is zoomed to that extent if you start with a blank QGIS project. If there are already layers in the project, no map canvas resize is performed, so only features falling within the current map canvas extent will be visible.
Click on the map view and you should be able to interact with it:
it can be panned, shifting the display to another region of the map: this is performed using the
 Pan Map tool, the arrow keys,
moving the mouse while any of the Space key, the middle mouse
button or the mouse wheel is held down. When the mouse is used, the distance
and direction of the pan action are shown in the status bar at the bottom.
Pan Map tool, the arrow keys,
moving the mouse while any of the Space key, the middle mouse
button or the mouse wheel is held down. When the mouse is used, the distance
and direction of the pan action are shown in the status bar at the bottom.it can be zoomed in and out, with the dedicated
 Zoom In
and
Zoom In
and  Zoom Out tools. Hold the Alt key to switch from
one tool to the other. Zooming is also performed by rolling
the wheel forward to zoom in and backwards to zoom out.
The zoom is centered on the mouse cursor position. You can customize the
Zoom factor under the
menu.
Zoom Out tools. Hold the Alt key to switch from
one tool to the other. Zooming is also performed by rolling
the wheel forward to zoom in and backwards to zoom out.
The zoom is centered on the mouse cursor position. You can customize the
Zoom factor under the
menu.it can be zoomed to the full extent of all loaded layers (
 Zoom Full), to the extent of all the selected layers in the
panel (
Zoom Full), to the extent of all the selected layers in the
panel ( Zoom to Layer(s))
or to the extent of the selected features of all the selected layers in the
panel (
Zoom to Layer(s))
or to the extent of the selected features of all the selected layers in the
panel ( Zoom to
Selection)
Zoom to
Selection)you can navigate back/forward through the canvas view history with the
 Zoom Last and
  Zoom Next buttons
or using the back/forward mouse buttons.
Zoom Next buttons
or using the back/forward mouse buttons.
Right-click over the map and you should be able to  Copy coordinates of the clicked point in the map CRS, in WGS84
or in a custom CRS. The copied information can then be pasted in an expression,
a script, text editor or spreadsheet…
Copy coordinates of the clicked point in the map CRS, in WGS84
or in a custom CRS. The copied information can then be pasted in an expression,
a script, text editor or spreadsheet…
By default, QGIS opens a single map view (called “main map”), which is tightly bound to the Layers panel; the main map automatically reflects the changes you do in the Layers panel area. But it is also possible to open additional map views whose content could diverge from the Layers panel current state. They can be of 2D or 3D type, show different scale or extent, or display a different set of the loaded layers thanks to map themes.
7.3.2. Definição de visualizações adicionais do mapa
To add a new map view, go to  . A new floating widget, mimicking the main map
view’s rendering, is added to QGIS. You can add as many map views as you need.
They can be kept floating, placed side by side or stacked on top of each
other.
. A new floating widget, mimicking the main map
view’s rendering, is added to QGIS. You can add as many map views as you need.
They can be kept floating, placed side by side or stacked on top of each
other.
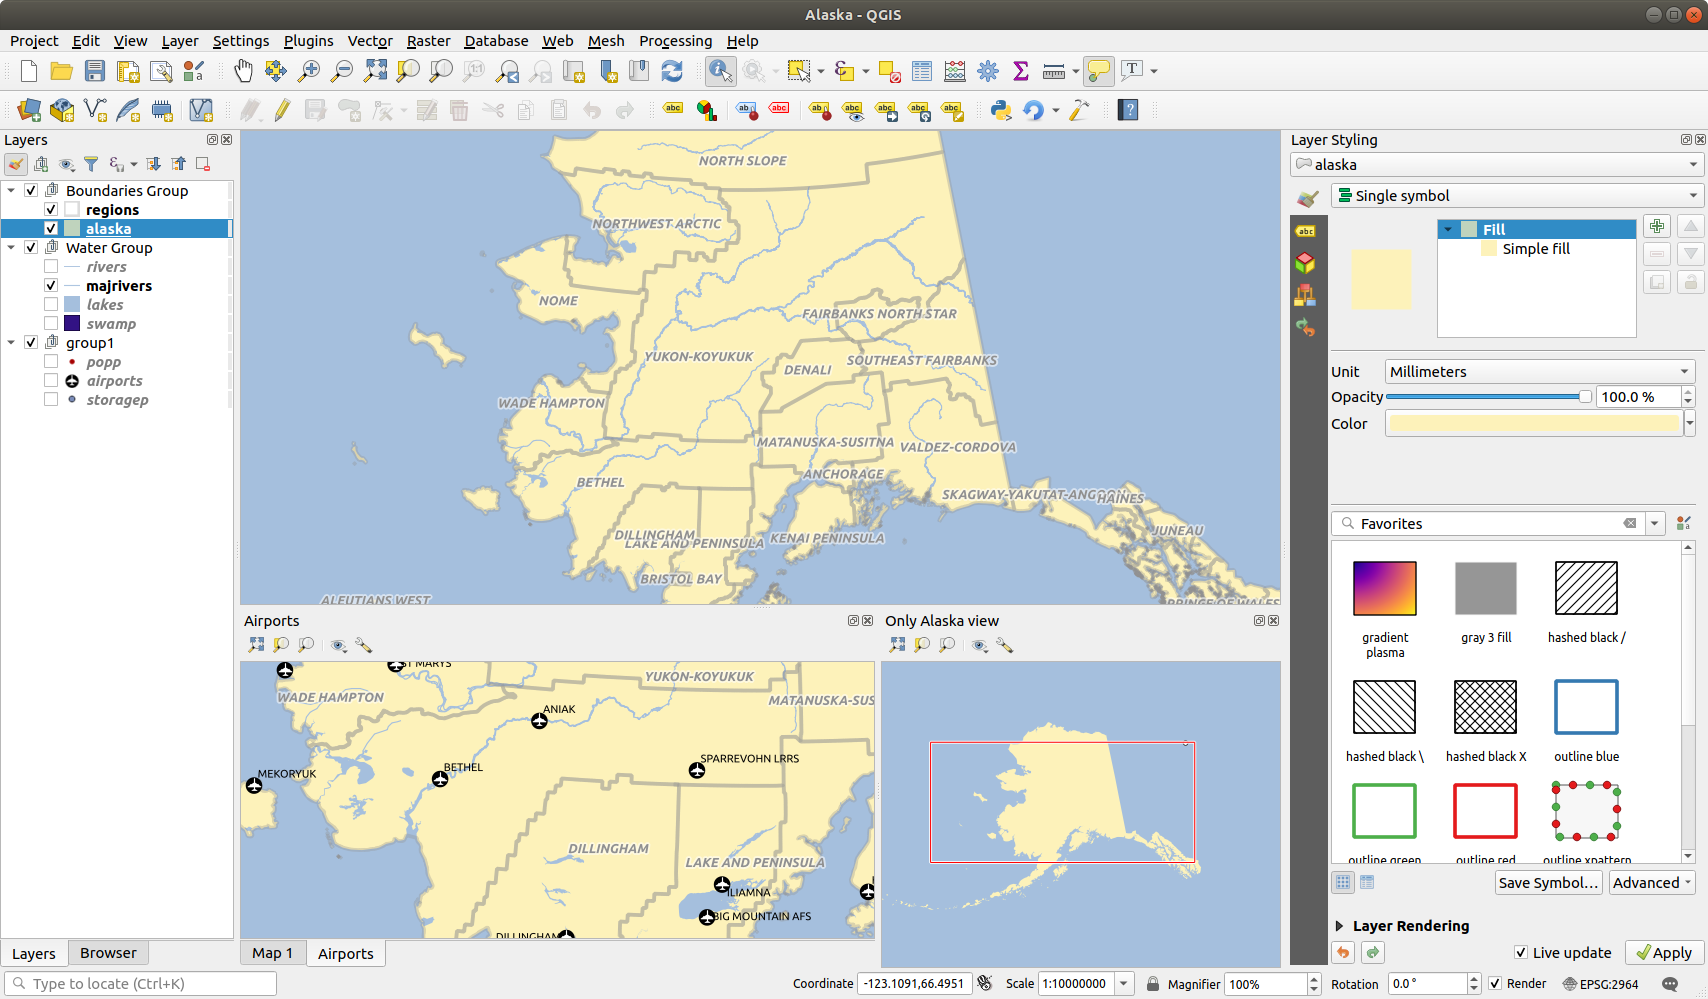
Fig. 7.2 Múltiplas visualizações de mapas com diferentes configurações
No topo de uma tela de mapa adicional, há uma barra de ferramentas com as seguintes capacidades:
- Zoom Full, Zoom to Selection
and Zoom to Layer(s) to navigate within the view
 Set View Theme to select the map theme
to display in the map view. If set to
Set View Theme to select the map theme
to display in the map view. If set to (none), the view will follow the Layers panel changes. Configurações de visualização para configura a visualização do mapa:
 Synchronize view center with main map:
syncs the center of the map views without changing the scale.
This allows you to have an overview style or magnified map which follows
the main canvas center.
Synchronize view center with main map:
syncs the center of the map views without changing the scale.
This allows you to have an overview style or magnified map which follows
the main canvas center. Synchronize view to selection: same as
zoom to selection
Synchronize view to selection: same as
zoom to selectionEscala
Rotação
guilabel:`Magnificação’
 Synchronize scale with the main map scale.
A Scale factor can then be applied, allowing you to have
a view which is e.g. always 2x the scale of the main canvas.
Synchronize scale with the main map scale.
A Scale factor can then be applied, allowing you to have
a view which is e.g. always 2x the scale of the main canvas. Show annotations
- Mostrar a posição do cursor
- Show main canvas extent
- Show labels: allows to hide labels regardless
they are set in the displayed layers’ properties
Mudar SRC do mapa…
Renomear visualização…
7.3.3. Controle baseado no tempo na tela do mapa
O QGIS pode manipular o controle temporal em camadas carregadas, ou seja, modificar a renderização da tela de mapa com base em uma variação de tempo. Para conseguir isso, você precisa:
Camadas que têm propriedades temporais dinâmicas definidas. O QGIS suporta controle temporal para diferentes provedores de dados, com configurações personalizadas. Trata-se principalmente de definir o intervalo de tempo no qual a camada seria exibida:
raster layers: controls whether to display or not the layer.
vector layers: features are filtered based on time values associated to their attributes
mesh layers: displays dynamically the active dataset groups values
When dynamic temporal options are enabled for a layer, an
 icon is displayed next to the layer in the Layers panel to remind
you that the layer is temporally controlled.
Click the icon to update the temporal settings.
icon is displayed next to the layer in the Layers panel to remind
you that the layer is temporally controlled.
Click the icon to update the temporal settings.Enable the temporal navigation of the map canvas using the Temporal controller panel. The panel is activated:
using the
 Temporal controller panel icon located in the
Map Navigation toolbar
Temporal controller panel icon located in the
Map Navigation toolbaror from the menu
7.3.3.1. O painel de controle temporal
The Temporal controller panel has the following modes:
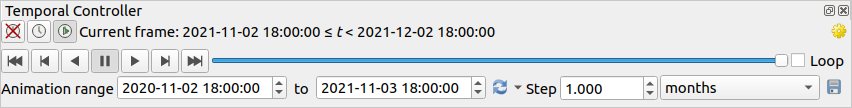
Fig. 7.3 Painel Controlador Temporal no modo de navegação
 Desligar a navegação temporal: todas as configurações temporais são desativadas e as camadas visíveis são renderizadas como de costume
 Fixed range temporal navigation:
a time range is set and only layers (or features) whose temporal range
overlaps with this range are displayed on the map.
Fixed range temporal navigation:
a time range is set and only layers (or features) whose temporal range
overlaps with this range are displayed on the map. Animated temporal navigation:
a time range is set, split into steps, and only layers (or features)
whose temporal range overlaps with each frame are displayed on the map
Animated temporal navigation:
a time range is set, split into steps, and only layers (or features)
whose temporal range overlaps with each frame are displayed on the map Definições para controle geral da animação
Frames rate: number of steps that are shown per second
- Cumulative range: all animation frames will
have the same start date-time but different end dates and times.
This is useful if you wish to accumulate data in your temporal
visualisation instead of showing a ‘moving time window’ across your data.
7.3.3.2. Animando uma navegação temporal
Uma animação é baseada em um conjunto variável de camadas visíveis em momentos específicos dentro de um intervalo de tempo. Para criar uma animação temporal:
Toggle on the
Animated temporal
navigation, displaying the animation player widgetDigite o Faixa de tempo a considerar. Usando o botão
 , isto pode ser definido como:
Set to full range of all the time enabled layers
Set to preset project range as defined in the project properties
Set to single layer’s range taken from a time-enabled layer
Fill in the time Step to split the time range. Different units are supported, from
secondstocenturies. Asource timestampsoption is also available as step: when selected, this causes the temporal navigation to step between all available time ranges from layers in the project. It’s useful when a project contains layers with non-contiguous available times, such as a WMS-T service which provides images that are available at irregular dates. This option will allow you to only step between time ranges where the next available image is shown.Clique no botão
 para visualizar a animação. QGIS irá gerar cenas usando as camadas de renderização nos horários definidos. A exibição das camadas depende de se elas se sobrepõem a qualquer período de tempo individual.
Fig. 7.4 Navegação temporal através de uma camada
The animation can also be previewed by moving the time slider. Keeping the
Loop button pressed will repeatedly run the
animation while clicking stops a running animation.
A full set of video player buttons is available.Horizontal scrolling using the mouse wheel (where supported) with the cursor on the map canvas will also allow you to navigate, or “scrub”, the temporal navigation slider backwards and forwards.
Click the
 Export animation button if you want to generate
a series of images representing the scene. They can be later combined in a
video editor software:
Export animation button if you want to generate
a series of images representing the scene. They can be later combined in a
video editor software: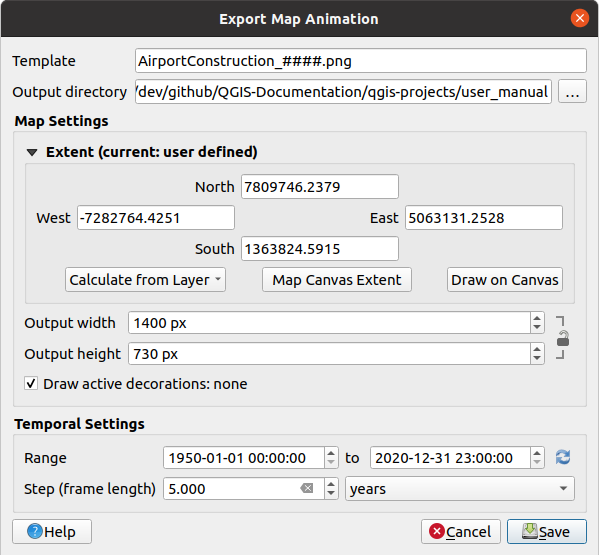
Fig. 7.5 Exporting map canvas animation scenes to images
O nome do arquivo Modelo: o
####é substituído pelo número da seqüência de quadrosO Diretório de saída
Sob :guilabel:`Configurações do mapa’, você pode:
redefinir a :ref:`extensão espacial <extent_selector>`a ser utilizada
control the Resolution of the image (Output width and Output height)
Draw active decorations: whether active decorations should be kept in the output
Sob :guilabel:`Configurações temporais’, você pode redefinir:
the time Range for the animation
the Step (frame length) in the unit of your choice
7.3.4. Exportando a visualização do mapa
Maps you make can be layout and exported to various formats using the advanced capabilities of the print layout or report. It’s also possible to directly export the current rendering, without a layout. This quick “screenshot” of the map view has some convenient features.
To export the map canvas with the current rendering:
Vá para
Dependendo do seu formato de saída, selecione
 Export Map to Image…
ou
 Export Map to PDF…
The two tools provide you with a common set of options. In the dialog that opens:
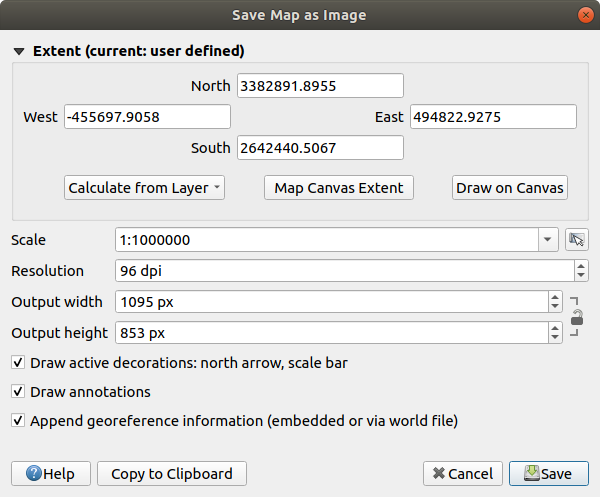
Fig. 7.6 The Save Map as Image dialog
Choose the Extent to export: it can be the current view extent (the default), the extent of a layer or a custom extent drawn over the map canvas. Coordinates of the selected area are displayed and manually editable.
Enter the Scale of the map or select it from the predefined scales: changing the scale will resize the extent to export (from the center).
Defina a Resolução da saída
Control the Output width and Output height in pixels of the image: based by default on the current resolution and extent, they can be customized and will resize the map extent (from the center). The size ratio can be locked, which may be particularly convenient when drawing the extent on the canvas.
- Draw active decorations: in use decorations (barra de escala, título, malha, Rosa dos ventos…) são exportados com o mapa
- Desenhar anotações para exportar qualquer annotation
- Append georeference information (embedded or
via world file): depending on the output format, a world file of
the same name (with extension
PNGWforPNGimages,JPGWforJPG, …) is saved in the same folder as your image. ThePDFformat embeds the information in the PDF file. Ao exportar para PDF, mais opções estão disponíveis na caixa de diálogo Salvar mapa como PDF…:
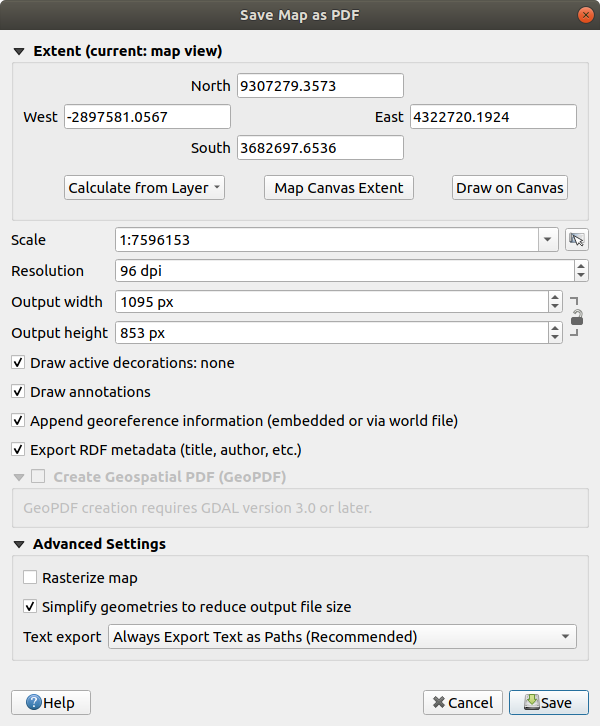
Fig. 7.7 A caixa de diálogo Salvar Mapa como PDF
- Exportar metadados RDF do documento, como título, autor, data, descrição…
- Criar PDF Geoespacial (GeoPDF): Gera um arquivo PDF georreferenciado (requer GDAL versão 3 ou mais recente). Você pode:
Choose the GeoPDF Format
- Include vector feature information in the
GeoPDF file: will include all the geometry and attribute
information from features visible within the map in the output
GeoPDF file.
Nota
Desde QGIS 3.10, com GDAL 3 um arquivo GeoPDF também pode ser usado como fonte de dados. Para saber mais sobre o suporte GeoPDF em QGIS, veja https://north-road.com/2019/09/03/qgis-3-10-loves-geopdf/.
Rasterize map
- Simplify geometries to reduce output file
size:
Geometries will be simplified while exporting the map by removing
vertices that are not discernably different at the export
resolution (e.g. if the export resolution is
300 dpi, vertices that are less than1/600 inchapart will be removed). This can reduce the size and complexity of the export file (very large files can fail to load in other applications). Defina :guilabel: Exportar texto`: controla se os rótulos de texto são exportados como objetos de texto adequados (Sempre exportar textos como objetos de texto) ou apenas como caminhos (Sempre exporta textos como caminhos). Se eles forem exportados como objetos de texto, poderão ser editados em aplicativos externos (por exemplo, Inkscape) como texto normal. MAS o efeito colateral é que a qualidade da renderização diminui E há problemas com a renderização quando determinadas configurações de texto, como buffers, estão em vigor. É por isso que a exportação como caminhos é recomendada.
Clique :guilabel:`Salvar’ para selecionar o local, nome e formato do arquivo.
When exporting to image, it’s also possible to Copy to clipboard the expected result of the above settings and paste the map in another application such as LibreOffice, GIMP…
7.4. Visualização de Mapa 3D
3D visualization support is offered through the 3D map view.
You create and open a 3D map view via
 .
A floating QGIS panel will appear. The panel can be docked.
.
A floating QGIS panel will appear. The panel can be docked.
Para começar, a visualização do mapa 3D tem a mesma extensão e visualização que a tela principal do mapa 2D. Um conjunto de ferramentas de navegação está disponível para transformar a visualização em 3D.
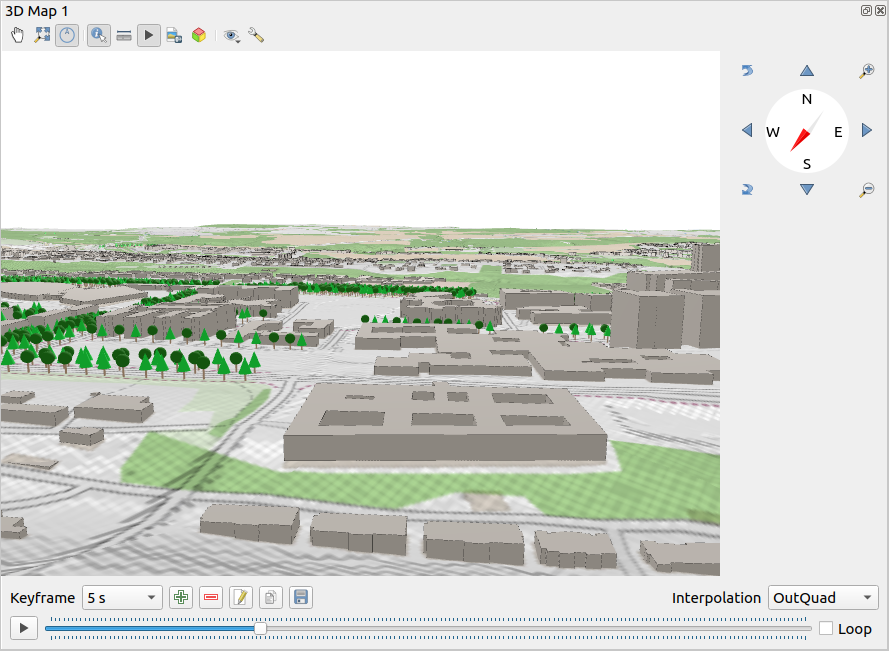
Fig. 7.8 The 3D Map View dialog
The following tools are provided at the top of the 3D map view panel:
- Camera control: moves the view, keeping the same angle
and direction of the camera
- Zoom Full: resizes the view to the whole
layers’ extent
 Toggle on-screen notification: shows/hides the
navigation widget (that is meant to ease controlling of the map view)
Toggle on-screen notification: shows/hides the
navigation widget (that is meant to ease controlling of the map view) Identify: returns information on the clicked point
of the terrain or the clicked 3D feature(s) – More details at Identificando Feições
Identify: returns information on the clicked point
of the terrain or the clicked 3D feature(s) – More details at Identificando Feições Measurement line: measures the horizontal distance between points
- Animations: shows/hides the animation player widget
- Save as image…: exports the current view to
an image file format
 Export 3D Scene…: exports the current view as a 3D scene
(
Export 3D Scene…: exports the current view as a 3D scene
(.objfile), allowing post-processing in applications like Blender… The terrain and vector features are exported as 3D objects. The export settings, overriding the layers properties or map view configuration, include:Scene name and destination Folder
Terrain resolution
Terrain texture resolution
Model scale
- Suavizar bordas
- Export normals
- Exportar texturas
- Set View Theme: Allows you to select the set of layers to
display in the map view from predefined map themes.
- Configure the map view settings
7.4.1. Scene Configuration
The 3D map view opens with some default settings you can customize.
To do so, click the Configure… button at the top of
the 3D canvas panel to open the 3D configuration window.
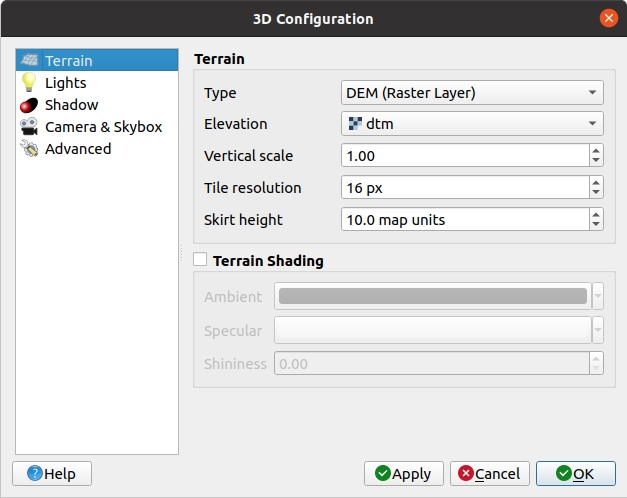
Fig. 7.9 The 3D Map Configuration dialog
In the 3D Configuration window there are various options to fine-tune the 3D scene:
7.4.1.1. Terreno
Terrain: Before diving into the details, it is worth noting that the terrain in a 3D view is represented by a hierarchy of terrain tiles and as the camera moves closer to the terrain, existing tiles that do not have sufficient details are replaced by smaller tiles with more details. Each tile has mesh geometry derived from the elevation raster layer and texture from 2D map layers.
The elevation terrain Type can be:
a Flat terrain
a loaded DEM (Raster Layer)
an Online service, loading elevation tiles produced by Mapzen tools – more details at https://registry.opendata.aws/terrain-tiles/
a loaded Mesh dataset
Elevation: Raster or mesh layer to be used for generation of the terrain. The raster layer must contain a band that represents elevation. For a mesh layer, the Z values of the vertices are used.
Vertical scale: Scale factor for vertical axis. Increasing the scale will exaggerate the height of the landforms.
Tile resolution: How many samples from the terrain raster layer to use for each tile. A value of 16px means that the geometry of each tile will consist of 16x16 elevation samples. Higher numbers create more detailed terrain tiles at the expense of increased rendering complexity.
Skirt height: Sometimes it is possible to see small cracks between tiles of the terrain. Raising this value will add vertical walls (“skirts”) around terrain tiles to hide the cracks.
Terrain elevation offset: moves the terrain up or down, e.g. to adjust its elevation with respect to the ground level of other objects in the scene.
Isso pode ser útil quando há uma discrepância entre a altura do terreno e a altura das camadas em sua cena (por exemplo, nuvens de pontos que usam apenas uma altura vertical relativa). Nesse caso, ajustar a elevação do terreno manualmente para coincidir com a elevação dos objetos em sua cena pode melhorar a experiência de navegação.
When a mesh layer is used as terrain, you can configure the Triangles settings (wireframe display, smooth triangles, level of detail) and the Rendering colors settings (as a uniform color or color ramp based). More details in the Mesh layer 3D properties section.
- Terrain shading: Permite a você escolher como o terreno deveria ser renderizado:
Shading disabled - terrain color is determined only from map texture
Shading enabled - terrain color is determined using Phong’s shading model, taking into account map texture, the terrain normal vector, scene light(s) and the terrain material’s Ambient and Specular colors and Shininess
7.4.1.2. Luzes
From the Lights tab, press the  menu to add
up to eight Point lights: emits light in all directions, like a sphere of light filling an area. Objects closer to the light will be brighter, and objects further away will be darker. A point light has a set position (X, Y and Z), a Color, an Intensity and an Attenuation
up to four Directional lights: mimics the lighting that you would get from a giant flash light very far away from your objects, always centered and that never dies off (e.g. the sun). It emits parallel light rays in a single direction but the light reaches out into infinity. A directional light can be rotated given an Azimuth, have an Altitude, a Color and an Intensity.
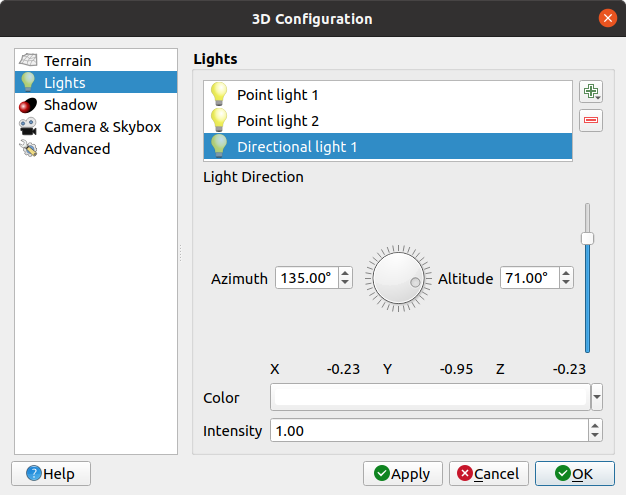
Fig. 7.10 The 3D Map Lights Configuration dialog
7.4.1.3. Sombra
Check Show shadow to display shadow within your scene,
given:
a Directional light
a Shadow rendering maximum distance: to avoid rendering shadow of too distant objects, particularly when the camera looks up along the horizon
a Shadow bias: to avoid self-shadowing effects that could make some areas darker than others, due to differences between map sizes. The lower the better
a Shadow map resolution: to make shadows look sharper. It may result in less performance if the resolution parameter is too high.
7.4.1.4. Camera & Skybox
In this tab, you can override some default camera settings made in the dialog.
Furthermore, check Show skybox to enable skybox rendering
in the scene. The skybox type can be:
Panoramic texture, with a single file providing sight on 360°
Distinct faces, with a texture file for each of the six sides of a box containing the scene
Texture image files of the skybox can be files on the disk, remote URLs or embedded in the project (more details).
7.4.1.5. Avançado
Map tile resolution: Width and height of the 2D map images used as textures for the terrain tiles. 256px means that each tile will be rendered into an image of 256x256 pixels. Higher numbers create more detailed terrain tiles at the expense of increased rendering complexity.
Max. screen error: Determines the threshold for swapping terrain tiles with more detailed ones (and vice versa) - i.e. how soon the 3D view will use higher quality tiles. Lower numbers mean more details in the scene at the expense of increased rendering complexity.
Max. ground error: The resolution of the terrain tiles at which dividing tiles into more detailed ones will stop (splitting them would not introduce any extra detail anyway). This value limits the depth of the hierarchy of tiles: lower values make the hierarchy deep, increasing rendering complexity.
Zoom levels: Shows the number of zoom levels (depends on the map tile resolution and max. ground error).
- Show labels: Ativa/desativa os rótulos de mapa
- Show map tile info: Include border and tile
numbers for the terrain tiles (useful for troubleshooting terrain
issues)
- Show bounding boxes: Show 3D bounding boxes
of the terrain tiles (useful for troubleshooting terrain issues)
- Show camera’s view center
- Show light sources: shows a sphere at light source
origins, allowing easier repositioning and placement of light sources relative
to the scene contents
7.4.2. Opções de navegação
Para explorar a visualização do mapa em 3D:
Tilt the terrain (rotating it around a horizontal axis that goes through the center of the window)
Press the
 Tilt up and
  Tilt down tools
Press Shift and use the up/down keys
Arraste o mouse para frente/para trás com o botão central do mouse pressionado
Pressione Shift e arraste o mouse para frente/para trás com o botão esquerdo do mouse pressionado
Rotacionar o terreno (em torno de um eixo vertical que atravessa o centro da janela)
Turn the compass of the navigation widget to the watching direction
Pressione Shift e use as teclas esquerda/direita
Arraste o mouse para a direita/esquerda com o botão central do mouse pressionado
Pressione Shift e arraste o mouse para a direita/esquerda com o botão esquerdo do mouse pressionado
Mudar a posição da câmera (e o centro de visão), movendo-a em um plano horizontal
Drag the mouse with the left mouse button pressed, and the
Camera control button enabledPress the directional arrows of the navigation widget
Use as teclas para cima/para baixo/esquerda/direita para mover a câmera para frente, para trás, direita e esquerda, respectivamente
Change the camera altitude: press the Page Up/Page Down keys
Alterar a orientação da câmera (a câmera é mantida em sua posição, mas o ponto central da visão se move)
Press Ctrl and use the arrow keys to turn the camera up, down, left and right
Press Ctrl and drag the mouse with the left mouse button pressed
Aumentar e diminuir o zoom
Press the corresponding
Zoom In and
Zoom Out tools of the navigation widgetScroll the mouse wheel (keep Ctrl pressed results in finer zooms)
Drag the mouse with the right mouse button pressed to zoom in (drag down) and out (drag up)
Para redefinir a visualização da câmera, clique no botão :sup:`Zoom completo’ na parte superior do painel de tela 3D.
7.4.3. Criar uma animação
Uma animação é baseada em um conjunto de quadros-chave - posições da câmera em momentos específicos. Para criar uma animação:
Toggle on the
Animations tool, displaying the animation player
widgetClick the
Add keyframe button and enter a Keyframe
time in seconds. The Keyframe combo box now displays the time set.Usando as ferramentas de navegação, mova a câmera para a posição para associar ao tempo atual do quadro-chave.
Repita as etapas anteriores para adicionar quantos quadros-chave (com tempo e posição) forem necessários.
Click the
button to preview the animation. QGIS will generate scenes using
the camera positions/rotations at set times, and interpolating them in between
these keyframes. Various Interpolation modes for animations are
available (eg, linear, inQuad, outQuad, inCirc… – more details at
https://doc.qt.io/qt-5/qeasingcurve.html#EasingFunction-typedef).The animation can also be previewed by moving the time slider. Keeping the Loop box checked will repeatedly run the animation while clicking
stops a running animation.
Click Export animation frames to generate a series of images
representing the scene. Other than the filename Template and the
Output directory, you can set the number of Frames per
second, the Output width and Output height.
7.4.4. Camadas vetoriais 3D
Uma camada vetorial com valores de elevação pode ser mostrada no mapa 3D, marcando Ativar renderizador 3D na seção Vista 3D das propriedades da camada vetorial. Há várias opções disponíveis para controlar a renderização da camada vetorial 3D.
7.5. Barra de Status
A barra de status fornece informações gerais sobre a visualização do mapa e ações processadas ou disponíveis, e oferece ferramentas para gerenciar a visualização do mapa.
7.5.1. Locator bar
No lado esquerdo da barra de status, a barra de localização, um elemento de pesquisa rápida, ajuda você a encontrar e executar qualquer recurso ou opção no QGIS:
Clique no elemento de texto para ativar a barra de pesquisa do localizador ou pressione Ctrl+K.
Type a text associated with the item you are looking for (name, tag, keyword, …). By default, results are returned for the enabled locator filters, but you can limit the search to a certain scope by prefixing your text with the locator filters prefix, ie. typing
l cadwill return only the layers whose name containscad.O filtro também pode ser selecionado com um clique duplo no menu que aparece ao acessar o elemento localizador.
Clicar em um resultado para executar a ação correspondente, dependendo do tipo de item.
Dica
Limit the lookup to particular field(s) of the active layer
By default, a search with the “active layer features” filter (f) runs
through the whole attribute table of the layer. You can limit the search to
a particular field using the @ prefix. E.g., f @name sal or
@name sal returns only the features whose “name” attribute contains ‘sal’.
Text autocompletion is active when writing and the suggestion can be applied
using Tab key.
A more advanced control on the queried fields is possible from the layer Fields tab. Read Propriedades dos campos for details.
Searching is handled using threads, so that results always become available as quickly as possible, even if slow search filters are installed. They also appear as soon as they are encountered by a filter, which means that e.g. a file search filter will show results one by one as the file tree is scanned. This ensures that the UI is always responsive, even if a very slow search filter is present (e.g. one which uses an online service).
Nota
The Nominatim locator tool may behave differently (no autocompletion search, delay of fetching results, …) with respect to the OpenStreetMap Nominatim usage policy.
Dica
Acesso rápido às configurações do localizador
Click on the  icon inside the locator widget on the status bar to
display the list of filters you can use and a Configure entry that
opens the Locator tab of the menu.
icon inside the locator widget on the status bar to
display the list of filters you can use and a Configure entry that
opens the Locator tab of the menu.
7.5.2. Reportando ações
Na área ao lado da barra de localização, um resumo das ações que você executou será mostrado quando necessário (como selecionar feições em uma camada, remover camada, distância e direção da panorâmica) ou uma longa descrição da ferramenta sobre a que você está passando (não disponível para todas as ferramentas).
No caso de operações demoradas, como coleta de estatísticas em camadas matricial, execução de algoritmos de processamento ou renderização de várias camadas na visualização do mapa, uma barra de progresso é exibida na barra de status.
7.5.3. Control the map canvas
A opção ![]() Coordenada mostra a posição atual do mouse, seguindo-o enquanto se move pela visualização do mapa. Você pode definir as unidades (e precisão) na guia . Clique no pequeno botão à esquerda da caixa de texto para alternar entre a opção Coordenada e a opção
Coordenada mostra a posição atual do mouse, seguindo-o enquanto se move pela visualização do mapa. Você pode definir as unidades (e precisão) na guia . Clique no pequeno botão à esquerda da caixa de texto para alternar entre a opção Coordenada e a opção  Extensão que mostra as coordenadas dos cantos inferior-esquerdo e superior direito da visualização do mapa em unidades de mapa.
Next to the coordinate display you will find the Scale display. It shows the scale of the map view. There is a scale selector, which allows you to choose between predefined and custom scales.
On the right side of the scale display, press the  button
to lock the scale to use the magnifier to zoom in or out.
The magnifier allows you to zoom in to a map without altering the map
scale, making it easier to tweak the positions of labels and symbols
accurately.
The magnification level is expressed as a percentage.
If the Magnifier has a level of 100%, then the current map
is not magnified, i.e. is rendered at accurate scale relative to the monitor’s resolution (DPI).
A default magnification value can be defined within
,
which is very useful for high-resolution screens to enlarge small
symbols. In addition, a setting in
controls whether QGIS respects each monitor’s physical DPI or uses the overall system logical DPI.
button
to lock the scale to use the magnifier to zoom in or out.
The magnifier allows you to zoom in to a map without altering the map
scale, making it easier to tweak the positions of labels and symbols
accurately.
The magnification level is expressed as a percentage.
If the Magnifier has a level of 100%, then the current map
is not magnified, i.e. is rendered at accurate scale relative to the monitor’s resolution (DPI).
A default magnification value can be defined within
,
which is very useful for high-resolution screens to enlarge small
symbols. In addition, a setting in
controls whether QGIS respects each monitor’s physical DPI or uses the overall system logical DPI.
À direita da ferramenta de ampliação, você pode definir uma rotação atual no sentido horário para a visualização do mapa em graus.
On the right side of the status bar, there is a small checkbox which can be used temporarily to prevent layers being rendered to the map view (see section Renderização).
To the right of the render functions, you find the  EPSG:code button showing the current project CRS. Clicking
on this opens the Project Properties dialog and lets you
apply another CRS to the map view.
EPSG:code button showing the current project CRS. Clicking
on this opens the Project Properties dialog and lets you
apply another CRS to the map view.
Dica
Calculando a escala correta do seu Mapa da tela/visualização
When you start QGIS, the default CRS is WGS 84 (EPSG 4326) and
units are degrees. This means that QGIS will interpret any
coordinate in your layer as specified in degrees.
To get correct scale values, you can either manually change this
setting in the General tab under
(e.g. to meters), or you
can use the EPSG:code icon seen above.
In the latter case, the units are set to what the project projection
specifies (e.g., +units=us-ft).
Observe que a escolha do SRC no começo pode ser definida em .
7.5.4. Mensagens
The  Messages button next to it opens the
Log Messages Panel which has information on underlying
processes (QGIS startup, plugins loading, processing tools…)
Messages button next to it opens the
Log Messages Panel which has information on underlying
processes (QGIS startup, plugins loading, processing tools…)
Depending on the Plugin Manager settings,
the status bar can sometimes show icons to the right to inform you
about the availability of new ( ) or upgradeable (
 )
plugins.
Click the icon to open the Plugin Manager dialog.
)
plugins.
Click the icon to open the Plugin Manager dialog.