24.3. A Barra de Ferramentas
The Processing Toolbox is the main element of the processing GUI, and the one that you are more likely to use in your daily work. It shows the list of all available algorithms grouped in different blocks called Providers, and custom models and scripts you can add to extend the set of tools. Hence the toolbox is the access point to run them, whether as a single process or as a batch process involving several executions of the same algorithm on different sets of inputs.
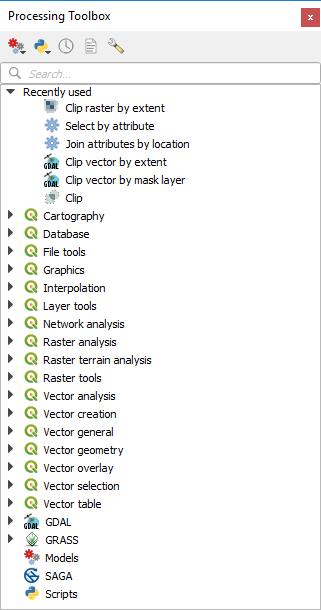
Fig. 24.6 Processamento
Providers can be (de)activated in the Processing settings dialog. By default, only providers that do not rely on third-party applications (that is, those that only require QGIS elements to be run) are active. Algorithms requiring external applications might need additional configuration. Configuring providers is explained in a later chapter in this manual.
In the upper part of the toolbox dialog, you will find a set of tools to:
work with
 Models: Create New Model…,
Open Existing Model… and Add Model to Toolbox…;
Models: Create New Model…,
Open Existing Model… and Add Model to Toolbox…;work with
 Scripts: Create New Script…,
Create New Script from Template…, Open Existing
Script… and Add Script to Toolbox…;
Scripts: Create New Script…,
Create New Script from Template…, Open Existing
Script… and Add Script to Toolbox…;toggle the toolbox to the in-place modification mode using the
 Edit Features In-Place button: only
the algorithms that are suitable to be executed on the active layer without
outputting a new layer are displayed;
Below this toolbar is a  Search… box to help you easily find
the tools you need.
You can enter any word or phrase on the text box. Notice that, as you type, the
number of algorithms, models or scripts in the toolbox is reduced to just those
that contain the text you have entered in their names or keywords.
Nota
No topo da lista de algoritmos são exibidas as ferramentas utilizadas mais recentemente; útil se você quiser reexecutar alguma.
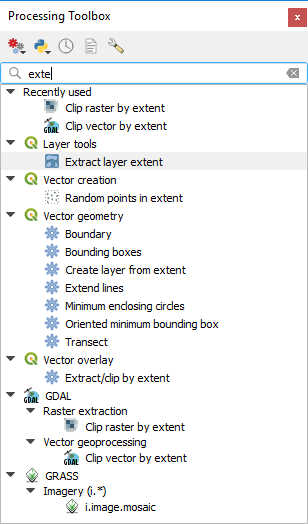
Fig. 24.7 Caixa de ferramentas de processamento mostrando os resultados da pesquisa
Para executar uma ferramenta, basta clicar duas vezes sobre seu nome na caixa de ferramentas.
24.3.1. O diálogo do algoritmo
Once you double-click on the name of the algorithm that you want to execute, a
dialog similar to that in the Fig. 24.8 below is shown
(in this case, the dialog corresponds to the Centroids algorithm).
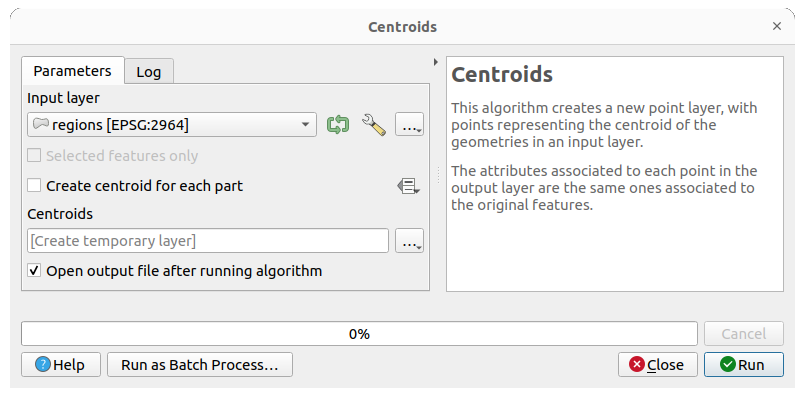
Fig. 24.8 Diálogo Algoritmo - Parâmetros
The dialog shows two tabs (Parameters and Log) on the left part, the algorithm description on the right, and a set of buttons at the bottom.
The Parameters tab is used to set the input values that the algorithm needs to be executed. It shows a list of input values and configuration parameters to be set. It of course has a different content, depending on the requirements of the algorithm to be executed, and is created automatically based on those requirements.
Embora o número e tipo de parâmetros dependerem das características do algoritmo, a estrutura é semelhante para todos eles. Os parâmetros encontrados na tabela podem ser de um dos seguintes tipos.
Uma camada raster, para selecionar de uma lista de todas as camadas disponíveis (atualmente abertas) no QGIS. O seletor contém também um botão no lado direito, para permitir que você selecione nomes de arquivos que representam camadas atualmente não carregadas no QGIS.
A vector layer, to select from a list of all vector layers available in QGIS. Layers not loaded in QGIS can be selected as well, as in the case of raster layers, but only if the algorithm does not require a table field selected from the attributes table of the layer. In that case, only opened layers can be selected, since they need to be open so as to retrieve the list of field names available.
Você verá um botão iterador por cada seletor de camadas vetoriais, como mostrado na figura abaixo.

Fig. 24.9 Botão de iteração vetorial
Se o algoritmo contém vários deles, você será capaz de alternar apenas um deles. Se o botão que corresponde a um vetor de entrada é alternado, o algoritmo será executado de forma iterativa em cada uma de suas características, em vez de apenas uma vez para toda a camada, produzindo o maior número de saídas em vezes do algoritmo ser executado. Isto permite a automatização do processo quando todas as características de uma camada ter que ser tratada separadamente.
Nota
By default, the parameters dialog will show a description of the CRS of each layer along with its name. If you do not want to see this additional information, you can disable this functionality in the Processing Settings dialog, unchecking the option.
A table, to select from a list of all available in QGIS. Non-spatial tables are loaded into QGIS like vector layers, and in fact they are treated as such by the program. Currently, the list of available tables that you will see when executing an algorithm that needs one of them is restricted to tables coming from files in dBase (
.dbf) or Comma-Separated Values (.csv) formats.Uma opção, para escolher a partir de uma lista de seleção de opções possíveis.
A numerical value, to be introduced in a spin box. In some contexts (when the parameter applies at the feature level and not at the layer’s), you will find a
 Data-defined override button by its side, allowing
you to open the expression builder and enter a
mathematical expression to generate variable values for the parameter. Some useful
variables related to data loaded into QGIS can be added to your expression, so
you can select a value derived from any of these variables, such as the cell size
of a layer or the northernmost coordinate of another one.
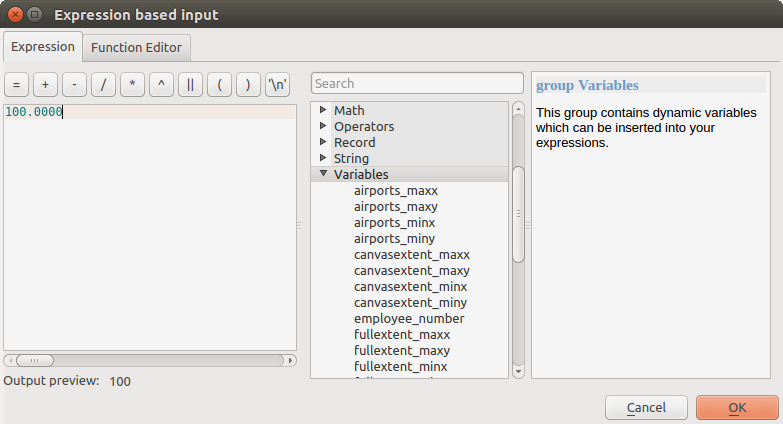
Fig. 24.10 Entrada baseada em expressão
Um intervalo, com valores mínimo e máximo a serem introduzidos em duas caixas de texto.
A text string, to be introduced in a text box.
A field, to choose from the attributes table of a vector layer or a single table selected in another parameter.
A coordinate reference system. You can select it among the recently used ones from the drop-down list or from the CRS selection dialog that appears when you click on the button on the right-hand side.
An extent, a text box defining a rectangle through its corners coordinate in the format
xmin, xmax, ymin, ymax. Clicking on the button on the right-hand side of the value selector, a pop-up menu will appear, giving you options to:Calculate from layer: fills the text box with the coordinates of the bounding box of a layer to select among the loaded ones
Use map canvas extent
Draw on canvas: the parameters window will hide itself, so you can click and drag onto the canvas. Once you have defined the extent rectangle, the dialog will reappear, containing the values in the extent text box.
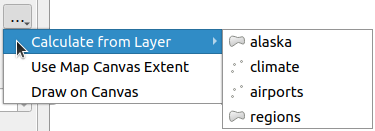
Fig. 24.11 Seletor de extensão
A list of elements (whether raster or vector layers, tables, fields) to select from. Click on the … button at the left of the option to see a dialog like the following one. Multiple selection is allowed and when the dialog is closed, number of selected items is displayed in the parameter text box widget.
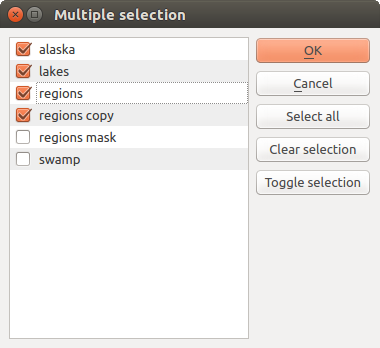
Fig. 24.12 Seleção Múltipla
A tabela pequena a ser editada pelo usuário. Estes são usados para definir parâmetros como tabelas de pesquisa ou kernels de convolução, entre outros.
Clique no botão do lado direito para ver a tabela e editar os seus valores.
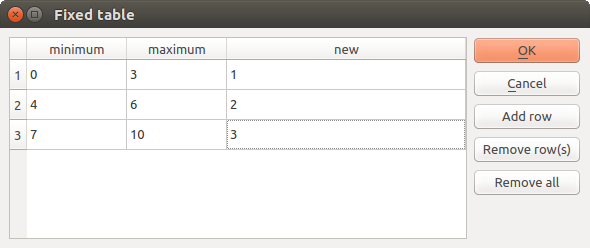
Fig. 24.13 Tabela fixa
Dependendo do algoritmo, o número de linhas pode ser modificado ou não, utilizando os botões do lado direito da janela.
Nota
Some algorithms require many parameters to run, e.g. in the
Calculadora Raster you have to specify manually the cell size, the
extent and the CRS. You can avoid to choose all the parameters manually when
the algorithm has the Reference layers parameter. With this parameter you
can choose the reference layer and all its properties (cell size, extent, CRS)
will be used.
Along with the Parameters tab, there is another tab named Log (see Fig. 24.14 below). Information provided by the algorithm during its execution is written in this tab, and allow you to track the execution and be aware and have more details about the algorithm as it runs. Information on algorithm execution is also output in the .
Notice that not all algorithms write information to the Log tab, and many of them might run silently without producing any output other than the final files. Check the Log Messages Panel in that case.
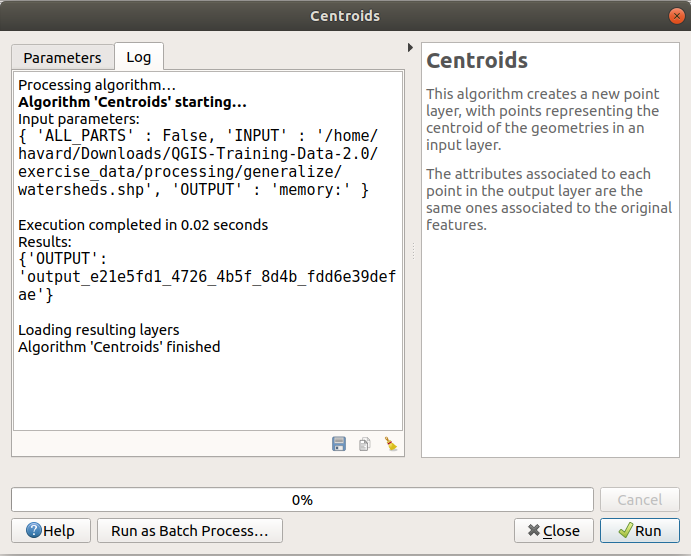
Fig. 24.14 Algorithm Dialog - Log
At the bottom of the Log tab you will find buttons to
 Save Log to File,
  Copy
Log to Clipboard and
 ![]() Clear Log.
These are particularly handy when you have checked the
Keep dialog open after running algorithm in the
General part of the Processing options.
Clear Log.
These are particularly handy when you have checked the
Keep dialog open after running algorithm in the
General part of the Processing options.
No lado direito da caixa de diálogo, você encontrará uma breve descrição do algoritmo, que o ajudará a entender seu propósito e suas ideias básicas. Se tal descrição não estiver disponível, o painel de descrição não será exibido.
For a more detailed help file, which might include description of every parameter it uses, or examples, you will find a Help button at the bottom of the dialog bringing you to the Processing algorithms documentation or to the provider documentation (for some third-party providers).
The Run as batch process button triggers the batch processing mode allowing to configure and run multiple instances of the algorithm with a variety of parameters.
24.3.1.1. Uma nota nas projeções
Processing algorithm execution are always performed in the input layer coordinate reference system (CRS). Due to QGIS’s on-the-fly reprojecting capabilities, although two layers might seem to overlap and match, that might not be true if their original coordinates are used without reprojecting them onto a common coordinate system. Whenever you use more than one layer as input to a QGIS native algorithm, whether vector or raster, the layers will all be reprojected to match the coordinate reference system of the first input layer.
No entanto, isso é menos verdadeiro para a maioria dos aplicativos externos cujos algoritmos são expostos por meio da estrutura de processamento, pois assumem que todas as camadas já estão em um sistema de coordenadas comum e prontas para serem analisadas.
By default, the parameters dialog will show a description of the CRS of each layer along with its name, making it easy to select layers that share the same CRS to be used as input layers. If you do not want to see this additional information, you can disable this functionality in the Processing settings dialog, unchecking the Show layer CRS definition in selection boxes option.
If you try to execute an algorithm using as input two or more layers with unmatching CRSs, a warning dialog will be shown. This occurs thanks to the Warn before executing if layer CRS’s do not match option.
Pode continuar a executar o algoritmo, mas tenha atenção que na maioria dos casos irá produzir resultados errados, tais como, camadas vazias devido à falta de sobreposição das camadas usadas como arquivos de entrada.
Dica
Use algoritmos de processamento para fazer reprojeção intermediária
Quando um algoritmo não pode executar com sucesso em várias camadas de entrada devido a SRC’s não correspondentes, utilize o algoritmo interno QGIS como :ref:`qgisreprojetarcamada’ para executar a reprojeção de camadas para a mesma SRC antes de executar o algoritmo utilizando estas saídas.
24.3.2. Objetos de dados gerados por algoritmos
Objetos de dados gerado por um algoritmo podem ser dos seguintes tipos:
Uma camada raster
Uma camada vetorial
Uma tabela
Um arquivo HTML (usado para arquivo de saída de texto e gráficos)
These are all saved to disk, and the parameters table will contain a text box corresponding to each one of these outputs, where you can type the output channel to use for saving it. An output channel contains the information needed to save the resulting object somewhere. In the most usual case, you will save it to a file, but in the case of vector layers, and when they are generated by native algorithms (algorithms not using external applications) you can also save to a PostGIS, GeoPackage or SpatiaLite database, or a memory layer.
Para selecionar um canal de saída, basta clicar no botão do lado direito da caixa de texto e você verá um pequeno menu de contexto com as opções disponíveis.
No caso mais comum, você selecionará salvar em um arquivo. Se você selecionar essa opção, será exibida uma caixa de diálogo para salvar arquivo, onde você poderá selecionar o caminho do arquivo desejado. As extensões de arquivo suportadas são mostradas no seletor de formato de arquivo da caixa de diálogo, dependendo do tipo de saída e do algoritmo.
The format of the output is defined by the filename extension. The supported
formats depend on what is supported by the algorithm itself. To select a format,
just select the corresponding file extension (or add it, if you are directly typing
the file path instead). If the extension of the file path you entered does not
match any of the supported formats, a default extension will be
appended to the file path, and the file format corresponding to that extension will
be used to save the layer or table. Default extensions are .dbf for
tables, .tif for raster layers and .gpkg for vector layers. These
can be modified in the setting dialog, selecting any other of the formats supported
by QGIS.
If you do not enter any filename in the output text box (or select the corresponding option in the context menu), the result will be saved as a temporary file in the corresponding default file format, and it will be deleted once you exit QGIS (take care with that, in case you save your project and it contains temporary layers).
You can set a default folder for output data objects. Go to the settings
dialog (you can open it from the
menu), and in the
General group, you will find a parameter named Output folder.
This output folder is used as the default path in case you type just a filename
with no path (i.e., myfile.shp) when executing an algorithm.
Ao executar um algoritmo que usa uma camada de vetor no modo interativo, o caminho do arquivo digitado é utilizado como o caminho de base para todos os arquivos gerados, que são nomeados com o nome de base e acrescentando-se um número que representa o índice da iteração. A extensão do arquivo (e formato) é usado para todos esses arquivos gerados.
Apart from raster layers and tables, algorithms also generate graphics and text as HTML files. These results are shown at the end of the algorithm execution in a new dialog. This dialog will keep the results produced by any algorithm during the current session, and can be shown at any time by selecting from the QGIS main menu.
Some external applications might have files (with no particular extension restrictions) as output, but they do not belong to any of the categories above. Those output files will not be processed by QGIS (opened or included into the current QGIS project), since most of the time they correspond to file formats or elements not supported by QGIS. This is, for instance, the case with LAS files used for LiDAR data. The files get created, but you won’t see anything new in your QGIS working session.
Para todos os outros tipos de saída, você encontrará uma caixa de verificação que você pode usar para dizer o algoritmo para saber se carregará o arquivo, uma vez que é gerado pelo algoritmo ou não. Por padrão, todos os arquivos são abertos.
Optional outputs are not supported. That is, all outputs are created. However, you can uncheck the corresponding checkbox if you are not interested in a given output, which essentially makes it behave like an optional output (in other words, the layer is created anyway, but if you leave the text box empty, it will be saved to a temporary file and deleted once you exit QGIS).


