25.1.15. Análise vetorial
25.1.15.1. Estatísticas básicas para campos
Gera estatísticas básicas para um campo da tabela de atributos de uma camada vetorial.
Numeric, date, time and string fields are supported.
As estatísticas retornadas dependerão do tipo de campo.
Statistics are generated as an HTML file and are available in the .
Default menu:
Parâmetros
Etiqueta |
Nome |
Tipo |
Descrição |
|---|---|---|---|
Input vector |
|
[vetor: qualquer] |
Camada vetorial para calcular as estatísticas |
Campo para calcular as estatísticas |
“NOME_CAMPO” |
[tablefield: any] |
Qualquer campo de tabela suportado para calcular as estatísticas |
Estatísticas Opcional |
|
[html] Padrão: |
Especificação do arquivo para as estatísticas calculadas. Um de:
|
Saídas
Etiqueta |
Nome |
Tipo |
Descrição |
|---|---|---|---|
Estatísticas |
|
[html] |
HTML file with the calculated statistics |
Contagem |
|
[número] |
|
Número de valores únicos |
|
[número] |
|
Number of empty (null) values |
|
[número] |
|
Número de valores não vazios |
|
[número] |
|
Valor mínimo |
|
[same as input] |
|
Valor máximo |
|
[same as input] |
|
Comprimento mínimo |
|
[número] |
|
Comprimento máximo |
|
[número] |
|
Comprimento médio |
|
[número] |
|
Coeficiente de variação |
|
[número] |
|
Soma |
|
[número] |
|
Valor médio |
`` MÉDIA`` |
[número] |
|
Desvio padrão |
|
[número] |
|
Intervalo |
|
[número] |
|
Mediana |
|
[número] |
|
Minoria (valor de ocorrência mais rara) |
|
[same as input] |
|
Maioria (valor que ocorre com mais frequência) |
`` MAIORIA`` |
[same as input] |
|
Primeiro quartil |
|
[número] |
|
Terceiro quartil |
|
[número] |
|
Interquartile Range (IQR) |
|
[número] |
Código Python
Algorithm ID: qgis:basicstatisticsforfields
import processing
processing.run("algorithm_id", {parameter_dictionary})
The algorithm id is displayed when you hover over the algorithm in the Processing Toolbox. The parameter dictionary provides the parameter NAMEs and values. See Usando os algoritmos do processamento a partir do Terminal Python. for details on how to run processing algorithms from the Python console.
25.1.15.2. Climb along line
Calculates the total climb and descent along line geometries. The input layer must have Z values present. If Z values are not available, the Drape (configure o valor Z do raster) algorithm may be used to add Z values from a DEM layer.
The output layer is a copy of the input layer with additional fields
that contain the total climb (climb), total descent (descent),
the minimum elevation (minelev) and the maximum elevation
(maxelev) for each line geometry.
If the input layer contains fields with the same names as these added
fields, they will be renamed (field names will be altered to “name_2”,
“name_3”, etc, finding the first non-duplicate name).
Parâmetros
Etiqueta |
Nome |
Tipo |
Descrição |
|---|---|---|---|
Camada de linha |
|
[vetor: linha] |
Line layer to calculate the climb for. Must have Z values |
Climb layer |
|
[vetor: linha] Padrão: |
Specification of the output (line) layer. One of:
A codificação do arquivo também pode ser alterada aqui. |
Saídas
Etiqueta |
Nome |
Tipo |
Descrição |
|---|---|---|---|
Climb layer |
|
[vetor: linha] |
Line layer containing new attributes with the results from climb calculations. |
Total climb |
|
[número] |
The sum of the climb for all the line geometries in the input layer |
Total descent |
|
[número] |
The sum of the descent for all the line geometries in the input layer |
Elevação mínima |
|
[número] |
A elevação mínima para as geometrias na camada |
Elevação máxima |
|
[número] |
A elevação máxima para as geometrias na camada |
Código Python
Algorithm ID: qgis:climbalongline
import processing
processing.run("algorithm_id", {parameter_dictionary})
The algorithm id is displayed when you hover over the algorithm in the Processing Toolbox. The parameter dictionary provides the parameter NAMEs and values. See Usando os algoritmos do processamento a partir do Terminal Python. for details on how to run processing algorithms from the Python console.
25.1.15.3. Contar pontos em polígono
Takes a point and a polygon layer and counts the number of points from the point layer in each of the polygons of the polygon layer.
A new polygon layer is generated, with the exact same content as the input polygon layer, but containing an additional field with the points count corresponding to each polygon.
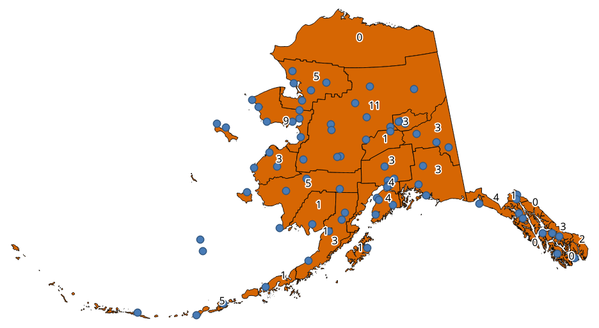
Fig. 25.31 Os rótulos nos polígonos mostram a contagem de pontos
An optional weight field can be used to assign weights to each point. Alternatively, a unique class field can be specified. If both options are used, the weight field will take precedence and the unique class field will be ignored.
Menu padrão:
Parâmetros
Etiqueta |
Nome |
Tipo |
Descrição |
|---|---|---|---|
Polígonos |
|
[vetor: polígono] |
Polygon layer whose features are associated with the count of points they contain |
Pontos |
|
[vetor: ponto] |
Point layer with features to count |
Campo de peso Opcional |
|
[tablefield: any] |
A field from the point layer.
The count generated will be the sum of the weight field of the
points contained by the polygon.
If the weight field is not numeric, the count will be |
Campo de classe Opcional |
|
[tablefield: any] |
Os pontos são classificados com base no atributo selecionado e se vários pontos com o mesmo valor de atributo estiverem dentro do polígono, apenas um deles será contado. A contagem final dos pontos em um polígono é, portanto, a contagem das diferentes classes que nele se encontram. |
Count field name |
|
[string] Padrão: ‘NUMPONTOS’ |
O nome do campo para armazenar a contagem de pontos |
Contagem |
|
[vetor: polígono] Padrão: |
Especificação da camada de saída. Uma de:
A codificação do arquivo também pode ser alterada aqui. |
Saídas
Etiqueta |
Nome |
Tipo |
Descrição |
|---|---|---|---|
Contagem |
|
[vetor: polígono] |
Resulting layer with the attribute table containing the new column with the points count |
Código Python
Algorithm ID: native:countpointsinpolygon
import processing
processing.run("algorithm_id", {parameter_dictionary})
The algorithm id is displayed when you hover over the algorithm in the Processing Toolbox. The parameter dictionary provides the parameter NAMEs and values. See Usando os algoritmos do processamento a partir do Terminal Python. for details on how to run processing algorithms from the Python console.
25.1.15.4. DBSCAN clustering
Clusters point features based on a 2D implementation of Density-based spatial clustering of applications with noise (DBSCAN) algorithm.
O algoritmo requer dois parâmetros, um tamanho mínimo de agrupamento e a distância máxima permitida entre os pontos agrupados.
Ver também
Parâmetros
Parâmetros básicos
Etiqueta |
Nome |
Tipo |
Descrição |
|---|---|---|---|
Camada de entrada |
|
[vetor: ponto] |
Camada a ser analisada |
Tamanho mínimo do conjunto |
|
[número] Padrão: 5 |
Número mínimo de feições para gerar um conjunto |
Maximum distance between clustered points |
|
[número] Padrão: 1.0 |
Distance beyond which two features can not belong to the same cluster (eps) |
Conjuntos |
|
[vetor: ponto] Padrão: |
Specify the vector layer for the result of the clustering. One of:
A codificação do arquivo também pode ser alterada aqui. |
Parâmetros avançados
Etiqueta |
Nome |
Tipo |
Descrição |
|---|---|---|---|
Treat border points as noise (DBSCAN*) Opcional |
|
[boleano] Padrão: Falso |
If checked, points on the border of a cluster are themselves treated as unclustered points, and only points in the interior of a cluster are tagged as clustered. |
Cluster field name |
“NOME_CAMPO” |
[string] Default: ‘CLUSTER_ID’ |
Name of the field where the associated cluster number shall be stored |
Cluster size field name |
|
[string] Default: ‘CLUSTER_SIZE’ |
Nome do campo com a contagem de feições no mesmo grupo |
Saídas
Etiqueta |
Nome |
Tipo |
Descrição |
|---|---|---|---|
Conjuntos |
|
[vetor: ponto] |
Vector layer containing the original features with a field setting the cluster they belong to |
Número de agrupamentos |
|
[número] |
O número de agrupamentos descobertos |
Código Python
Algorithm ID: native:dbscanclustering
import processing
processing.run("algorithm_id", {parameter_dictionary})
The algorithm id is displayed when you hover over the algorithm in the Processing Toolbox. The parameter dictionary provides the parameter NAMEs and values. See Usando os algoritmos do processamento a partir do Terminal Python. for details on how to run processing algorithms from the Python console.
25.1.15.5. Matriz de distância
Calculates for point features distances to their nearest features in the same layer or in another layer.
Default menu:
Ver também
Parâmetros
Etiqueta |
Nome |
Tipo |
Descrição |
|---|---|---|---|
Input point layer |
|
[vetor: ponto] |
Point layer for which the distance matrix is calculated (from points) |
Input unique ID field |
|
[tablefield: any] |
Field to use to uniquely identify features of the input layer. Used in the output attribute table. |
Target point layer |
|
[vetor: ponto] |
Point layer containing the nearest point(s) to search (to points) |
Target unique ID field |
|
[tablefield: any] |
Field to use to uniquely identify features of the target layer. Used in the output attribute table. |
Output matrix type |
|
[enumeração] Padrão: 0 |
Diferentes tipos de cálculo estão disponíveis:
|
Use apenas os pontos alvo (k) mais próximos |
|
[número] Padrão: 0 |
You can choose to calculate the distance to all the points in the target layer (0) or limit to a number (k) of closest features. |
Distance matrix |
|
[vetor: ponto] Padrão: |
Especificação da camada vetorial de saída. Um de:
A codificação do arquivo também pode ser alterada aqui. |
Saídas
Etiqueta |
Nome |
Tipo |
Descrição |
|---|---|---|---|
Distance matrix |
|
[vetor: ponto] |
Point (or MultiPoint for the “Linear (N * k x 3)” case) vector layer containing the distance calculation for each input feature. Its features and attribute table depend on the selected output matrix type. |
Código Python
Algorithm ID: qgis:distancematrix
import processing
processing.run("algorithm_id", {parameter_dictionary})
The algorithm id is displayed when you hover over the algorithm in the Processing Toolbox. The parameter dictionary provides the parameter NAMEs and values. See Usando os algoritmos do processamento a partir do Terminal Python. for details on how to run processing algorithms from the Python console.
25.1.15.6. Distance to nearest hub (line to hub)
Creates lines that join each feature of an input vector to the nearest feature in a destination layer. Distances are calculated based on the center of each feature.
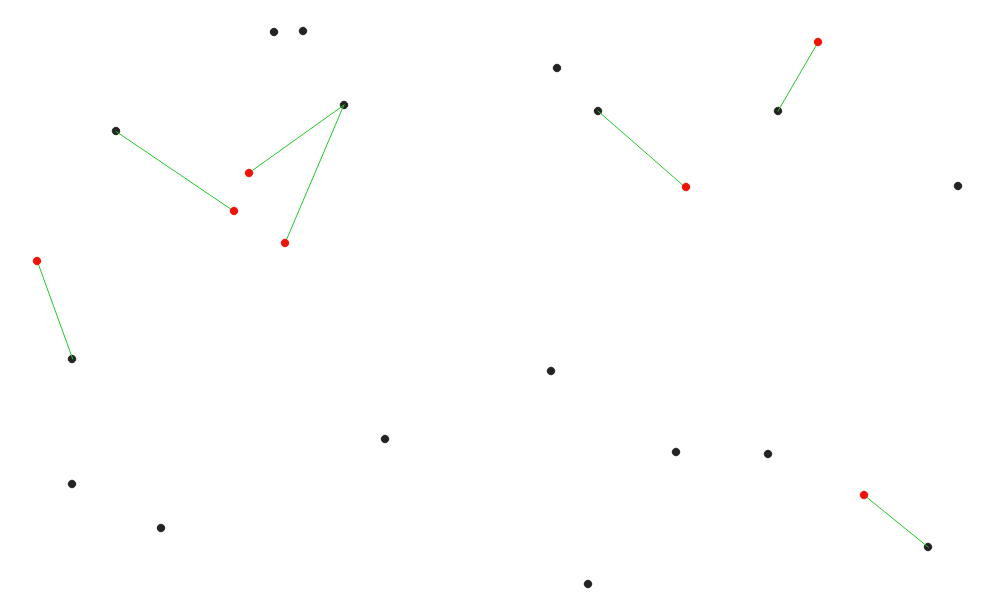
Fig. 25.32 Display the nearest hub for the red input features
Parâmetros
Etiqueta |
Nome |
Tipo |
Descrição |
|---|---|---|---|
Source points layer |
|
[vetor: qualquer] |
Vector layer for which the nearest feature is searched |
Destination hubs layer |
|
[vetor: qualquer] |
Camada vetorial contendo as feições a serem pesquisadas |
Hub layer name attribute |
|
[tablefield: any] |
Campo a ser usado para identificar exclusivamente as feições da camada de destino. Usado na tabela de atributos de saída |
Unidade de medida |
|
[enumeração] Padrão: 0 |
Unidades nas quais relatar a distância até a feição mais próxima:
|
Hub distance |
|
[vetor: linha] Padrão: |
Especificar a camada vetorial da linha de saída conectando os pontos correspondentes. Um de:
A codificação do arquivo também pode ser alterada aqui. |
Saídas
Etiqueta |
Nome |
Tipo |
Descrição |
|---|---|---|---|
Hub distance |
|
[vetor: linha] |
Line vector layer with the attributes of the input features, the identifier of their closest feature and the calculated distance. |
Código Python
Algorithm ID: qgis:distancetonearesthublinetohub
import processing
processing.run("algorithm_id", {parameter_dictionary})
The algorithm id is displayed when you hover over the algorithm in the Processing Toolbox. The parameter dictionary provides the parameter NAMEs and values. See Usando os algoritmos do processamento a partir do Terminal Python. for details on how to run processing algorithms from the Python console.
25.1.15.7. Distance to nearest hub (points)
Creates a point layer representing the center of the input features with the addition of two fields containing the identifier of the nearest feature (based on its center point) and the distance between the points.
Parâmetros
Etiqueta |
Nome |
Tipo |
Descrição |
|---|---|---|---|
Source points layer |
|
[vetor: qualquer] |
Vector layer for which the nearest feature is searched |
Destination hubs layer |
|
[vetor: qualquer] |
Camada vetorial contendo as feições a serem pesquisadas |
Hub layer name attribute |
|
[tablefield: any] |
Campo a ser usado para identificar exclusivamente as feições da camada de destino. Usado na tabela de atributos de saída |
Unidade de medida |
|
[enumeração] Padrão: 0 |
Unidades nas quais relatar a distância até a feição mais próxima:
|
Hub distance |
|
[vetor: ponto] Padrão: |
Specify the output point vector layer with the nearest hub. One of:
A codificação do arquivo também pode ser alterada aqui. |
Saídas
Etiqueta |
Nome |
Tipo |
Descrição |
|---|---|---|---|
Hub distance |
|
[vetor: ponto] |
Point vector layer representing the center of the source features with their attributes, the identifier of their closest feature and the calculated distance. |
Código Python
Algorithm ID: qgis:distancetonearesthubpoints
import processing
processing.run("algorithm_id", {parameter_dictionary})
The algorithm id is displayed when you hover over the algorithm in the Processing Toolbox. The parameter dictionary provides the parameter NAMEs and values. See Usando os algoritmos do processamento a partir do Terminal Python. for details on how to run processing algorithms from the Python console.
25.1.15.8. Join by lines (hub lines)
Creates hub and spoke diagrams by connecting lines from points on the Spoke layer to matching points in the Hub layer.
Determination of which hub goes with each point is based on a match between the Hub ID field on the hub points and the Spoke ID field on the spoke points.
Se as camadas de entrada não forem camadas de pontos, um ponto na superfície das geometrias será considerado como o local de conexão.
Opcionalmente, podem ser criadas linhas geodésicas, que representam o caminho mais curto na superfície de um elipsóide. Quando o modo geodésico é usado, é possível dividir as linhas criadas no antimeridiano (±180 graus de longitude), o que pode melhorar a renderização das linhas. Além disso, a distância entre os vértices pode ser especificada. Uma distância menor resulta em uma linha mais densa e precisa.
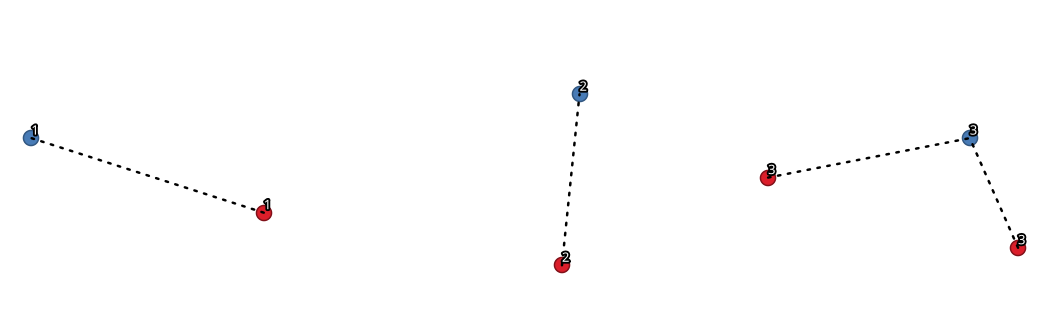
Fig. 25.33 Unir pontos com base em um campo/atributo comum
Parâmetros
Parâmetros básicos
Etiqueta |
Nome |
Tipo |
Descrição |
|---|---|---|---|
Hub layer |
|
[vetor: qualquer] |
Camada de entrada |
Hub ID field |
|
[tablefield: any] |
Field of the hub layer with ID to join |
Hub layer fields to copy (leave empty to copy all fields) Opcional |
|
[tablefield: any] [list] |
The field(s) of the hub layer to be copied. If no field(s) are chosen all fields are taken. |
Spoke layer |
|
[vetor: qualquer] |
Additional spoke point layer |
Spoke ID field |
|
[tablefield: any] |
Field of the spoke layer with ID to join |
Spoke layer fields to copy (leave empty to copy all fields) Opcional |
|
[tablefield: any] [list] |
Field(s) of the spoke layer to be copied. If no fields are chosen all fields are taken. |
Criar linhas geodésicas |
|
[boleano] Padrão: Falso |
Criar linhas geodésicas (o caminho mais curto na superfície de um elipsóide) |
Hub lines |
|
[vetor: linha] Padrão: |
Specify the output hub line vector layer. One of:
A codificação do arquivo também pode ser alterada aqui. |
Parâmetros avançados
Etiqueta |
Nome |
Tipo |
Descrição |
|---|---|---|---|
Distância entre vértices (somente linhas geodésicas) |
|
[número] Padrão: 1000.0 (quilômetros) |
Distância entre vértices consecutivos (em quilômetros). Uma distância menor resulta em uma linha mais densa e precisa |
Linhas divididas em antimeridiano (±180 graus de longitude) |
|
[boleano] Padrão: Falso |
Split lines at ±180 degrees longitude (to improve rendering of the lines) |
Saídas
Etiqueta |
Nome |
Tipo |
Descrição |
|---|---|---|---|
Hub lines |
|
[vetor: linha] |
The resulting line layer connecting matching points in input layers |
Código Python
Algorithm ID: native:hublines
import processing
processing.run("algorithm_id", {parameter_dictionary})
The algorithm id is displayed when you hover over the algorithm in the Processing Toolbox. The parameter dictionary provides the parameter NAMEs and values. See Usando os algoritmos do processamento a partir do Terminal Python. for details on how to run processing algorithms from the Python console.
25.1.15.9. K-means clustering
Calculates the 2D distance based k-means cluster number for each input feature.
K-means clustering aims to partition the features into k clusters in which each feature belongs to the cluster with the nearest mean. The mean point is represented by the barycenter of the clustered features.
If input geometries are lines or polygons, the clustering is based on the centroid of the feature.
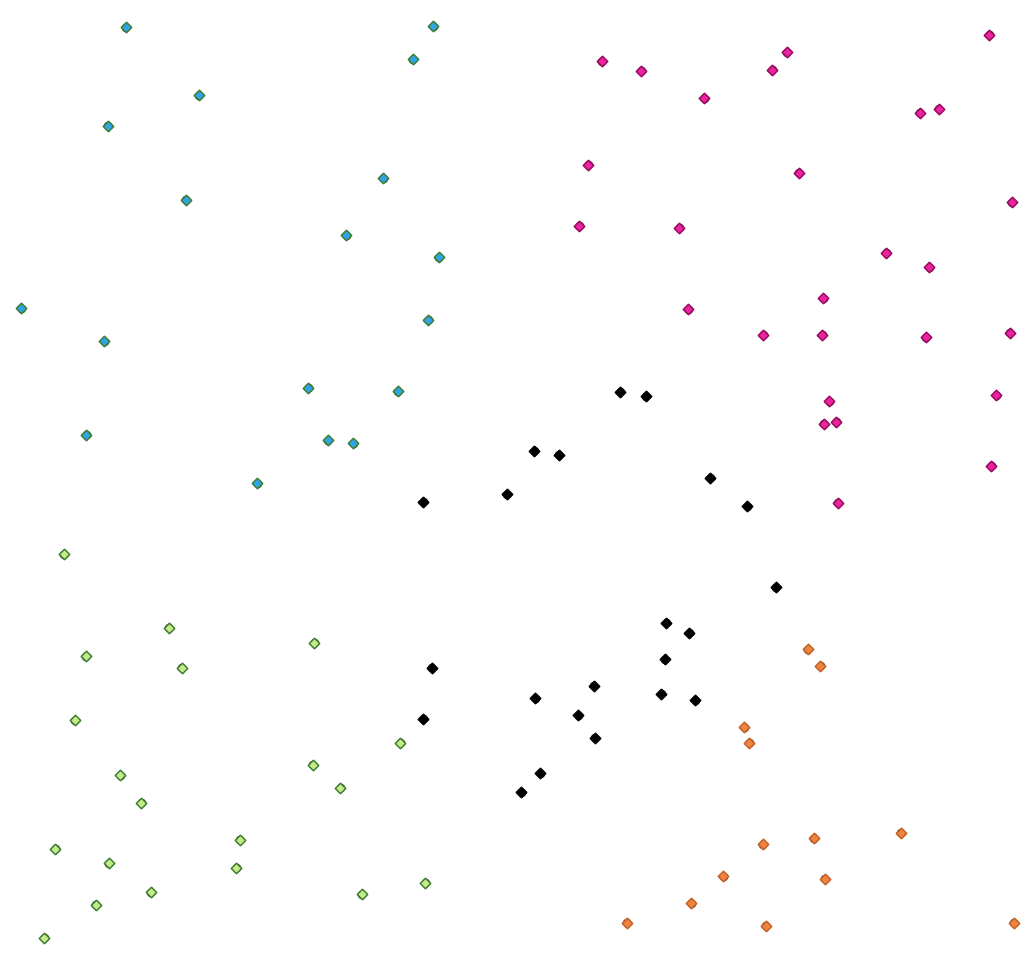
Fig. 25.34 A five class point clusters
Ver também
Parâmetros
Etiqueta |
Nome |
Tipo |
Descrição |
|---|---|---|---|
Camada de entrada |
|
[vetor: qualquer] |
Camada a ser analisada |
Número de agrupamentos |
|
[número] Padrão: 5 |
Número de clusters a serem criados com as feições |
Conjuntos |
|
[vetor: qualquer] Padrão: |
Especifique a camada de vetor de saída para os clusters gerados. Um de:
A codificação do arquivo também pode ser alterada aqui. |
Parâmetros avançados
Etiqueta |
Nome |
Tipo |
Descrição |
|---|---|---|---|
Cluster field name |
“NOME_CAMPO” |
[string] Default: ‘CLUSTER_ID’ |
Name of the field where the associated cluster number shall be stored |
Cluster size field name |
|
[string] Default: ‘CLUSTER_SIZE’ |
Nome do campo com a contagem de feições no mesmo grupo |
Saídas
Etiqueta |
Nome |
Tipo |
Descrição |
|---|---|---|---|
Conjuntos |
|
[vetor: qualquer] |
Vector layer containing the original features with fields specifying the cluster they belong to and their number in it |
Código Python
Algorithm ID: native:kmeansclustering
import processing
processing.run("algorithm_id", {parameter_dictionary})
The algorithm id is displayed when you hover over the algorithm in the Processing Toolbox. The parameter dictionary provides the parameter NAMEs and values. See Usando os algoritmos do processamento a partir do Terminal Python. for details on how to run processing algorithms from the Python console.
25.1.15.10. Listar valores únicos
Lista valores exclusivos de um campo de tabela de atributos e conta seu número.
Default menu:
Parâmetros
Etiqueta |
Nome |
Tipo |
Descrição |
|---|---|---|---|
Camada de entrada |
|
[vetor: qualquer] |
Camada a ser analisada |
Target field(s) |
|
[tablefield: any] |
Campo para analisar |
Valores únicos Opcional |
|
[tabela] Padrão: |
Especificar a camada da tabela de resumo com valores exclusivos. Um de:
A codificação do arquivo também pode ser alterada aqui. |
Relatório HTML Opcional |
|
[html] Padrão: |
HTML report of unique values in the . One of:
|
Saídas
Etiqueta |
Nome |
Tipo |
Descrição |
|---|---|---|---|
Valores únicos |
|
[tabela] |
Summary table layer with unique values |
Relatório HTML |
|
[html] |
HTML report of unique values. Can be opened from the |
Valores únicos totais |
|
[número] |
O número de valores únicos no campo de entrada |
UNIQUE_VALUES |
|
[string] |
A string with the comma separated list of unique values found in the input field |
Código Python
Algorithm ID: qgis:listuniquevalues
import processing
processing.run("algorithm_id", {parameter_dictionary})
The algorithm id is displayed when you hover over the algorithm in the Processing Toolbox. The parameter dictionary provides the parameter NAMEs and values. See Usando os algoritmos do processamento a partir do Terminal Python. for details on how to run processing algorithms from the Python console.
25.1.15.11. Coordenada(s) média(s)
Calcula uma camada de ponto com o centro de massa das geometrias em uma camada de entrada.
Um atributo pode ser especificado como contendo pesos a serem aplicados a cada feição ao calcular o centro de massa.
Se um atributo for selecionado no parâmetro, as feições serão agrupadas de acordo com os valores deste campo. Em vez de um único ponto com o centro de massa de toda a camada, a camada de saída conterá um centro de massa para as feições em cada categoria.
Default menu:
Parâmetros
Etiqueta |
Nome |
Tipo |
Descrição |
|---|---|---|---|
Camada de entrada |
|
[vetor: qualquer] |
Camada vetorial de entrada |
Campo de peso Opcional |
|
[campo de tabela: numérico] |
Campo a ser usado se você deseja realizar uma média ponderada |
Unique ID field |
|
[campo de tabela: numérico] |
Campo único no qual será feito o cálculo da média |
Coordenadas médias |
|
[vetor: ponto] Padrão: |
Especifique a camada (vetor de pontos) para o resultado. Um de:
A codificação do arquivo também pode ser alterada aqui. |
Saídas
Etiqueta |
Nome |
Tipo |
Descrição |
|---|---|---|---|
Coordenadas médias |
|
[vetor: ponto] |
Camada de ponto(s) resultante(s) |
Código Python
Algorithm ID: native:meancoordinates
import processing
processing.run("algorithm_id", {parameter_dictionary})
The algorithm id is displayed when you hover over the algorithm in the Processing Toolbox. The parameter dictionary provides the parameter NAMEs and values. See Usando os algoritmos do processamento a partir do Terminal Python. for details on how to run processing algorithms from the Python console.
25.1.15.12. Análise do vizinho mais próximo
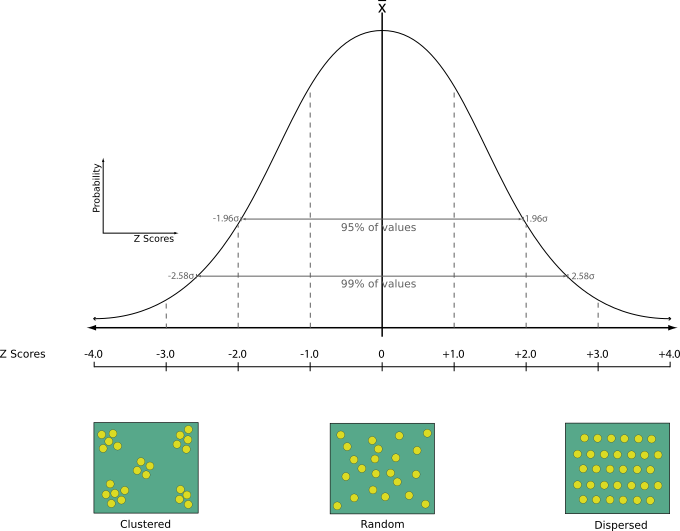
Executa a análise do vizinho mais próximo para uma camada de ponto. A saída informa como seus dados são distribuídos (agrupados, aleatoriamente ou distribuídos).
A saída é gerada como um arquivo HTML com os valores estatísticos calculados:
Distância média observada
Distância média esperada
Índice do vizinho mais próximo
Número de pontos
Z-Score: Comparing the Z-Score with the normal distribution tells you how your data are distributed. A low Z-Score means that the data are unlikely to be the result of a spatially random process, while a high Z-Score means that your data are likely to be a result of a spatially random process.
Default menu:
Ver também
Parâmetros
Etiqueta |
Nome |
Tipo |
Descrição |
|---|---|---|---|
Camada de entrada |
|
[vetor: ponto] |
Camada vetorial de ponto para calcular as estatísticas |
Vizinho mais próximo Opcional |
|
[html] Padrão: |
Especificação do arquivo HTML para as estatísticas computadas. Um de:
|
Saídas
Etiqueta |
Nome |
Tipo |
Descrição |
|---|---|---|---|
Vizinho mais próximo |
|
[html] |
Arquivo HTML com as estatísticas computadas |
Distância média observada |
|
[número] |
Distância média observada |
Distância média esperada |
|
[número] |
Distância média esperada |
Índice do vizinho mais próximo |
|
[número] |
Índice do vizinho mais próximo |
Número de pontos |
|
[número] |
Número de pontos |
Z-Score |
|
[número] |
Z-Score |
Código Python
Algorithm ID: native:nearestneighbouranalysis
import processing
processing.run("algorithm_id", {parameter_dictionary})
The algorithm id is displayed when you hover over the algorithm in the Processing Toolbox. The parameter dictionary provides the parameter NAMEs and values. See Usando os algoritmos do processamento a partir do Terminal Python. for details on how to run processing algorithms from the Python console.
25.1.15.13. Análise de sobreposição
Calcula a área e a cobertura percentual pela qual as feições de uma camada de entrada são sobrepostas por feições de uma seleção de camadas de sobreposição.
Novos atributos são adicionados à camada de saída relatando a área total de sobreposição e a porcentagem da feição de entrada sobreposta por cada uma das camadas de sobreposição selecionadas.
Parâmetros
Etiqueta |
Nome |
Tipo |
Descrição |
|---|---|---|---|
Camada de entrada |
|
[vetor: qualquer] |
A camada de entrada. |
Sobreposição de camadas |
|
[vetor: qualquer] [lista] |
As camadas de sobreposição. |
Camada de saída |
|
[same as input] Padrão: |
Especifique a camada vetorial de saída. Uma de:
A codificação do arquivo também pode ser alterada aqui. |
Saídas
Etiqueta |
Nome |
Tipo |
Descrição |
|---|---|---|---|
Camada de saída |
|
[same as input] |
The output layer with additional fields reporting the overlap (in map units and percentage) of the input feature overlapped by each of the selected layers. |
Código Python
Algorithm ID: native:calculatevectoroverlaps
import processing
processing.run("algorithm_id", {parameter_dictionary})
The algorithm id is displayed when you hover over the algorithm in the Processing Toolbox. The parameter dictionary provides the parameter NAMEs and values. See Usando os algoritmos do processamento a partir do Terminal Python. for details on how to run processing algorithms from the Python console.
25.1.15.14. ST-DBSCAN clustering
NEW in 3.22
Clusters point features based on a 2D implementation of spatiotemporal Density-based clustering of applications with noise (ST-DBSCAN) algorithm.
Ver também
Parâmetros
Parâmetros básicos
Etiqueta |
Nome |
Tipo |
Descrição |
|---|---|---|---|
Camada de entrada |
|
[vetor: ponto] |
Camada a ser analisada |
Date/time field |
|
[tablefield: date] |
Campo contendo as informações temporais |
Tamanho mínimo do conjunto |
|
[número] Padrão: 5 |
Número mínimo de feições para gerar um conjunto |
Maximum distance between clustered points |
|
[número] Padrão: 1.0 |
Distance beyond which two features can not belong to the same cluster (eps) |
Duração máxima de tempo entre pontos agrupados |
|
[número] Padrão: 0.0 (dias) |
Time duration beyond which two features can not belong to the same cluster (eps2). Available time units are milliseconds, seconds, minutes, hours, days and weeks. |
Conjuntos |
|
[vetor: ponto] Padrão: |
Specify the vector layer for the result of the clustering. One of:
A codificação do arquivo também pode ser alterada aqui. |
Parâmetros avançados
Etiqueta |
Nome |
Tipo |
Descrição |
|---|---|---|---|
Treat border points as noise (DBSCAN*) Opcional |
|
[boleano] Padrão: Falso |
If checked, points on the border of a cluster are themselves treated as unclustered points, and only points in the interior of a cluster are tagged as clustered. |
Cluster field name |
“NOME_CAMPO” |
[string] Default: ‘CLUSTER_ID’ |
Name of the field where the associated cluster number shall be stored |
Cluster size field name |
|
[string] Default: ‘CLUSTER_SIZE’ |
Nome do campo com a contagem de feições no mesmo grupo |
Saídas
Etiqueta |
Nome |
Tipo |
Descrição |
|---|---|---|---|
Conjuntos |
|
[vetor: ponto] |
Vector layer containing the original features with a field setting the cluster they belong to |
Número de agrupamentos |
|
[número] |
O número de agrupamentos descobertos |
Código Python
Algorithm ID: native:stdbscanclustering
import processing
processing.run("algorithm_id", {parameter_dictionary})
The algorithm id is displayed when you hover over the algorithm in the Processing Toolbox. The parameter dictionary provides the parameter NAMEs and values. See Usando os algoritmos do processamento a partir do Terminal Python. for details on how to run processing algorithms from the Python console.
25.1.15.15. Estatísticas por categorias
Calculates statistics of a field depending on a parent class. The parent class is a combination of values from other fields.
Parâmetros
Etiqueta |
Nome |
Tipo |
Descrição |
|---|---|---|---|
Camada vetorial de entrada |
|
[vetor: qualquer] |
Camada vetorial de entrada com classes e valores únicos |
Field to calculate statistics on (if empty, only count is calculated) Opcional |
|
[tablefield: any] |
Se estiver vazio apenas a contagem será calculada |
Campo(s) com categorias |
|
[vetor: qualquer] [lista] |
Os campos que (combinados) definem as categorias |
Estatísticas por categoria |
|
[tabela] Padrão: |
Especifique a tabela de saída para as estatísticas geradas. Um de:
A codificação do arquivo também pode ser alterada aqui. |
Saídas
Etiqueta |
Nome |
Tipo |
Descrição |
|---|---|---|---|
Estatísticas por categoria |
|
[tabela] |
Tabela contendo as estatísticas |
Depending on the type of the field being analyzed, the following statistics are returned for each grouped value:
Estatísticas |
String |
Numérico |
Data |
|---|---|---|---|
Contagem ( |
|
|
|
Valores únicos ( |
|
|
|
Empty (null) values ( |
|
|
|
Non-empty values ( |
|
|
|
Valor mínimo ( |
|
|
|
Valor máximo ( |
|
|
|
Range ( |
|
||
Soma ( |
|
||
Valor médio ( |
|
||
Valor da mediana ( |
|
||
Standard Deviation ( |
|
||
Coeficiente de variação ( |
|
||
Minority (rarest occurring value - |
|
||
Majority (most frequently occurring value - |
|
||
Primeiro quartil ( |
|
||
Terceiro quartil ( |
|
||
Inter Quartile Range ( |
|
||
Comprimento mínimo ( |
|
||
Comprimento médio (``COMPRIMENTO_MÉDIO`) |
|
||
Comprimento máximo ( |
|

Código Python
Algorithm ID: qgis:statisticsbycategories
import processing
processing.run("algorithm_id", {parameter_dictionary})
The algorithm id is displayed when you hover over the algorithm in the Processing Toolbox. The parameter dictionary provides the parameter NAMEs and values. See Usando os algoritmos do processamento a partir do Terminal Python. for details on how to run processing algorithms from the Python console.
25.1.15.16. Soma dos comprimentos das linhas
Takes a polygon layer and a line layer and measures the total length of lines and the total number of them that cross each polygon.
The resulting layer has the same features as the input polygon layer, but with two additional attributes containing the length and count of the lines across each polygon.
Default menu:
Parâmetros
Etiqueta |
Nome |
Tipo |
Descrição |
|---|---|---|---|
Linhas |
|
[vetor: linha] |
Input vector line layer |
Polígonos |
|
[vetor: polígono] |
Camada de vetor de polígono |
Nome do campo de comprimento das linhas |
|
[string] Padrão: ‘COMPRIMENTO’ |
Name of the field for the lines length |
Lines count field name |
|
[string] Default: ‘COUNT’ |
Name of the field for the lines count |
Comprimento da linha |
|
[vetor: polígono] Padrão: |
Especifique a camada de polígono de saída com as estatísticas geradas. Um de:
A codificação do arquivo também pode ser alterada aqui. |
Saídas
Etiqueta |
Nome |
Tipo |
Descrição |
|---|---|---|---|
Comprimento da linha |
|
[vetor: polígono] |
Polygon output layer with fields of lines length and line count |
Código Python
Algorithm ID: native:sumlinelengths
import processing
processing.run("algorithm_id", {parameter_dictionary})
The algorithm id is displayed when you hover over the algorithm in the Processing Toolbox. The parameter dictionary provides the parameter NAMEs and values. See Usando os algoritmos do processamento a partir do Terminal Python. for details on how to run processing algorithms from the Python console.