25.1.15. Vektoranalyse
25.1.15.1. Grundstatistik für Felder
Erzeugt Grunstatistiken für ein Feld in der Attributtabelle eines Vektorlayers.
Numerische, Datums-, Zeit- und Zeichenkettenfelder sind unterstützt
The statistics returned will depend on the field type.
Statistics are generated as an HTML file and are available in the .
Default menu:
Parameter
Label |
Name |
Type |
Beschreibung |
|---|---|---|---|
Input vector |
|
[vector: any] |
Vector layer to calculate the statistics on |
Field to calculate statistics on |
|
[tablefield: any] |
Any supported table field to calculate the statistics |
Statistics Optional |
|
[html] Default: |
Specification of the file for the calculated statistics. One of:
|
Ausgaben
Label |
Name |
Type |
Beschreibung |
|---|---|---|---|
Statistics |
|
[html] |
HTML file with the calculated statistics |
Count |
|
[number] |
|
Number of unique values |
|
[number] |
|
Number of empty (null) values |
|
[number] |
|
Number of non-empty values |
|
[number] |
|
Minimum value |
|
[same as input] |
|
Maximum value |
|
[same as input] |
|
Minimum length |
|
[number] |
|
Maximum length |
|
[number] |
|
Mean length |
|
[number] |
|
Coefficient of Variation |
|
[number] |
|
Sum |
|
[number] |
|
Mean value |
|
[number] |
|
Standard deviation |
|
[number] |
|
Range |
|
[number] |
|
Median |
|
[number] |
|
Minority (rarest occurring value) |
|
[same as input] |
|
Majority (most frequently occurring value) |
|
[same as input] |
|
First quartile |
|
[number] |
|
Third quartile |
|
[number] |
|
Interquartile Range (IQR) |
|
[number] |
Python code
Algorithm ID: qgis:basicstatisticsforfields
import processing
processing.run("algorithm_id", {parameter_dictionary})
The algorithm id is displayed when you hover over the algorithm in the Processing Toolbox. The parameter dictionary provides the parameter NAMEs and values. See Verarbeitung Algorithmen von der Konsole aus verwenden for details on how to run processing algorithms from the Python console.
25.1.15.2. Climb along line
Calculates the total climb and descent along line geometries. The input layer must have Z values present. If Z values are not available, the Drape (set Z value from raster) algorithm may be used to add Z values from a DEM layer.
The output layer is a copy of the input layer with additional fields
that contain the total climb (climb), total descent (descent),
the minimum elevation (minelev) and the maximum elevation
(maxelev) for each line geometry.
If the input layer contains fields with the same names as these added
fields, they will be renamed (field names will be altered to „name_2“,
„name_3“, etc, finding the first non-duplicate name).
Parameter
Label |
Name |
Type |
Beschreibung |
|---|---|---|---|
Line layer |
|
[vector: line] |
Line layer to calculate the climb for. Must have Z values |
Climb layer |
|
[vector: line] Default: |
Specification of the output (line) layer. One of:
The file encoding can also be changed here. |
Ausgaben
Label |
Name |
Type |
Beschreibung |
|---|---|---|---|
Climb layer |
|
[vector: line] |
Line layer containing new attributes with the results from climb calculations. |
Total climb |
|
[number] |
The sum of the climb for all the line geometries in the input layer |
Total descent |
|
[number] |
The sum of the descent for all the line geometries in the input layer |
Minimum elevation |
|
[number] |
The minimum elevation for the geometries in the layer |
Maximum elevation |
|
[number] |
The maximum elevation for the geometries in the layer |
Python code
Algorithm ID: qgis:climbalongline
import processing
processing.run("algorithm_id", {parameter_dictionary})
The algorithm id is displayed when you hover over the algorithm in the Processing Toolbox. The parameter dictionary provides the parameter NAMEs and values. See Verarbeitung Algorithmen von der Konsole aus verwenden for details on how to run processing algorithms from the Python console.
25.1.15.3. Count points in polygon
Takes a point and a polygon layer and counts the number of points from the point layer in each of the polygons of the polygon layer.
A new polygon layer is generated, with the exact same content as the input polygon layer, but containing an additional field with the points count corresponding to each polygon.
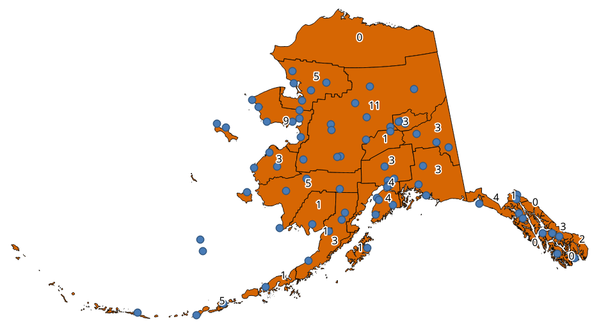
Abb. 25.31 The labels in the polygons show the point count
An optional weight field can be used to assign weights to each point. Alternatively, a unique class field can be specified. If both options are used, the weight field will take precedence and the unique class field will be ignored.
Default menu:
Parameter
Label |
Name |
Type |
Beschreibung |
|---|---|---|---|
Polygons |
|
[vector: polygon] |
Polygon layer whose features are associated with the count of points they contain |
Points |
|
[vector: point] |
Point layer with features to count |
Weight field Optional |
|
[tablefield: any] |
A field from the point layer.
The count generated will be the sum of the weight field of the
points contained by the polygon.
If the weight field is not numeric, the count will be |
Class field Optional |
|
[tablefield: any] |
Points are classified based on the selected attribute and if several points with the same attribute value are within the polygon, only one of them is counted. The final count of the points in a polygon is, therefore, the count of different classes that are found in it. |
Count field name |
|
[string] Default: ‚NUMPOINTS‘ |
The name of the field to store the count of points |
Count |
|
[vector: polygon] Default: |
Specification of the output layer. One of:
The file encoding can also be changed here. |
Ausgaben
Label |
Name |
Type |
Beschreibung |
|---|---|---|---|
Count |
|
[vector: polygon] |
Resulting layer with the attribute table containing the new column with the points count |
Python code
Algorithm ID: native:countpointsinpolygon
import processing
processing.run("algorithm_id", {parameter_dictionary})
The algorithm id is displayed when you hover over the algorithm in the Processing Toolbox. The parameter dictionary provides the parameter NAMEs and values. See Verarbeitung Algorithmen von der Konsole aus verwenden for details on how to run processing algorithms from the Python console.
25.1.15.4. DBSCAN clustering
Clusters point features based on a 2D implementation of Density-based spatial clustering of applications with noise (DBSCAN) algorithm.
The algorithm requires two parameters, a minimum cluster size, and the maximum distance allowed between clustered points.
Siehe auch
Parameter
Basic parameters
Label |
Name |
Type |
Beschreibung |
|---|---|---|---|
Input layer |
|
[vector: point] |
Layer to analyze |
Minimum cluster size |
|
[number] Default: 5 |
Minimum number of features to generate a cluster |
Maximum distance between clustered points |
|
[number] Default: 1.0 |
Distance beyond which two features can not belong to the same cluster (eps) |
Clusters |
|
[vector: point] Default: |
Specify the vector layer for the result of the clustering. One of:
The file encoding can also be changed here. |
Advanced parameters
Label |
Name |
Type |
Beschreibung |
|---|---|---|---|
Treat border points as noise (DBSCAN*) Optional |
|
[boolean] Default: False |
If checked, points on the border of a cluster are themselves treated as unclustered points, and only points in the interior of a cluster are tagged as clustered. |
Cluster field name |
|
[string] Default: ‚CLUSTER_ID‘ |
Name of the field where the associated cluster number shall be stored |
Cluster size field name |
|
[string] Default: ‚CLUSTER_SIZE‘ |
Name of the field with the count of features in the same cluster |
Ausgaben
Label |
Name |
Type |
Beschreibung |
|---|---|---|---|
Clusters |
|
[vector: point] |
Vector layer containing the original features with a field setting the cluster they belong to |
Number of clusters |
|
[number] |
The number of clusters discovered |
Python code
Algorithm ID: native:dbscanclustering
import processing
processing.run("algorithm_id", {parameter_dictionary})
The algorithm id is displayed when you hover over the algorithm in the Processing Toolbox. The parameter dictionary provides the parameter NAMEs and values. See Verarbeitung Algorithmen von der Konsole aus verwenden for details on how to run processing algorithms from the Python console.
25.1.15.5. Distance matrix
Calculates for point features distances to their nearest features in the same layer or in another layer.
Default menu:
Siehe auch
Parameter
Label |
Name |
Type |
Beschreibung |
|---|---|---|---|
Input point layer |
|
[vector: point] |
Point layer for which the distance matrix is calculated (from points) |
Input unique ID field |
|
[tablefield: any] |
Field to use to uniquely identify features of the input layer. Used in the output attribute table. |
Target point layer |
|
[vector: point] |
Point layer containing the nearest point(s) to search (to points) |
Target unique ID field |
|
[tablefield: any] |
Field to use to uniquely identify features of the target layer. Used in the output attribute table. |
Output matrix type |
|
[enumeration] Default: 0 |
Different types of calculation are available:
|
Use only the nearest (k) target points |
|
[number] Default: 0 |
You can choose to calculate the distance to all the points in the target layer (0) or limit to a number (k) of closest features. |
Distance matrix |
|
[vector: point] Default: |
Specification of the output vector layer. One of:
The file encoding can also be changed here. |
Ausgaben
Label |
Name |
Type |
Beschreibung |
|---|---|---|---|
Distance matrix |
|
[vector: point] |
Point (or MultiPoint for the „Linear (N * k x 3)“ case) vector layer containing the distance calculation for each input feature. Its features and attribute table depend on the selected output matrix type. |
Python code
Algorithm ID: qgis:distancematrix
import processing
processing.run("algorithm_id", {parameter_dictionary})
The algorithm id is displayed when you hover over the algorithm in the Processing Toolbox. The parameter dictionary provides the parameter NAMEs and values. See Verarbeitung Algorithmen von der Konsole aus verwenden for details on how to run processing algorithms from the Python console.
25.1.15.6. Distance to nearest hub (line to hub)
Creates lines that join each feature of an input vector to the nearest feature in a destination layer. Distances are calculated based on the center of each feature.
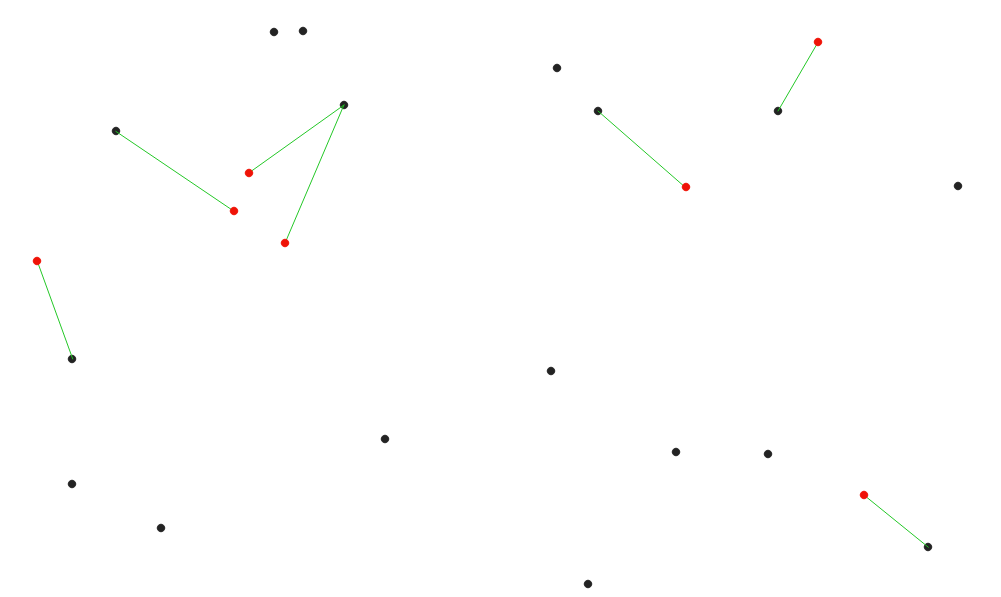
Abb. 25.32 Display the nearest hub for the red input features
Parameter
Label |
Name |
Type |
Beschreibung |
|---|---|---|---|
Source points layer |
|
[vector: any] |
Vector layer for which the nearest feature is searched |
Destination hubs layer |
|
[vector: any] |
Vector layer containing the features to search for |
Hub layer name attribute |
|
[tablefield: any] |
Field to use to uniquely identify features of the destination layer. Used in the output attribute table |
Measurement unit |
|
[enumeration] Default: 0 |
Units in which to report the distance to the closest feature:
|
Hub distance |
|
[vector: line] Default: |
Specify the output line vector layer connecting the matching points. One of:
The file encoding can also be changed here. |
Ausgaben
Label |
Name |
Type |
Beschreibung |
|---|---|---|---|
Hub distance |
|
[vector: line] |
Line vector layer with the attributes of the input features, the identifier of their closest feature and the calculated distance. |
Python code
Algorithm ID: qgis:distancetonearesthublinetohub
import processing
processing.run("algorithm_id", {parameter_dictionary})
The algorithm id is displayed when you hover over the algorithm in the Processing Toolbox. The parameter dictionary provides the parameter NAMEs and values. See Verarbeitung Algorithmen von der Konsole aus verwenden for details on how to run processing algorithms from the Python console.
25.1.15.7. Distance to nearest hub (points)
Creates a point layer representing the center of the input features with the addition of two fields containing the identifier of the nearest feature (based on its center point) and the distance between the points.
Parameter
Label |
Name |
Type |
Beschreibung |
|---|---|---|---|
Source points layer |
|
[vector: any] |
Vector layer for which the nearest feature is searched |
Destination hubs layer |
|
[vector: any] |
Vector layer containing the features to search for |
Hub layer name attribute |
|
[tablefield: any] |
Field to use to uniquely identify features of the destination layer. Used in the output attribute table |
Measurement unit |
|
[enumeration] Default: 0 |
Units in which to report the distance to the closest feature:
|
Hub distance |
|
[vector: point] Default: |
Specify the output point vector layer with the nearest hub. One of:
The file encoding can also be changed here. |
Ausgaben
Label |
Name |
Type |
Beschreibung |
|---|---|---|---|
Hub distance |
|
[vector: point] |
Point vector layer representing the center of the source features with their attributes, the identifier of their closest feature and the calculated distance. |
Python code
Algorithm ID: qgis:distancetonearesthubpoints
import processing
processing.run("algorithm_id", {parameter_dictionary})
The algorithm id is displayed when you hover over the algorithm in the Processing Toolbox. The parameter dictionary provides the parameter NAMEs and values. See Verarbeitung Algorithmen von der Konsole aus verwenden for details on how to run processing algorithms from the Python console.
25.1.15.8. Join by lines (hub lines)
Creates hub and spoke diagrams by connecting lines from points on the Spoke layer to matching points in the Hub layer.
Determination of which hub goes with each point is based on a match between the Hub ID field on the hub points and the Spoke ID field on the spoke points.
If input layers are not point layers, a point on the surface of the geometries will be taken as the connecting location.
Optionally, geodesic lines can be created, which represent the shortest path on the surface of an ellipsoid. When geodesic mode is used, it is possible to split the created lines at the antimeridian (±180 degrees longitude), which can improve rendering of the lines. Additionally, the distance between vertices can be specified. A smaller distance results in a denser, more accurate line.
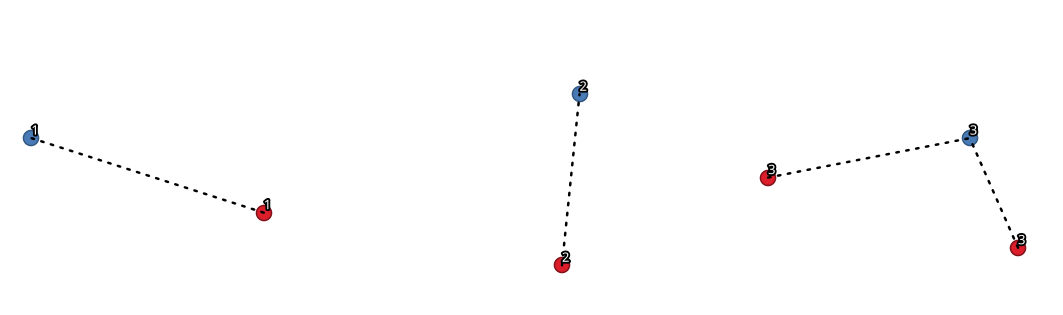
Abb. 25.33 Join points based on a common field / attribute
Parameter
Basic parameters
Label |
Name |
Type |
Beschreibung |
|---|---|---|---|
Hub layer |
|
[vector: any] |
Input layer |
Hub ID field |
|
[tablefield: any] |
Field of the hub layer with ID to join |
Hub layer fields to copy (leave empty to copy all fields) Optional |
|
[tablefield: any] [list] |
The field(s) of the hub layer to be copied. If no field(s) are chosen all fields are taken. |
Spoke layer |
|
[vector: any] |
Additional spoke point layer |
Spoke ID field |
|
[tablefield: any] |
Field of the spoke layer with ID to join |
Spoke layer fields to copy (leave empty to copy all fields) Optional |
|
[tablefield: any] [list] |
Field(s) of the spoke layer to be copied. If no fields are chosen all fields are taken. |
Create geodesic lines |
|
[boolean] Default: False |
Create geodesic lines (the shortest path on the surface of an ellipsoid) |
Hub lines |
|
[vector: line] Default: |
Specify the output hub line vector layer. One of:
The file encoding can also be changed here. |
Advanced parameters
Label |
Name |
Type |
Beschreibung |
|---|---|---|---|
Distance between vertices (geodesic lines only) |
|
[number] Default: 1000.0 (kilometers) |
Distance between consecutive vertices (in kilometers). A smaller distance results in a denser, more accurate line |
Split lines at antimeridian (±180 degrees longitude) |
|
[boolean] Default: False |
Split lines at ±180 degrees longitude (to improve rendering of the lines) |
Ausgaben
Label |
Name |
Type |
Beschreibung |
|---|---|---|---|
Hub lines |
|
[vector: line] |
The resulting line layer connecting matching points in input layers |
Python code
Algorithm ID: native:hublines
import processing
processing.run("algorithm_id", {parameter_dictionary})
The algorithm id is displayed when you hover over the algorithm in the Processing Toolbox. The parameter dictionary provides the parameter NAMEs and values. See Verarbeitung Algorithmen von der Konsole aus verwenden for details on how to run processing algorithms from the Python console.
25.1.15.9. K-means clustering
Calculates the 2D distance based k-means cluster number for each input feature.
K-means clustering aims to partition the features into k clusters in which each feature belongs to the cluster with the nearest mean. The mean point is represented by the barycenter of the clustered features.
If input geometries are lines or polygons, the clustering is based on the centroid of the feature.
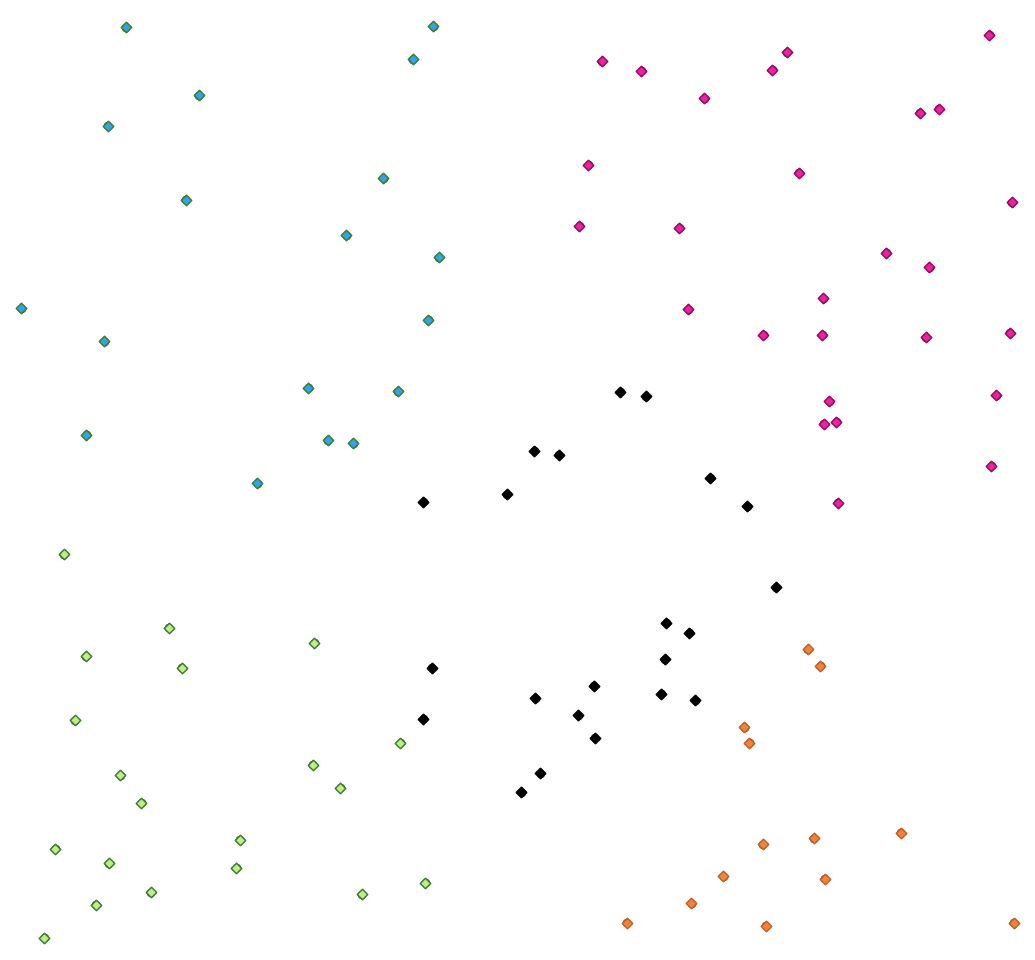
Abb. 25.34 A five class point clusters
Siehe auch
Parameter
Label |
Name |
Type |
Beschreibung |
|---|---|---|---|
Input layer |
|
[vector: any] |
Layer to analyze |
Number of clusters |
|
[number] Default: 5 |
Number of clusters to create with the features |
Clusters |
|
[vector: any] Default: |
Specify the output vector layer for generated the clusters. One of:
The file encoding can also be changed here. |
Advanced parameters
Label |
Name |
Type |
Beschreibung |
|---|---|---|---|
Cluster field name |
|
[string] Default: ‚CLUSTER_ID‘ |
Name of the field where the associated cluster number shall be stored |
Cluster size field name |
|
[string] Default: ‚CLUSTER_SIZE‘ |
Name of the field with the count of features in the same cluster |
Ausgaben
Label |
Name |
Type |
Beschreibung |
|---|---|---|---|
Clusters |
|
[vector: any] |
Vector layer containing the original features with fields specifying the cluster they belong to and their number in it |
Python code
Algorithm ID: native:kmeansclustering
import processing
processing.run("algorithm_id", {parameter_dictionary})
The algorithm id is displayed when you hover over the algorithm in the Processing Toolbox. The parameter dictionary provides the parameter NAMEs and values. See Verarbeitung Algorithmen von der Konsole aus verwenden for details on how to run processing algorithms from the Python console.
25.1.15.10. List unique values
Lists unique values of an attribute table field and counts their number.
Default menu:
Parameter
Label |
Name |
Type |
Beschreibung |
|---|---|---|---|
Input layer |
|
[vector: any] |
Layer to analyze |
Target field(s) |
|
[tablefield: any] |
Field to analyze |
Unique values Optional |
|
[table] Default: |
Specify the summary table layer with unique values. One of:
The file encoding can also be changed here. |
HTML report Optional |
|
[html] Default: |
HTML report of unique values in the . One of:
|
Ausgaben
Label |
Name |
Type |
Beschreibung |
|---|---|---|---|
Unique values |
|
[table] |
Summary table layer with unique values |
HTML report |
|
[html] |
HTML report of unique values. Can be opened from the |
Total unique values |
|
[number] |
The number of uniqe values in the input field |
UNIQUE_VALUES |
|
[string] |
A string with the comma separated list of unique values found in the input field |
Python code
Algorithm ID: qgis:listuniquevalues
import processing
processing.run("algorithm_id", {parameter_dictionary})
The algorithm id is displayed when you hover over the algorithm in the Processing Toolbox. The parameter dictionary provides the parameter NAMEs and values. See Verarbeitung Algorithmen von der Konsole aus verwenden for details on how to run processing algorithms from the Python console.
25.1.15.11. Mean coordinate(s)
Computes a point layer with the center of mass of geometries in an input layer.
An attribute can be specified as containing weights to be applied to each feature when computing the center of mass.
If an attribute is selected in the parameter, features will be grouped according to values in this field. Instead of a single point with the center of mass of the whole layer, the output layer will contain a center of mass for the features in each category.
Default menu:
Parameter
Label |
Name |
Type |
Beschreibung |
|---|---|---|---|
Input layer |
|
[vector: any] |
Input vector layer |
Weight field Optional |
|
[tablefield: numeric] |
Field to use if you want to perform a weighted mean |
Unique ID field |
|
[tablefield: numeric] |
Unique field on which the calculation of the mean will be made |
Mean coordinates |
|
[vector: point] Default: |
Specify the (point vector) layer for the result. One of:
The file encoding can also be changed here. |
Ausgaben
Label |
Name |
Type |
Beschreibung |
|---|---|---|---|
Mean coordinates |
|
[vector: point] |
Resulting point(s) layer |
Python code
Algorithm ID: native:meancoordinates
import processing
processing.run("algorithm_id", {parameter_dictionary})
The algorithm id is displayed when you hover over the algorithm in the Processing Toolbox. The parameter dictionary provides the parameter NAMEs and values. See Verarbeitung Algorithmen von der Konsole aus verwenden for details on how to run processing algorithms from the Python console.
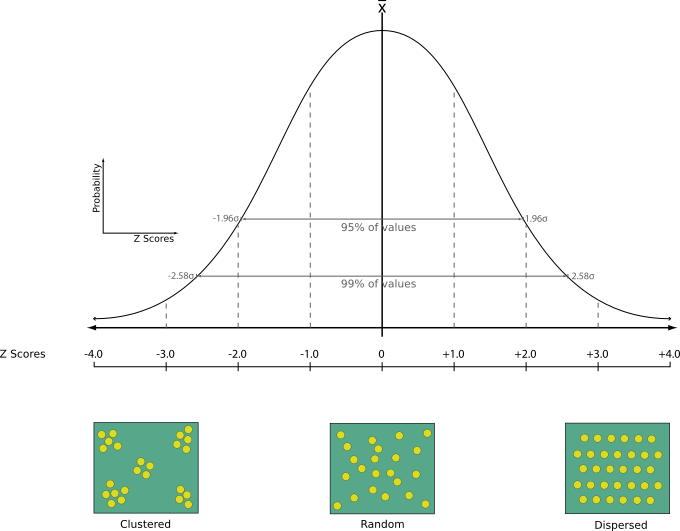
25.1.15.12. Nearest neighbour analysis
Performs nearest neighbor analysis for a point layer. The output tells you how your data are distributed (clustered, randomly or distributed).
Output is generated as an HTML file with the computed statistical values:
Observed mean distance
Expected mean distance
Nearest neighbour index
Number of points
Z-Score: Comparing the Z-Score with the normal distribution tells you how your data are distributed. A low Z-Score means that the data are unlikely to be the result of a spatially random process, while a high Z-Score means that your data are likely to be a result of a spatially random process.
Default menu:
Siehe auch
Parameter
Label |
Name |
Type |
Beschreibung |
|---|---|---|---|
Input layer |
|
[vector: point] |
Point vector layer to calculate the statistics on |
Nearest neighbour Optional |
|
[html] Default: |
Specification of the HTML file for the computed statistics. One of:
|
Ausgaben
Label |
Name |
Type |
Beschreibung |
|---|---|---|---|
Nearest neighbour |
|
[html] |
HTML file with the computed statistics |
Observed mean distance |
|
[number] |
Observed mean distance |
Expected mean distance |
|
[number] |
Expected mean distance |
Nearest neighbour index |
|
[number] |
Nearest neighbour index |
Number of points |
|
[number] |
Number of points |
Z-Score |
|
[number] |
Z-Score |
Python code
Algorithm ID: native:nearestneighbouranalysis
import processing
processing.run("algorithm_id", {parameter_dictionary})
The algorithm id is displayed when you hover over the algorithm in the Processing Toolbox. The parameter dictionary provides the parameter NAMEs and values. See Verarbeitung Algorithmen von der Konsole aus verwenden for details on how to run processing algorithms from the Python console.
25.1.15.13. Overlap analysis
Calculates the area and percentage cover by which features from an input layer are overlapped by features from a selection of overlay layers.
New attributes are added to the output layer reporting the total area of overlap and percentage of the input feature overlapped by each of the selected overlay layers.
Parameter
Label |
Name |
Type |
Beschreibung |
|---|---|---|---|
Input layer |
|
[vector: any] |
The input layer. |
Overlap layers |
|
[vector: any] [list] |
The overlay layers. |
Output layer |
|
[same as input] Default: |
Specify the output vector layer. One of:
The file encoding can also be changed here. |
Ausgaben
Label |
Name |
Type |
Beschreibung |
|---|---|---|---|
Output layer |
|
[same as input] |
The output layer with additional fields reporting the overlap (in map units and percentage) of the input feature overlapped by each of the selected layers. |
Python code
Algorithm ID: native:calculatevectoroverlaps
import processing
processing.run("algorithm_id", {parameter_dictionary})
The algorithm id is displayed when you hover over the algorithm in the Processing Toolbox. The parameter dictionary provides the parameter NAMEs and values. See Verarbeitung Algorithmen von der Konsole aus verwenden for details on how to run processing algorithms from the Python console.
25.1.15.14. ST-DBSCAN clustering
NEW in 3.22
Clusters point features based on a 2D implementation of spatiotemporal Density-based clustering of applications with noise (ST-DBSCAN) algorithm.
Siehe auch
Parameter
Basic parameters
Label |
Name |
Type |
Beschreibung |
|---|---|---|---|
Input layer |
|
[vector: point] |
Layer to analyze |
Date/time field |
|
[tablefield: date] |
Field containing the temporal information |
Minimum cluster size |
|
[number] Default: 5 |
Minimum number of features to generate a cluster |
Maximum distance between clustered points |
|
[number] Default: 1.0 |
Distance beyond which two features can not belong to the same cluster (eps) |
Maximum time duration between clustered points |
|
[number] Default: 0.0 (days) |
Time duration beyond which two features can not belong to the same cluster (eps2). Available time units are milliseconds, seconds, minutes, hours, days and weeks. |
Clusters |
|
[vector: point] Default: |
Specify the vector layer for the result of the clustering. One of:
The file encoding can also be changed here. |
Advanced parameters
Label |
Name |
Type |
Beschreibung |
|---|---|---|---|
Treat border points as noise (DBSCAN*) Optional |
|
[boolean] Default: False |
If checked, points on the border of a cluster are themselves treated as unclustered points, and only points in the interior of a cluster are tagged as clustered. |
Cluster field name |
|
[string] Default: ‚CLUSTER_ID‘ |
Name of the field where the associated cluster number shall be stored |
Cluster size field name |
|
[string] Default: ‚CLUSTER_SIZE‘ |
Name of the field with the count of features in the same cluster |
Ausgaben
Label |
Name |
Type |
Beschreibung |
|---|---|---|---|
Clusters |
|
[vector: point] |
Vector layer containing the original features with a field setting the cluster they belong to |
Number of clusters |
|
[number] |
The number of clusters discovered |
Python code
Algorithm ID: native:stdbscanclustering
import processing
processing.run("algorithm_id", {parameter_dictionary})
The algorithm id is displayed when you hover over the algorithm in the Processing Toolbox. The parameter dictionary provides the parameter NAMEs and values. See Verarbeitung Algorithmen von der Konsole aus verwenden for details on how to run processing algorithms from the Python console.
25.1.15.15. Statistics by categories
Calculates statistics of a field depending on a parent class. The parent class is a combination of values from other fields.
Parameter
Label |
Name |
Type |
Beschreibung |
|---|---|---|---|
Input vector layer |
|
[vector: any] |
Input vector layer with unique classes and values |
Field to calculate statistics on (if empty, only count is calculated) Optional |
|
[tablefield: any] |
If empty only the count will be calculated |
Field(s) with categories |
|
[vector: any] [list] |
The fields that (combined) define the categories |
Statistics by category |
|
[table] Default: |
Specify the output table for the generated statistics. One of:
The file encoding can also be changed here. |
Ausgaben
Label |
Name |
Type |
Beschreibung |
|---|---|---|---|
Statistics by category |
|
[table] |
Table containing the statistics |
Depending on the type of the field being analyzed, the following statistics are returned for each grouped value:
Statistics |
Text |
Numeric |
Datum |
|---|---|---|---|
Count ( |
|
|
|
Unique values ( |
|
|
|
Empty (null) values ( |
|
|
|
Non-empty values ( |
|
|
|
Minimal value ( |
|
|
|
Maximal value ( |
|
|
|
Range ( |
|
||
Sum ( |
|
||
Mean value ( |
|
||
Median value ( |
|
||
Standard Deviation ( |
|
||
Coefficient of variation ( |
|
||
Minority (rarest occurring value - |
|
||
Majority (most frequently occurring value - |
|
||
First Quartile ( |
|
||
Third Quartile ( |
|
||
Inter Quartile Range ( |
|
||
Minimum Length ( |
|
||
Mean Length ( |
|
||
Maximum Length ( |
|

Python code
Algorithm ID: qgis:statisticsbycategories
import processing
processing.run("algorithm_id", {parameter_dictionary})
The algorithm id is displayed when you hover over the algorithm in the Processing Toolbox. The parameter dictionary provides the parameter NAMEs and values. See Verarbeitung Algorithmen von der Konsole aus verwenden for details on how to run processing algorithms from the Python console.
25.1.15.16. Sum line lengths
Takes a polygon layer and a line layer and measures the total length of lines and the total number of them that cross each polygon.
The resulting layer has the same features as the input polygon layer, but with two additional attributes containing the length and count of the lines across each polygon.
Default menu:
Parameter
Label |
Name |
Type |
Beschreibung |
|---|---|---|---|
Lines |
|
[vector: line] |
Input vector line layer |
Polygons |
|
[vector: polygon] |
Polygon vector layer |
Lines length field name |
|
[string] Default: ‚LENGTH‘ |
Name of the field for the lines length |
Lines count field name |
|
[string] Default: ‚COUNT‘ |
Name of the field for the lines count |
Line length |
|
[vector: polygon] Default: |
Specify the output polygon layer with generated statistics. One of:
The file encoding can also be changed here. |
Ausgaben
Label |
Name |
Type |
Beschreibung |
|---|---|---|---|
Line length |
|
[vector: polygon] |
Polygon output layer with fields of lines length and line count |
Python code
Algorithm ID: native:sumlinelengths
import processing
processing.run("algorithm_id", {parameter_dictionary})
The algorithm id is displayed when you hover over the algorithm in the Processing Toolbox. The parameter dictionary provides the parameter NAMEs and values. See Verarbeitung Algorithmen von der Konsole aus verwenden for details on how to run processing algorithms from the Python console.