24.1.20. Raster terrain analysis
24.1.20.1. Aspect
Calculates the aspect of the Digital Terrain Model in input. The final aspect raster layer contains values from 0 to 360 that express the slope direction, starting from north (0°) and continuing clockwise.

Fig. 24.72 Aspect values
The following picture shows the aspect layer reclassified with a color ramp:
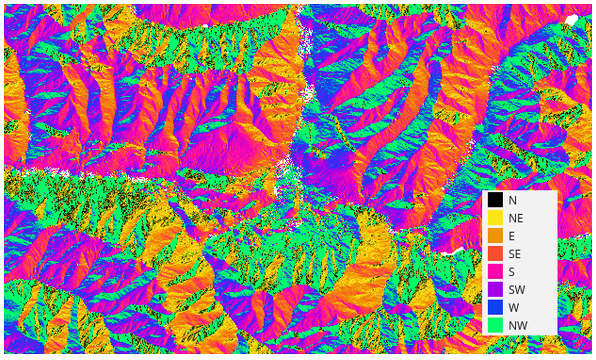
Fig. 24.73 Aspect layer reclassified
Parameters
Basic parameters
Label |
Name |
Type |
Description |
|---|---|---|---|
Elevation layer |
|
[raster] |
Digital Terrain Model raster layer |
Z factor |
|
[numeric: double] Default: 1.0 |
Vertical exaggeration. This parameter is useful when the Z units differ from the X and Y units, for example feet and meters. You can use this parameter to adjust for this. The default is 1 (no exaggeration). |
Aspect |
|
[raster] Default: |
Specify the output aspect raster layer. One of:
|
Advanced parameters
Label |
Name |
Type |
Description |
|---|---|---|---|
Output NoData value
|
|
[numeric: double] Default: -9999.0 |
Value to use for NoData cells in the output layer. |
Creation options Optional
|
|
[string] Default: ‘’ |
For adding one or more creation options that control the raster to be created (colors, block size, file compression…). For convenience, you can rely on predefined profiles (see GDAL driver options section). Batch Process and Model Designer: separate multiple options
with a pipe character ( |
Outputs
Label |
Name |
Type |
Description |
|---|---|---|---|
Aspect |
|
[raster] |
The output aspect raster layer |
Python code
Algorithm ID: native:aspect
import processing
processing.run("algorithm_id", {parameter_dictionary})
The algorithm id is displayed when you hover over the algorithm in the Processing Toolbox. The parameter dictionary provides the parameter NAMEs and values. See Using processing algorithms from the console for details on how to run processing algorithms from the Python console.
24.1.20.2. DTM filter (slope-based)
Added in 3.34
Can be used to filter a digital elevation model in order to classify its cells into ground and object (non-ground) cells.
The tool uses concepts as described by Vosselman (2000)
and is based on the assumption that a large height difference between two nearby cells is unlikely to be caused by a steep slope in the terrain.
The probability that the higher cell might be non-ground increases when the distance between the two cells decreases.
Therefore the filter defines a maximum height difference (dz_max) between two cells as a function of the distance (d) between the cells (dz_max( d ) = d).
A cell is classified as terrain if there is no cell within the kernel radius
to which the height difference is larger than the allowed maximum height difference at the distance between these two cells.
The approximate terrain slope (s) parameter is used to modify the filter function
to match the overall slope in the study area (dz_max( d ) = d * s).
A 5 % confidence interval (ci = 1.65 * sqrt( 2 * stddev )) may be used to modify the filter function even further
by either relaxing (dz_max( d ) = d * s + ci) or amplifying (dz_max( d ) = d * s - ci) the filter criterium.
References: Vosselman, G. (2000): Slope based filtering of laser altimetry data. IAPRS, Vol. XXXIII, Part B3, Amsterdam, The Netherlands, 935-942
See also
This tool is a port of the SAGA DTM Filter (slope-based)
Parameters
Basic parameters
Label |
Name |
Type |
Description |
|---|---|---|---|
Input layer |
|
[raster] |
Digital Terrain Model raster layer |
Band number |
|
[raster band] |
The band of the DEM to consider |
Kernel radius (pixels) |
|
[numeric: integer] Default: 5 |
The radius of the filter kernel (in pixels). Must be large enough to reach ground cells next to non-ground objects. |
Terrain slope (%, pixel size/vertical units) |
|
[numeric: double] Default: 30.0 |
The approximate terrain slope in |
Filter modification |
|
[list] Default: 0 |
Choose whether to apply the filter kernel without modification or to use a confidence interval to relax or amplify the height criterium.
|
Standard deviation |
|
[numeric: double] Default: 0.1 |
The standard deviation used to calculate a 5% confidence interval applied to the height threshold. |
Output layer (ground) Optional |
|
[raster] Default: |
Specify the filtered DEM containing only cells classified as ground. One of:
|
Output layer (non-ground objects) Optional |
|
[raster] Default: |
Specify the non-ground objects removed by the filter. One of:
|
Advanced parameters
Label |
Name |
Type |
Description |
|---|---|---|---|
Creation options Optional
|
|
[string] Default: ‘’ |
For adding one or more creation options that control the raster to be created (colors, block size, file compression…). For convenience, you can rely on predefined profiles (see GDAL driver options section). Batch Process and Model Designer: separate multiple options with a pipe
character ( |
Outputs
Label |
Name |
Type |
Description |
|---|---|---|---|
Output layer (ground) |
|
[raster] |
The filtered DEM containing only cells classified as ground. |
Output layer (non-ground objects) |
|
[raster] |
The non-ground objects removed by the filter. |
Python code
Algorithm ID: native:dtmslopebasedfilter
import processing
processing.run("algorithm_id", {parameter_dictionary})
The algorithm id is displayed when you hover over the algorithm in the Processing Toolbox. The parameter dictionary provides the parameter NAMEs and values. See Using processing algorithms from the console for details on how to run processing algorithms from the Python console.
24.1.20.3. Fill sinks (Wang & Liu)
Added in 3.44
Uses a method proposed by Wang & Liu to identify and fill surface depressions in digital elevation models.
The method was enhanced to allow the creation of hydrologically sound elevation models, i.e. not only to fill the depression(s) but also to preserve a downward slope along the flow path. If desired, this is accomplished by preserving a minimum slope gradient (and thus elevation difference) between cells.
References: Wang, L. & H. Liu (2006): An efficient method for identifying and filling surface depressions in digital elevation models for hydrologic analysis and modelling. International Journal of Geographical Information Science, Vol. 20, No. 2: 193-213.
See also
This tool is a port of the SAGA Fill Sinks (Wang & Liu) tool.
Parameters
Basic parameters
Label |
Name |
Type |
Description |
|---|---|---|---|
Input layer |
|
[raster] |
Digital Terrain Model raster layer |
Band number |
|
[raster band] Default: 1 |
The band of the DEM to consider |
Minimum slope (degrees) |
|
[numeric: double] Default: 0.10 |
Minimum slope gradient to preserve from cell to cell; with a value of zero, sinks are filled up to the spill elevation (which results in flat areas). |
Output layer (filled DEM) Optional |
|
[raster] Default: |
Specify the output raster corresponding to the depression-free DEM. One of:
|
Output layer (flow directions) Optional |
|
[raster] Default: |
Specify the output raster with computed flow directions. One of:
|
Output layer (watershed basins) Optional |
|
[raster] Default: |
Specify the output raster corresponding to the delineated watershed basins. One of:
|
Advanced parameters
Label |
Name |
Type |
Description |
|---|---|---|---|
Creation options Optional |
|
[string] Default: ‘’ |
For adding one or more creation options that control the raster to be created (colors, block size, file compression…). For convenience, you can rely on predefined profiles (see GDAL driver options section). Batch Process and Model Designer: separate multiple options with a pipe
character ( |
Outputs
Label |
Name |
Type |
Description |
|---|---|---|---|
Output layer (filled DEM) |
|
[raster] |
Output raster corresponding to the depression-free digital elevation model. |
Output layer (flow directions) |
|
[raster] |
Output raster with computed flow directions; 0=N, 1=NE, 2=E, … 7=NW. |
Output layer (watershed basins) |
|
[raster] |
Output raster corresponding to the delineated watershed basins. |
Python code
Algorithm ID: native:fillsinkswangliu
import processing
processing.run("algorithm_id", {parameter_dictionary})
The algorithm id is displayed when you hover over the algorithm in the Processing Toolbox. The parameter dictionary provides the parameter NAMEs and values. See Using processing algorithms from the console for details on how to run processing algorithms from the Python console.
24.1.20.4. Hillshade
Calculates the hillshade raster layer given an input Digital Terrain Model.
The shading of the layer is calculated according to the sun position: you have the options to change both the horizontal angle (azimuth) and the vertical angle (sun elevation) of the sun.
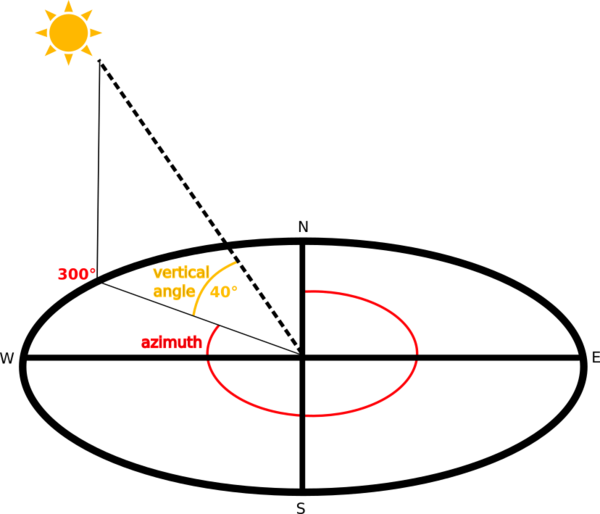
Fig. 24.74 Azimuth and vertical angle
The hillshade layer contains values from 0 (complete shadow) to 255 (complete sun). Hillshade is used usually to better understand the relief of the area.
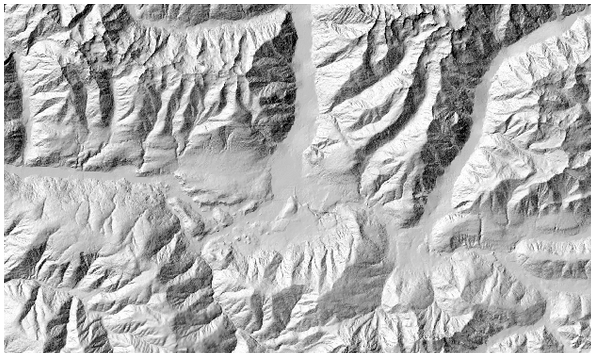
Fig. 24.75 Hillshade layer with azimuth 300 and vertical angle 45
Particularly interesting is to give the hillshade layer a transparency value and overlap it with the elevation raster:
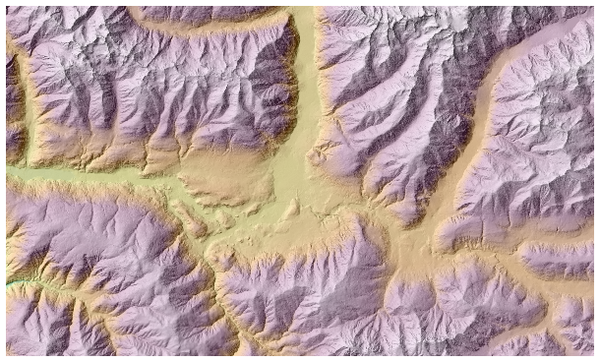
Fig. 24.76 Overlapping the hillshade with the elevation layer
Parameters
Basic parameters
Label |
Name |
Type |
Description |
|---|---|---|---|
Elevation layer |
|
[raster] |
Digital Terrain Model raster layer |
Z factor |
|
[numeric: double] Default: 1.0 |
Vertical exaggeration. This parameter is useful when the Z units differ from the X and Y units, for example feet and meters. You can use this parameter to adjust for this. Increasing the value of this parameter will exaggerate the final result (making it look more “hilly”). The default is 1 (no exaggeration). |
Azimuth (horizontal angle) |
|
[numeric: double] Default: 300.0 |
Set the horizontal angle (in degrees) of the sun (clockwise direction). Range: 0 to 360. 0 is north. |
Vertical angle |
|
[numeric: double] Default: 40.0 |
Set the vertical angle (in degrees) of the sun, that is the height of the sun. Values can go from 0 (minimum elevation) to 90 (maximum elevation). |
Hillshade |
|
[raster] Default: |
Specify the output hillshade raster layer. One of:
|
Advanced parameters
Label |
Name |
Type |
Description |
|---|---|---|---|
Output NoData value
|
|
[numeric: double] Default: -9999.0 |
Value to use for NoData cells in the output layer. |
Creation options Optional
|
|
[string] Default: ‘’ |
For adding one or more creation options that control the raster to be created (colors, block size, file compression…). For convenience, you can rely on predefined profiles (see GDAL driver options section). Batch Process and Model Designer: separate multiple options
with a pipe character ( |
Outputs
Label |
Name |
Type |
Description |
|---|---|---|---|
Hillshade |
|
[raster] |
The output hillshade raster layer |
Python code
Algorithm ID: native:hillshade
import processing
processing.run("algorithm_id", {parameter_dictionary})
The algorithm id is displayed when you hover over the algorithm in the Processing Toolbox. The parameter dictionary provides the parameter NAMEs and values. See Using processing algorithms from the console for details on how to run processing algorithms from the Python console.
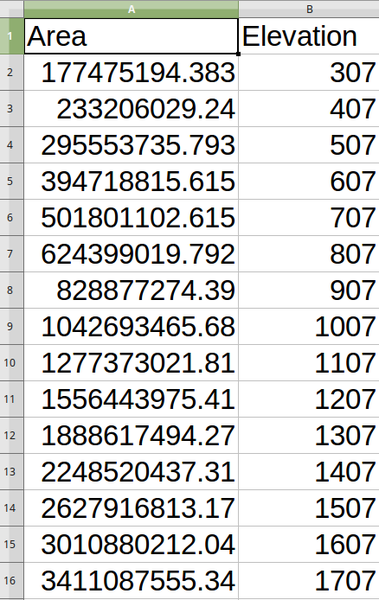
24.1.20.5. Hypsometric curves
Calculates hypsometric curves for an input Digital Elevation Model. Curves are produced as CSV files in an output folder specified by the user.
A hypsometric curve is a cumulative histogram of elevation values in a geographical area.
You can use hypsometric curves to detect differences in the landscape due to the geomorphology of the territory.
Parameters
Label |
Name |
Type |
Description |
|---|---|---|---|
DEM to analyze |
|
[raster] |
Digital Terrain Model raster layer to use for calculating altitudes |
Boundary layer |
|
[vector: polygon] |
Polygon vector layer with boundaries of areas used to calculate hypsometric curves |
Step |
|
[numeric: double] Default: 100.0 |
Vertical distance between curves |
Use % of area instead of absolute value |
|
[boolean] Default: False |
Write area percentage to “Area” field of the CSV file instead of the absolute area |
Hypsometric curves |
|
[folder] |
Specify the output folder for the hypsometric curves. One of:
|
Outputs
Label |
Name |
Type |
Description |
|---|---|---|---|
Hypsometric curves |
|
[folder] |
Directory containing the files with the hypsometric curves. For each feature from the input vector layer, a CSV file with area and altitude values will be created. The file names start with |
Python code
Algorithm ID: qgis:hypsometriccurves
import processing
processing.run("algorithm_id", {parameter_dictionary})
The algorithm id is displayed when you hover over the algorithm in the Processing Toolbox. The parameter dictionary provides the parameter NAMEs and values. See Using processing algorithms from the console for details on how to run processing algorithms from the Python console.
24.1.20.6. Relief
Creates a shaded relief layer from digital elevation data. You can specify the relief color manually, or you can let the algorithm choose automatically all the relief classes.
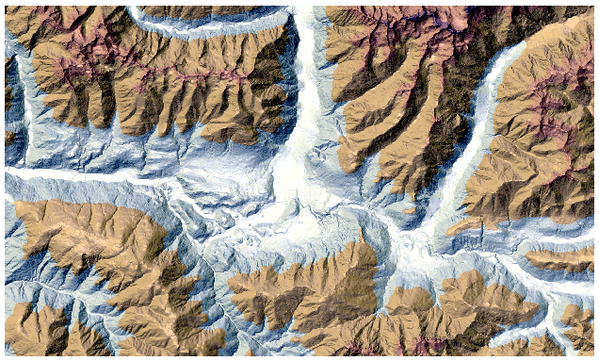
Fig. 24.77 Relief layer
Parameters
Label |
Name |
Type |
Description |
|---|---|---|---|
Elevation layer |
|
[raster] |
Digital Terrain Model raster layer |
Z factor |
|
[numeric: double] Default: 1.0 |
Vertical exaggeration. This parameter is useful when the Z units differ from the X and Y units, for example feet and meters. You can use this parameter to adjust for this. Increasing the value of this parameter will exaggerate the final result (making it look more “hilly”). The default is 1 (no exaggeration). |
Generate relief classes automatically |
|
[boolean] Default: False |
If you check this option the algorithm will create all the relief color classes automatically |
Relief colors Optional |
|
[table widget] |
Use the table widget if you want to choose the relief colors manually. You can add as many color classes as you want: for each class you can choose the lower and upper bound and finally by clicking on the color row you can choose the color thanks to the color widget. 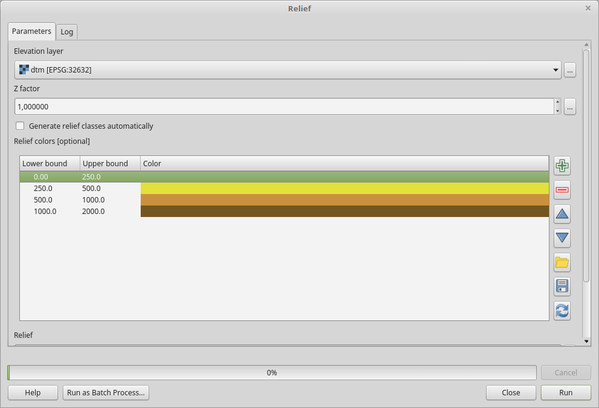
Fig. 24.78 Manually setting of relief color classes The buttons in the right side panel give you the chance to: add or remove color classes, change the order of the color classes already defined, open an existing file with color classes and save the current classes as file. |
Relief |
|
[raster] Default: |
Specify the output relief raster layer. One of:
|
Frequency distribution Optional |
|
[vector: table] Default: |
Specify the CSV table for the output frequency distribution. One of:
|
Outputs
Label |
Name |
Type |
Description |
|---|---|---|---|
Relief |
|
[raster] |
The output relief raster layer |
Frequency distribution |
|
[vector: table] |
The output frequency distribution |
Python code
Algorithm ID: qgis:relief
import processing
processing.run("algorithm_id", {parameter_dictionary})
The algorithm id is displayed when you hover over the algorithm in the Processing Toolbox. The parameter dictionary provides the parameter NAMEs and values. See Using processing algorithms from the console for details on how to run processing algorithms from the Python console.
24.1.20.7. Ruggedness index
Calculates the quantitative measurement of terrain heterogeneity described by Riley et al. (1999). It is calculated for every location, by summarizing the change in elevation within the 3x3 pixel grid.
Each pixel contains the difference in elevation from a center cell and the 8 cells surrounding it.
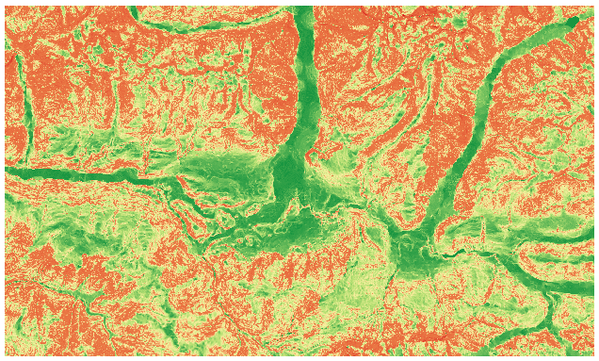
Fig. 24.79 Ruggedness layer from low (red) to high values (green)
Parameters
Basic parameters
Label |
Name |
Type |
Description |
|---|---|---|---|
Elevation layer |
|
[raster] |
Digital Terrain Model raster layer |
Z factor |
|
[numeric: double] Default: 1.0 |
Vertical exaggeration. This parameter is useful when the Z units differ from the X and Y units, for example feet and meters. You can use this parameter to adjust for this. Increasing the value of this parameter will exaggerate the final result (making it look more rugged). The default is 1 (no exaggeration). |
Ruggedness |
|
[raster] Default: |
Specify the output ruggedness raster layer. One of:
|
Advanced parameters
Label |
Name |
Type |
Description |
|---|---|---|---|
Output NoData value
|
|
[numeric: double] Default: -9999.0 |
Value to use for NoData cells in the output layer. |
Creation options Optional
|
|
[string] Default: ‘’ |
For adding one or more creation options that control the raster to be created (colors, block size, file compression…). For convenience, you can rely on predefined profiles (see GDAL driver options section). Batch Process and Model Designer: separate multiple options
with a pipe character ( |
Outputs
Label |
Name |
Type |
Description |
|---|---|---|---|
Ruggedness |
|
[raster] |
The output ruggedness raster layer |
Python code
Algorithm ID: native:ruggednessindex
import processing
processing.run("algorithm_id", {parameter_dictionary})
The algorithm id is displayed when you hover over the algorithm in the Processing Toolbox. The parameter dictionary provides the parameter NAMEs and values. See Using processing algorithms from the console for details on how to run processing algorithms from the Python console.
24.1.20.8. Slope
Calculates the slope from an input raster layer. The slope is the angle of inclination of the terrain and is expressed in degrees.
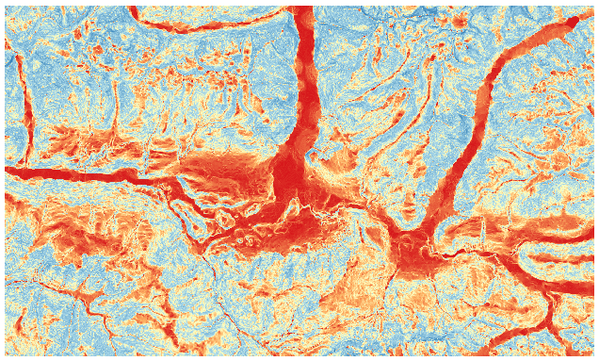
Fig. 24.80 Flat areas in red, steep areas in blue
Parameters
Basic parameters
Label |
Name |
Type |
Description |
|---|---|---|---|
Elevation layer |
|
[raster] |
Digital Terrain Model raster layer |
Z factor |
|
[numeric: double] Default: 1.0 |
Vertical exaggeration. This parameter is useful when the Z units differ from the X and Y units, for example feet and meters. You can use this parameter to adjust for this. Increasing the value of this parameter will exaggerate the final result (making it steeper). The default is 1 (no exaggeration). |
Slope |
|
[raster] Default: |
Specify the output slope raster layer. One of:
|
Advanced parameters
Label |
Name |
Type |
Description |
|---|---|---|---|
Output NoData value
|
|
[numeric: double] Default: -9999.0 |
Value to use for NoData cells in the output layer. |
Creation options Optional
|
|
[string] Default: ‘’ |
For adding one or more creation options that control the raster to be created (colors, block size, file compression…). For convenience, you can rely on predefined profiles (see GDAL driver options section). Batch Process and Model Designer: separate multiple options
with a pipe character ( |
Outputs
Label |
Name |
Type |
Description |
|---|---|---|---|
Slope |
|
[raster] |
The output slope raster layer |
Python code
Algorithm ID: native:slope
import processing
processing.run("algorithm_id", {parameter_dictionary})
The algorithm id is displayed when you hover over the algorithm in the Processing Toolbox. The parameter dictionary provides the parameter NAMEs and values. See Using processing algorithms from the console for details on how to run processing algorithms from the Python console.
24.1.20.9. Total curvature
Added in 4.0
Calculates the total curvature from an input raster layer. The curvature is the second derivative of the surface, revealing terrain features like ridges (positive curvature, convex) and valleys (negative, concave), with zero indicating flat or saddle points.
Fig. 24.81 Total curvature layer, showing concave (negative) surfaces in white, convex (positive) surfaces in blue, and near-flat areas in red
Parameters
Basic parameters
Label |
Name |
Type |
Description |
|---|---|---|---|
Elevation layer |
|
[raster] |
Digital Terrain Model raster layer |
Z factor |
|
[numeric: double] Default: 1.0 |
Vertical exaggeration. This parameter is useful when the Z units differ from the X and Y units, for example feet and meters. You can use this parameter to adjust for this. Increasing the value of this parameter will exaggerate the final result (making it steeper). The default is 1 (no exaggeration). |
Total curvature |
|
[raster] Default: |
Specify the output total curvature raster layer. One of:
|
Advanced parameters
Label |
Name |
Type |
Description |
|---|---|---|---|
Output NoData value |
|
[numeric: double] Default: -9999.0 |
Value to use for NoData cells in the output layer. |
Creation options Optional |
|
[string] Default: ‘’ |
For adding one or more creation options that control the raster to be created (colors, block size, file compression…). For convenience, you can rely on predefined profiles (see GDAL driver options section). Batch Process and Model Designer: separate multiple options
with a pipe character ( |
Outputs
Label |
Name |
Type |
Description |
|---|---|---|---|
Total curvature |
|
[raster] |
The output total curvature raster layer |
Python code
Algorithm ID: native:totalcurvature
import processing
processing.run("algorithm_id", {parameter_dictionary})
The algorithm id is displayed when you hover over the algorithm in the Processing Toolbox. The parameter dictionary provides the parameter NAMEs and values. See Using processing algorithms from the console for details on how to run processing algorithms from the Python console.