8. 座標参照系
|
目的: |
座標参照系を理解する |
キーワード: |
座標参照系(CRS)、地図投影法、「その場で」投影、緯度、経度、北距、東距 |
8.1. 概要
「地図投影」は、地球の表面や地球の一部を平らな紙またはコンピュータ画面に描写しようとします。 簡単に言い換えると、地図投影は地球を球形(3D)から平面形(2D)に変換しようとします。
「座標参照システム」(CRS)は、GISに投影された二次元の地図が、地球上の実際の場所とどのように関係するのかを定義します。使用する地図投影とCRSは、対象範囲、分析範囲およびデータの有効範囲により決定されます。
8.2. 地図投影法の詳細
地球の形を表現する従前の方法は,球体を使う方法です。しかしながら,この方法には問題があります。球体は地球の形状の大半を保持し,大陸の大きさという空間的特徴を表すが,ポケットにしまって持ち歩くのは大変難しい。それは,相当な小縮尺(例えば1:100,000,000)で使うときのみ便利です。
GISアプリケーションで一般に使われる大部分の主題地図データは,かなり大きい縮尺です。典型的なGISデータセットは,1:250000かそれより大きいです。このサイズの球体は,製作するのが高価で難しく,持ち歩くのも困難です。このため,地図制作者は,球状の地球を二次元でかなり正確に表す 地図投影法 と呼ばれる技術を発展させてきた。
近距離で見ると、地球は比較的平坦に見えます。しかし、宇宙から見ると、地球は比較的球形であることがわかります。地図は、次の地図制作の話題の中で見られるように、現実の表現です。それらは、地物だけでなく、地物の形状と空間配置を表すように設計されています。各地図投影法には 長所 と 短所 があります。地図の最適な投影法は、地図の 縮尺 がどれほどで、それが使用される目的が何であるかによって変わります。たとえば、ある投影法は、アフリカ大陸全体の地図作成に使用すると許容範囲外の歪みが生じるが、自国内での 大縮尺(詳細)地図 には優れた選択肢となります。地図投影法の性質は、地図のデザイン面に何かしら影響する場合もあります。投影法は、小領域に適するものあれば、東西に大きく広がる地図領域に適するもの、南北に大きく広がる地図領域に適するものもあります。
8.3. 地図投影法の大きな3つ
The process of creating map projections is best illustrated by positioning a light source inside a transparent globe on which opaque earth features are placed. Then project the feature outlines onto a two-dimensional flat piece of paper. Different ways of projecting can be produced by surrounding the globe in a cylindrical fashion, as a cone, or even as a flat surface. Each of these methods produces what is called a map projection family. Therefore, there is a family of planar projections, a family of cylindrical projections, and another called conical projections (see 図 8.3)
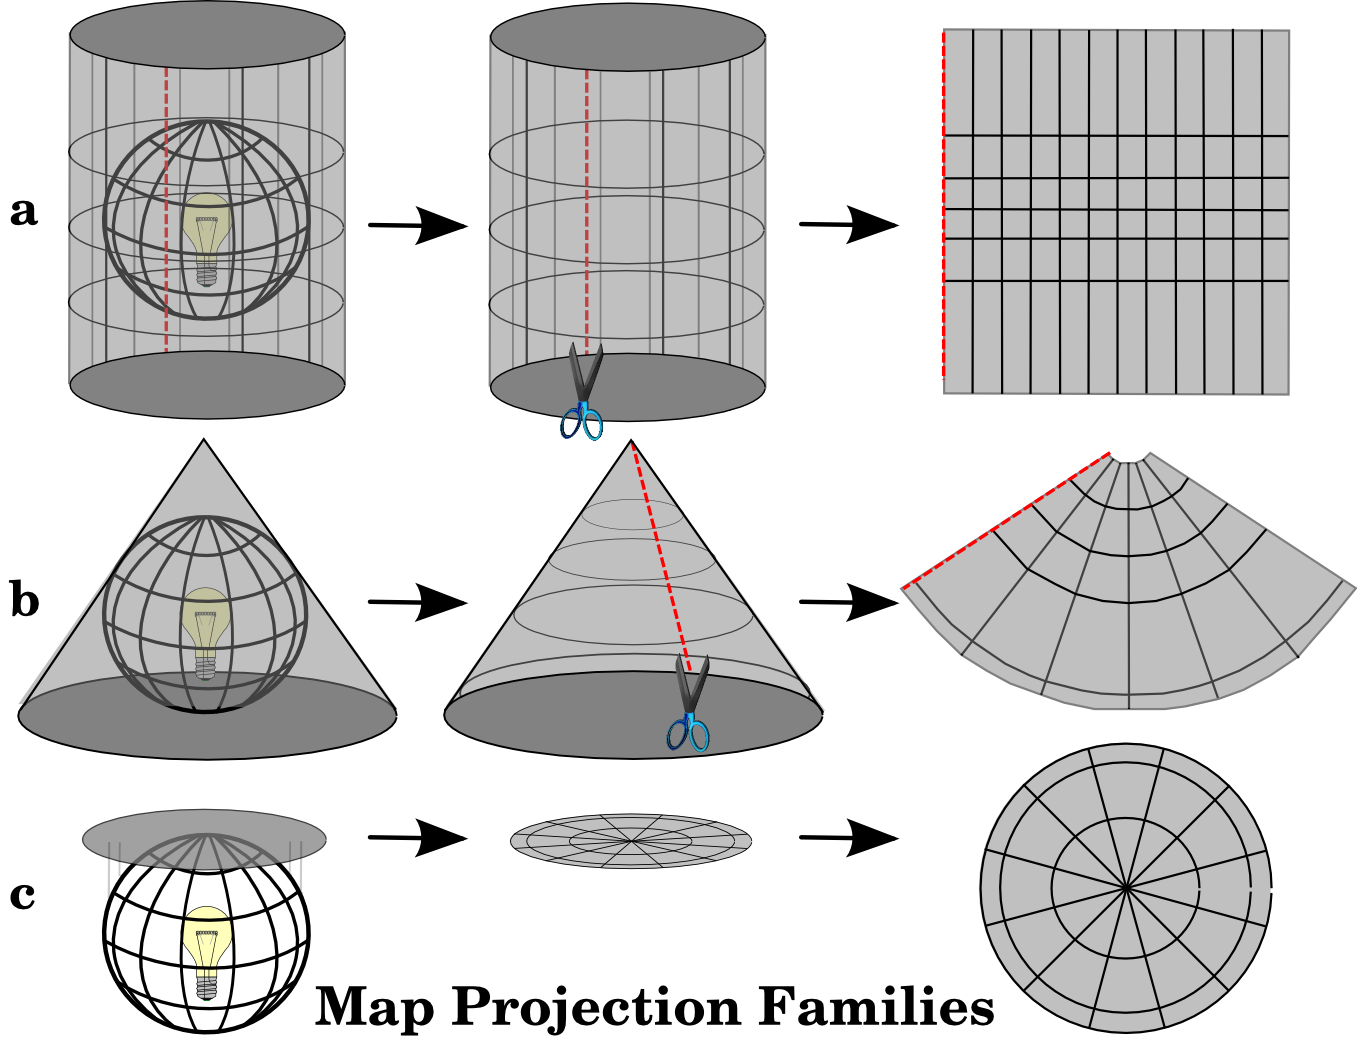
図 8.3 3つの地図投影の族。それらは)円筒投影、b)円錐投影、c)平面投影と表せます。
今日では、もちろん、平らな紙片に球状の地球を投影するプロセスは、幾何学と三角法という数学的原理を用いて行われます。これは、地球を通過する光の物理的な投影を再現します。
8.4. 地図投影の精度
Map projections are never absolutely accurate representations of the spherical earth. As a result of the map projection process, every map shows distortions of angular conformity, distance and area. A map projection may combine several of these characteristics, or may be a compromise that distorts all the properties of area, distance and angular conformity, within some acceptable limit. Examples of compromise projections are the Winkel Tripel projection and the Robinson projection (see 図 8.4), which are often used for producing and visualizing world maps.
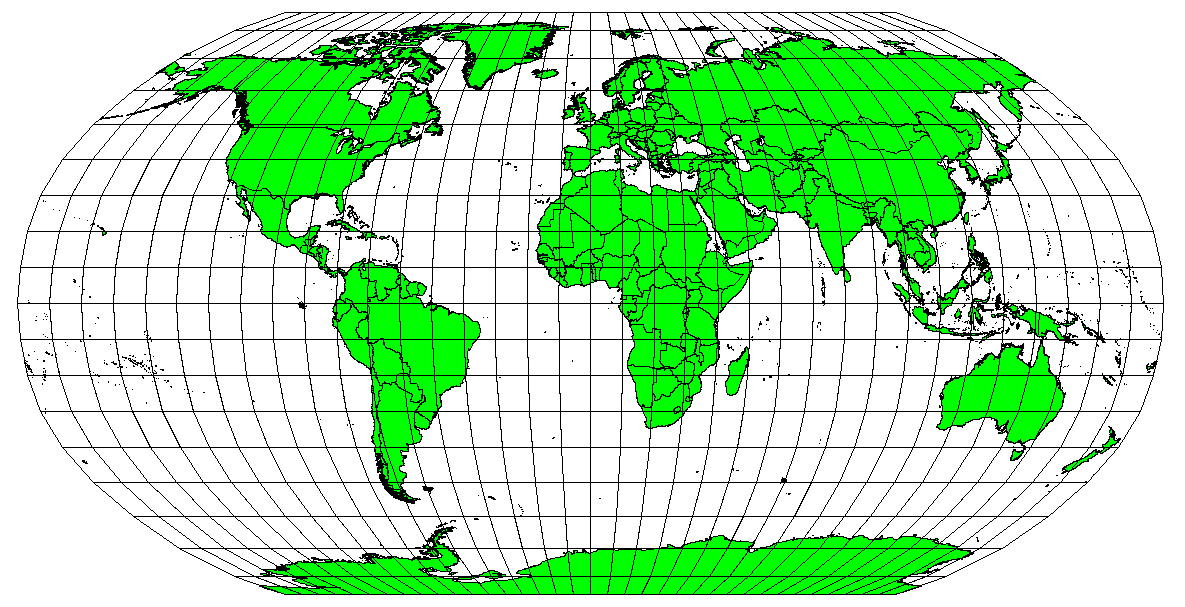
図 8.4 ロビンソン投影は面積、角度整合と距離の歪みが許容される妥協点です。
地図投影で同時にすべての特性を維持するのは通常不可能です。これは、正確な分析操作を実行したい場合、分析のための最良の特性を与える地図投影を使用する必要があることを意味します。たとえば地図上で距離を計測する必要がある場合は、データに対して距離精度が高い地図投影を使用してみてください。
8.4.1. 正角性を持つ地図投影
球で作業する場合、羅針図の主な方向(北、東、南、西)は常に相互に90度で発生します。言い換えれば、東は常に北へ90度の角度で発生します。正しい 角度性質 を維持することは地図投影上でも保存できます。正角性のこの性質を保持する地図投影は 正角 または 等角投影 と呼ばれます。
These projections are used when the preservation of angular relationships is important. They are commonly used for navigational or meteorological tasks. It is important to remember that maintaining true angles on a map is difficult for large areas and should be attempted only for small portions of the earth. The conformal type of projection results in distortions of areas, meaning that if area measurements are made on the map, they will be incorrect. The larger the area the less accurate the area measurements will be. Examples are the Mercator projection (as shown in 図 8.5) and the Lambert Conformal Conic projection. The U.S. Geological Survey uses a conformal projection for many of its topographic maps.
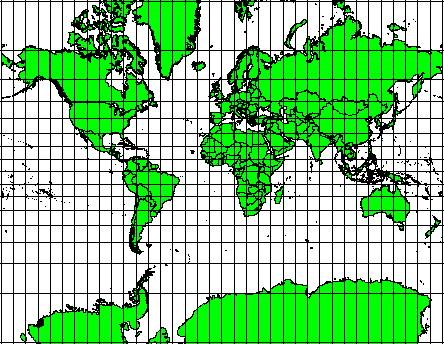
図 8.5 メルカトル図法は、例えば、角度関係が重要である場合に使用されるが、面積の関係が歪んでいます。
8.4.2. 正しい距離を持つ地図投影法
If your goal in projecting a map is to accurately measure distances, you should select a projection that is designed to preserve distances well. Such projections, called equidistant projections, require that the scale of the map is kept constant. A map is equidistant when it correctly represents distances from the centre of the projection to any other place on the map. Equidistant projections maintain accurate distances from the centre of the projection or along given lines. These projections are used for radio and seismic mapping, and for navigation. The Plate Carree Equidistant Cylindrical (see 図 8.6) and the Equirectangular projection are two good examples of equidistant projections. The Azimuthal Equidistant projection is the projection used for the emblem of the United Nations (see 図 8.7).
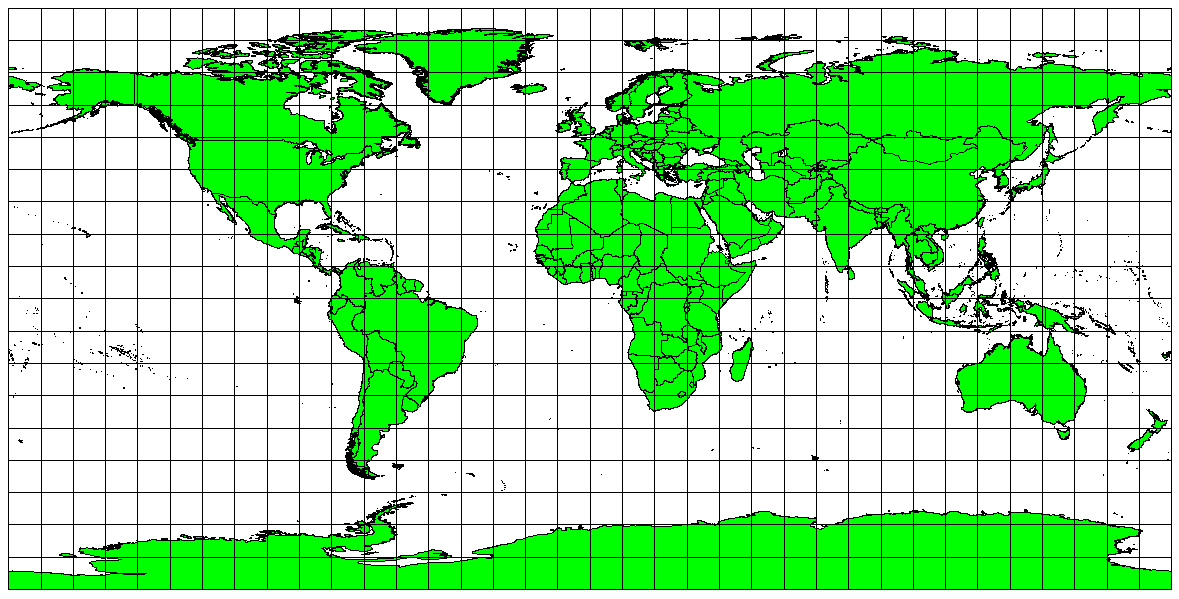
図 8.6 正確な距離測定が重要であるときは、例えばプレートカレ等距円筒投影が使用されます。

図 8.7 国際連合のロゴは正距方位図法が用いられています。
8.4.3. 正しい面積を持つ投影法
When a map portrays areas over the entire map, so that all mapped areas have the same proportional relationship to the areas on the Earth that they represent, the map is an equal area map. In practice, general reference and educational maps most often require the use of equal area projections. As the name implies, these maps are best used when calculations of area are the dominant calculations you will perform. If, for example, you are trying to analyse a particular area in your town to find out whether it is large enough for a new shopping mall, equal area projections are the best choice. On the one hand, the larger the area you are analysing, the more precise your area measures will be, if you use an equal area projection rather than another type. On the other hand, an equal area projection results in distortions of angular conformity when dealing with large areas. Small areas will be far less prone to having their angles distorted when you use an equal area projection. Alber's equal area, Lambert's equal area and Mollweide Equal Area Cylindrical projections (shown in 図 8.8) are types of equal area projections that are often encountered in GIS work.
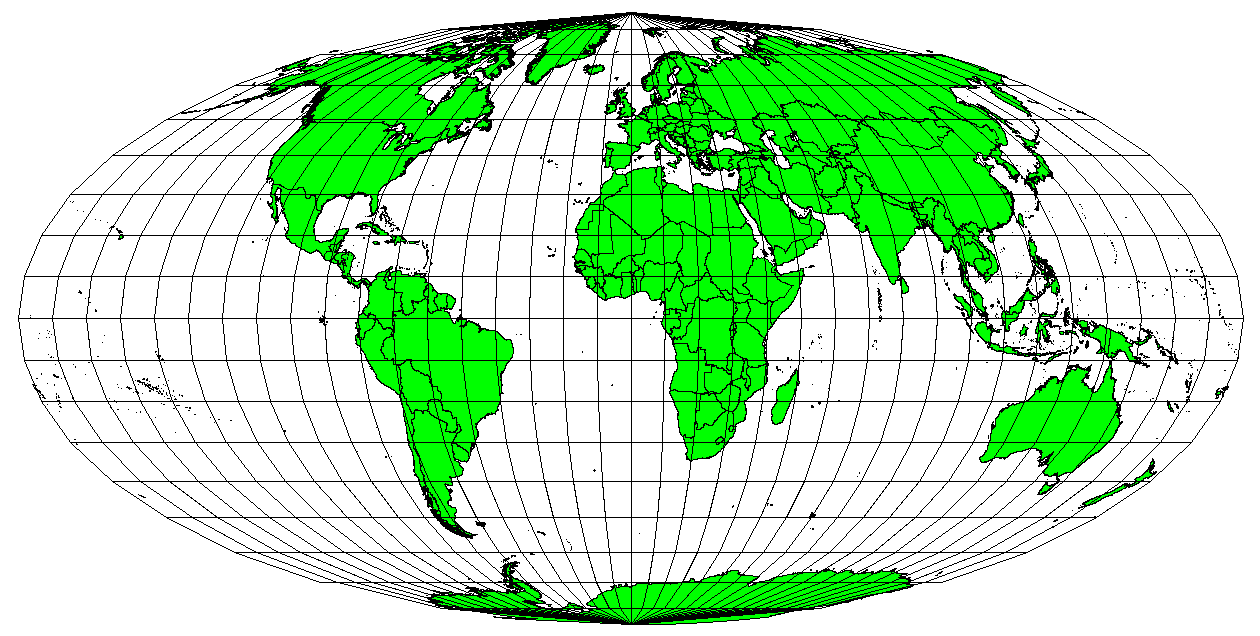
図 8.8 モルワイデ等積円筒投影は、例えば、地図化された領域はすべて、地球上の領域に同一の比例関係を有していることを保証します。
地図投影は非常に複雑なトピックであることに留意してください。世界的な利用可能な異なる投影法は何百もあり、それぞれが紙の平らな部分にできるだけ忠実に地球の表面の特定の部分を描写しようとします。実際にどの投影を使用するかは多くの場合、ご自身のために選択されます。ほとんどの国では一般的に使用される投影があり、人々はデータを交換するとき 全国的傾向 に従います。
8.5. 座標参照系(CRS)の詳細
座標系(CRS)の助けを借りて、地球上のあらゆる場所は、座標と呼ばれる3つの数字のセットで指定できます。一般にCRSは 投影座標系 (デカルト又は直角座標系とも呼ばれる)と 地理座標系 に分類できます。
8.5.1. 地理座標系
地理座標参照系を使用することは非常に一般的です。それらは、地球の表面上の位置を記述するために緯度および経度と、時には高さ値を使用しています。最も一般的なものは WGS 84 と呼ばれています。
Lines of latitude run parallel to the equator and divide the earth into 180 equally spaced sections from North to South (or South to North). The reference line for latitude is the equator and each hemisphere is divided into ninety sections, each representing one degree of latitude. In the northern hemisphere, degrees of latitude are measured from zero at the equator to ninety at the north pole. In the southern hemisphere, degrees of latitude are measured from zero at the equator to ninety degrees at the south pole. To simplify the digitisation of maps, degrees of latitude in the southern hemisphere are often assigned negative values (0 to -90°). Wherever you are on the earth’s surface, the distance between the lines of latitude is the same (60 nautical miles). See 図 8.9 for a pictorial view.
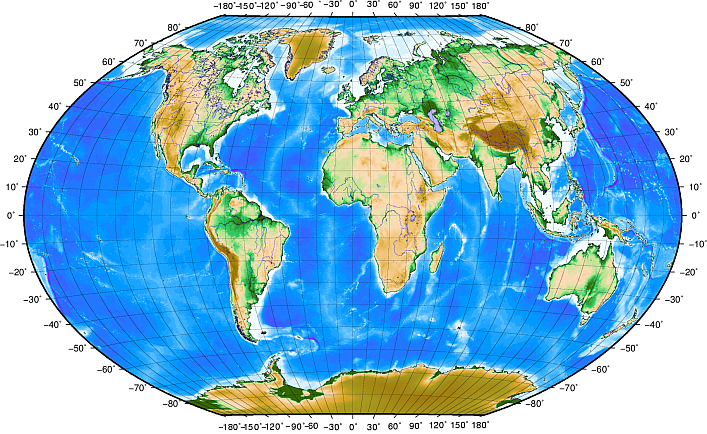
図 8.9 緯線は赤道に平行で、経線は本初子午線がグリニッジを通る地理座標系。
Lines of longitude, on the other hand, do not stand up so well to the standard of uniformity. Lines of longitude run perpendicular to the equator and converge at the poles. The reference line for longitude (the prime meridian) runs from the North pole to the South pole through Greenwich, England. Subsequent lines of longitude are measured from zero to 180 degrees East or West of the prime meridian. Note that values West of the prime meridian are assigned negative values for use in digital mapping applications. See 図 8.9 for a pictorial view.
赤道で、そして赤道のみで、経度の線で表される距離は緯度1度で表される距離に等しくなります。極の方に移動するにつれ経線間の距離は徐々に小さくなっていき、ちょうど極の位置になると経度の全ての360°は単一の点で表現され、上に指を置くことができるでしょう(手袋を着用したくなるでしょうが )。地理座標系を使用すると、赤道では約12363.365平方キロメートルを覆う正方形に地球を分割する線格子を得られます、---手始めには良いですがその正方形内の何かの位置を決定するために非常に有用ではありません。
真に有用であるためには、地図の格子は、(精度の許容レベルで)地図上の点の位置を記述するために使用できるように、十分小さな部分に分割されなければなりません。これを達成するために、度は 分 ( ' )と 秒 ( " )に分割されます。1度は60分、1分は60秒です(1度は3600秒)。したがって、赤道では、緯度または経度の1秒= 30.87624メートルです。
8.5.2. 投影座標参照系
A two-dimensional coordinate reference system is commonly defined by two axes. At right angles to each other, they form a so called XY-plane (see 図 8.10 on the left side). The horizontal axis is normally labelled X, and the vertical axis is normally labelled Y. In a three-dimensional coordinate reference system, another axis, normally labelled Z, is added. It is also at right angles to the X and Y axes. The Z axis provides the third dimension of space (see 図 8.10 on the right side). Every point that is expressed in spherical coordinates can be expressed as an X Y Z coordinate.
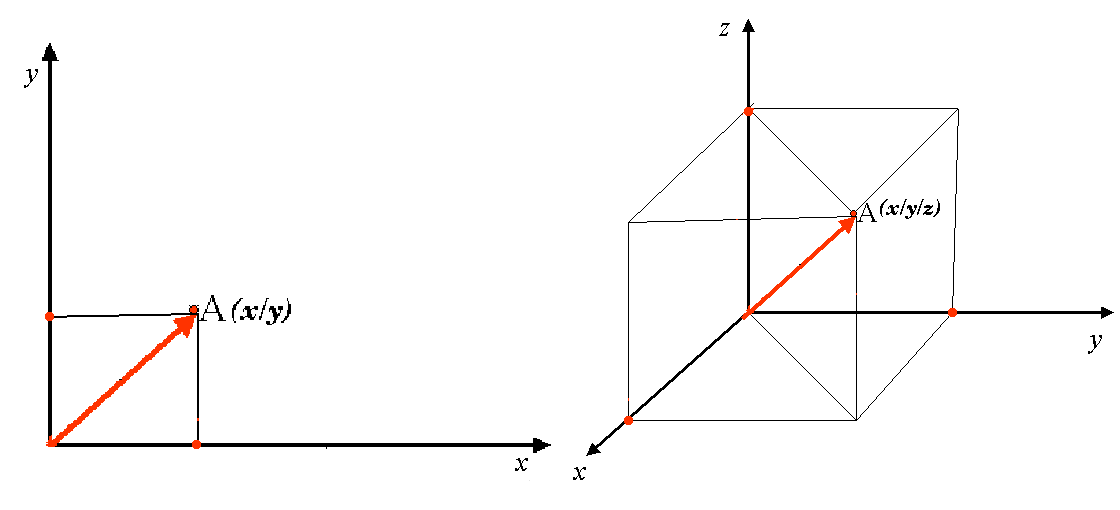
図 8.10 二次元と三次元の基準座標系。
南半球(赤道南)での投影座標参照系は通常、特定の 経度 で赤道にその原点を有しています。これは、Y-値は南に増加し、X-値は西に増加することを意味します。北半球(赤道北)でも、原点は特定の 経度 での赤道です。しかし今度は、Y値は北に増加し、X-値は東に増加します。次のセクションではしばしば南アフリカについて使用されるユニバーサル横メルカトル(UTM)と呼ばれる投影座標参照系を記載しています。
8.6. ユニバーサル横メルカトル(UTM)CRS詳細
The Universal Transverse Mercator (UTM) coordinate reference system has its origin on the equator at a specific Longitude. Now the Y-values increase southwards and the X-values increase to the West. The UTM CRS is a global map projection. This means, it is generally used all over the world. But as already described in the section 'accuracy of map projections' above, the larger the area (for example South Africa) the more distortion of angular conformity, distance and area occur. To avoid too much distortion, the world is divided into 60 equal zones that are all 6 degrees wide in longitude from East to West. The UTM zones are numbered 1 to 60, starting at the antimeridian (zone 1 at 180 degrees West longitude) and progressing East back to the antemeridian (zone 60 at 180 degrees East longitude) as shown in 図 8.11.
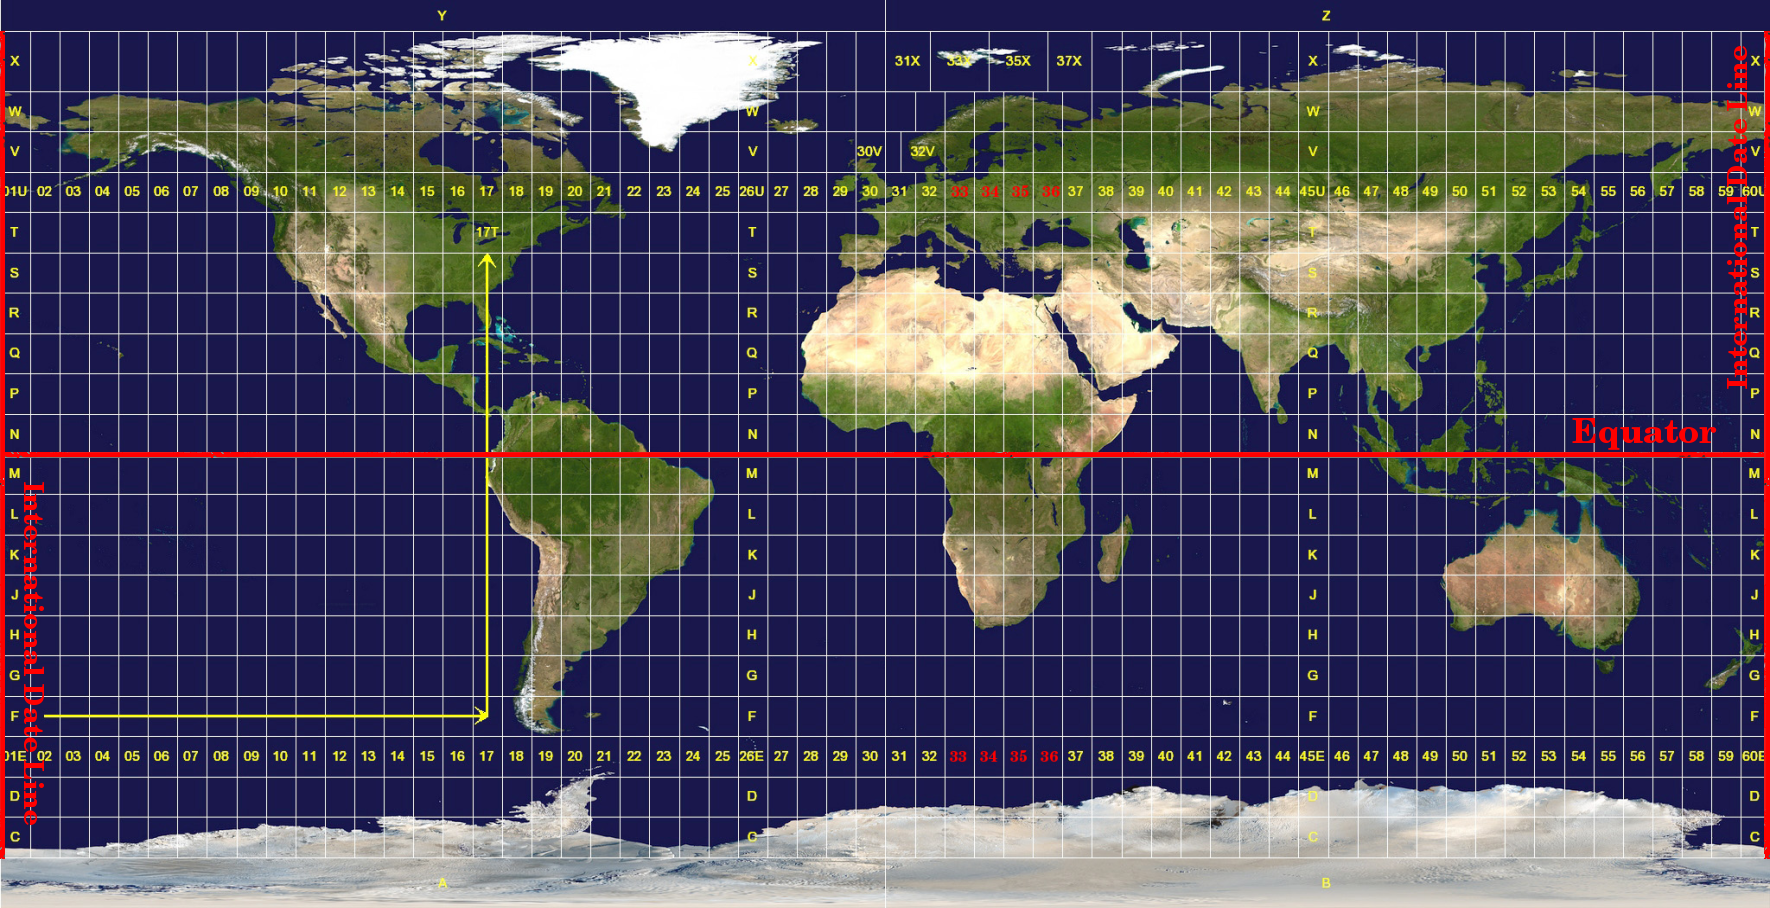
図 8.11 ユニバーサル横メルカトルゾーン。南アフリカにはUTMゾーン33S、34S、35S、36Sが使用されています。
As you can see in 図 8.11 and 図 8.12, South Africa is covered by four UTM zones to minimize distortion. The zones are called UTM 33S, UTM 34S, UTM 35S and UTM 36S. The S after the zone means that the UTM zones are located south of the equator.
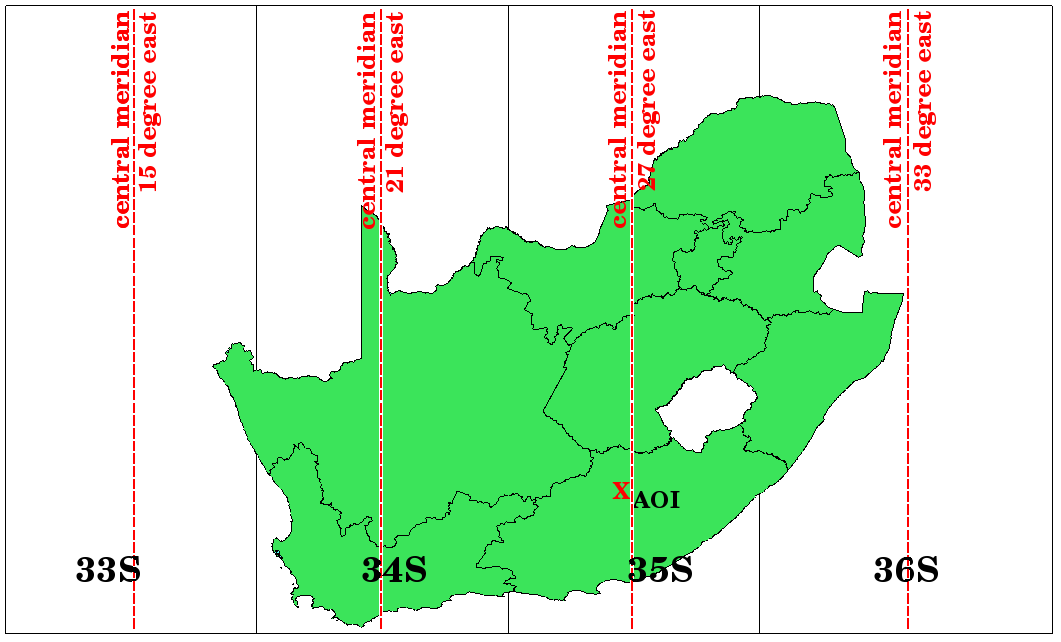
図 8.12 UTMゾーンは、その中央経度(経絡)と33S、34S、35S、36Sとは、高い精度で南アフリカを投影するために使用されます。赤の十字は関心領域(AOI)を示します。
Say, for example, that we want to define a two-dimensional coordinate within the Area of Interest (AOI) marked with a red cross in 図 8.12. You can see, that the area is located within the UTM zone 35S. This means, to minimize distortion and to get accurate analysis results, we should use UTM zone 35S as the coordinate reference system.
The position of a coordinate in UTM south of the equator must be indicated with the zone number (35) and with its northing (Y) value and easting (X) value in meters. The northing value is the distance of the position from the equator in meters. The easting value is the distance from the central meridian (longitude) of the used UTM zone. For UTM zone 35S it is 27 degrees East as shown in 図 8.12. Furthermore, because we are south of the equator and negative values are not allowed in the UTM coordinate reference system, we have to add a so called false northing value of 10,000,000 m to the northing (Y) value and a false easting value of 500,000 m to the easting (X) value. This sounds difficult, so, we will do an example that shows you how to find the correct UTM 35S coordinate for the Area of Interest.
8.6.1. 北距(Y)値
探している場所は赤道から南355万メートルですので、北距(Y)の値には 負の符号 が付き-355万メートルです。UTMの定義に従い、1000万メートルの 偽の北距値 を追加する必要があります。ということは、座標の北距(Y)の値は645万メートル(-355 万メートル +1000万メートル)です。
8.6.2. 東距(X)値
First we have to find the central meridian (longitude) for the UTM zone 35S. As we can see in 図 8.12 it is 27 degrees East. The place we are looking for is 85,000 meters West from the central meridian. Just like the northing value, the easting (X) value gets a negative sign, giving a result of -85,000 m. According to the UTM definitions we have to add a false easting value of 500,000 m. This means the easting (X) value of our coordinate is 415,000 m (-85,000 m + 500,000 m). Finally, we have to add the zone number to the easting value to get the correct value.
結果として、我々の 関心地点 の座標、 UTMゾーン35S に投影されるものは、このように記述されるでしょう: 35 415,000メートル東 /6,450,000メートル北 。GISによっては、正しいUTMゾーン35Sが定義されその座標系内で単位がメートルに設定されているとき、座標は単に 415,000 6,450,000 として現れる可能性があります。
8.7. 「その場で」投影
おそらく想像できるでしょうが、GISで使用するデータが異なる座標参照系に投影されている状況はありえます。たとえば、UTM 35Sで投影された南アフリカの国境を示すベクターレイヤーと、WGS 84地理座標系で与えられた降雨に関する地点情報のベクターレイヤーがあるとします。GISではこれら2つのベクターレイヤーは、投影が異なるので、地図ウィンドウ中で全く異なる領域に配置されます。
この問題を解決するために、多くのGISには オンザフライ 投影と呼ばれる機能が含まれています。つまり、GISを開始するときに特定の投影法を 定義 でき、ロードするすべてのレイヤーは、それらの座標参照系に関係なく、定義した投影法で自動的に表示されます。この機能を使用すると、 異なる 参照系にある場合でもGISの地図ウィンドウ内にレイヤをオーバーレイできます。 QGISではこの機能はデフォルトで適用されます。
8.8. 一般的な問題 / 注意すべき点
地図投影 の話題は非常に複雑であり、地理、測量、あるいはその他のGIS関連科学を研究している専門家ですら地図投影と基準座標系を正しく定義できないことがよくあります。GISで作業するときは通常、開始するデータをすでに投影しています。ほとんどの場合、これらのデータは、特定のCRSに投影されますので、新しいCRSを作成したり、そのデータをある CRSから別のCRSへ再投影する必要はありません。ですが、地図投影とCRSが意味することについて理解があるといつでも役に立ちます。
8.9. 何を学びましたか?
このワークシートに覆われたものを包んでみましょう:
地図投影 は紙またはコンピュータ画面の二次元の平面部分に地球の表面を描きます。
全世界的な地図投影はありますが、ほとんどの地図投影は地球の表面の 小領域を投影するのに最適 なように作成されています。
地図投影では、球形の地球を絶対的に正確な表現することは決してありません。それらは 正角性、距離および面積における歪み を示します。地図投影ですべてのこれらの特性を同時に保つことは不可能です。
座標参照系 (CRS)は、座標の助けを借りて、二次元の投影図が地球の実位置にどう関係づけられるかを定義します。
異なる2つの座標参照系があります。地理座標系 と 投影座標系 です。
その場で 投影は、別の座標参照系で投影されているレイヤーを重ねることを可能にするGISの機能です。
8.10. やってみよう
ここでは人に教える際のアイデアをいくつか述べていきます:
QGISを始める
In check No projection (or unknown/non-Earth projection)
Load two layers of the same area but with different projections
Let your pupils find the coordinates of several places on the two layers. You can show them that it is not possible to overlay the two layers.
Then define the coordinate reference system as Geographic/WGS 84 inside the Project Properties dialog
Load the two layers of the same area again and let your pupils see how setting a CRS for the project (hence, enabling "on-the-fly" projection) works.
QGISで プロジェクトのプロパティ ダイアログを開き、生徒にさまざまな座標参照系を見せれば、このトピックの複雑さを教えることができます。同じレイヤーを異なる投影で表示するために様々なCRSを選択できます。
8.11. 考えてみよう
利用できるコンピュータがない場合は、3つの地図投影の族の原則を生徒たちに見せることができます。球体と紙を取得し、円筒、円錐、平面の投影が一般的にどのように機能するかを示します。透明シートの助けを借りると、X軸とY軸を示す2次元の座標参照系を描くことができます。次に、生徒たちに異なる場所の座標(XとYの値)を定義させましょう。
8.12. より詳しく知りたい場合は
図書:
Chang, Kang-Tsung (2006). Introduction to Geographic Information Systems. 3rd Edition. McGraw Hill. ISBN: 0070658986
DeMers, Michael N. (2005). Fundamentals of Geographic Information Systems. 3rd Edition. Wiley. ISBN: 9814126195
Galati, Stephen R. (2006): Geographic Information Systems Demystified. Artech House Inc. ISBN: 158053533X
ウェブサイト:
https://foote.geography.uconn.edu/gcraft/notes/mapproj/mapproj_f.html
http://geology.isu.edu/wapi/geostac/Field_Exercise/topomaps/index.htm
QGISユーザーガイドでは,地図投影法の操作についてより詳細な情報が含まれています.
8.13. 次は?
続くセクションでは 地図投影法 について詳しく見ていきます。