9. 地図製作
|
目的: |
空間情報の地図の理解 |
キーワード: |
地図製作,地図のレイアウト,スケールバー,方位記号,凡例,地図,単位 |
9.1. 概要
Map production is the process of arranging map elements on a sheet of paper in a way that, even without many words, the average person can understand what it is all about. Maps are usually produced for presentations and reports where the audience or reader is a politician, citizen or a learner with no professional background in GIS. Because of this, a map has to be effective in communicating spatial information. Common elements of a map are the title, map body, legend, north arrow, scale bar, acknowledgement, and map border (see 図 9.32).
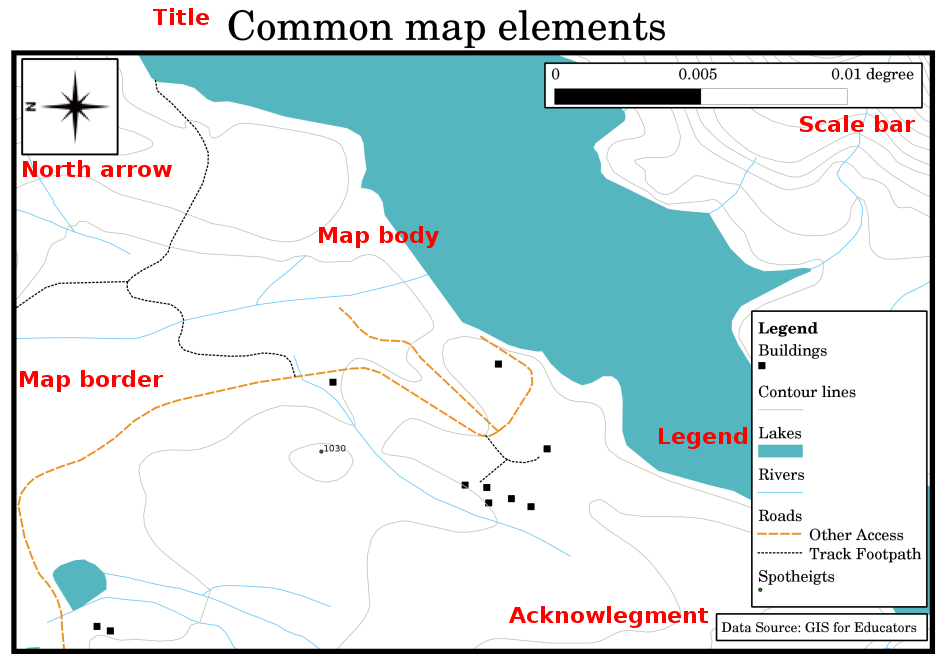
図 9.32 一般的な地図要素(赤でラベル)は、タイトル、地図本体、凡例、方位、スケールバー、承認および地図境界です。
追加されるかもしれない他の要素は、例えば、 目盛 、または 地図投影の名 (CRS)です。一緒に、これらの要素は地図読者が地図上に示された情報を解釈するのに役立ちます。地図本体は、地図情報が含まれているため、当然のことながら、地図の最重要部分です。他の要素は、コミュニケーションのプロセスをサポートし、地図読者が自分自身の方角を定めて地図のトピックを理解するように助けます。例えば、タイトルは主題を説明し、凡例は地図記号を地図化されたデータに関連づけます。
9.2. タイトルの詳細
地図のタイトルは、たいてい読者が地図上で見る最初のものですので、非常に重要です。それは新聞のタイトルに比することができます。短くて、読者に地図が何であるかについての最初のアイデアを与える必要があります。
9.3. 地図境界の詳細
The map border is a line that defines exactly the edges of the area shown on the map. When printing a map with a graticule (which we describe further down), you often find the coordinate information of the graticule lines along the border lines, as you can see in 図 9.33.
9.4. 地図凡例の詳細
A map is a simplified representation of the real world and map symbols are used to represent real objects. Without symbols, we wouldn't understand maps. To ensure that a person can correctly read a map, a map legend is used to provide a key to all the symbols used on the map. It is like a dictionary that allows you to understand the meaning of what the map shows. A map legend is usually shown a a little box in a corner of the map. It contains icons, each of which will represent a type of feature. For example, a house icon will show you how to identify houses on the map (see 図 9.33).
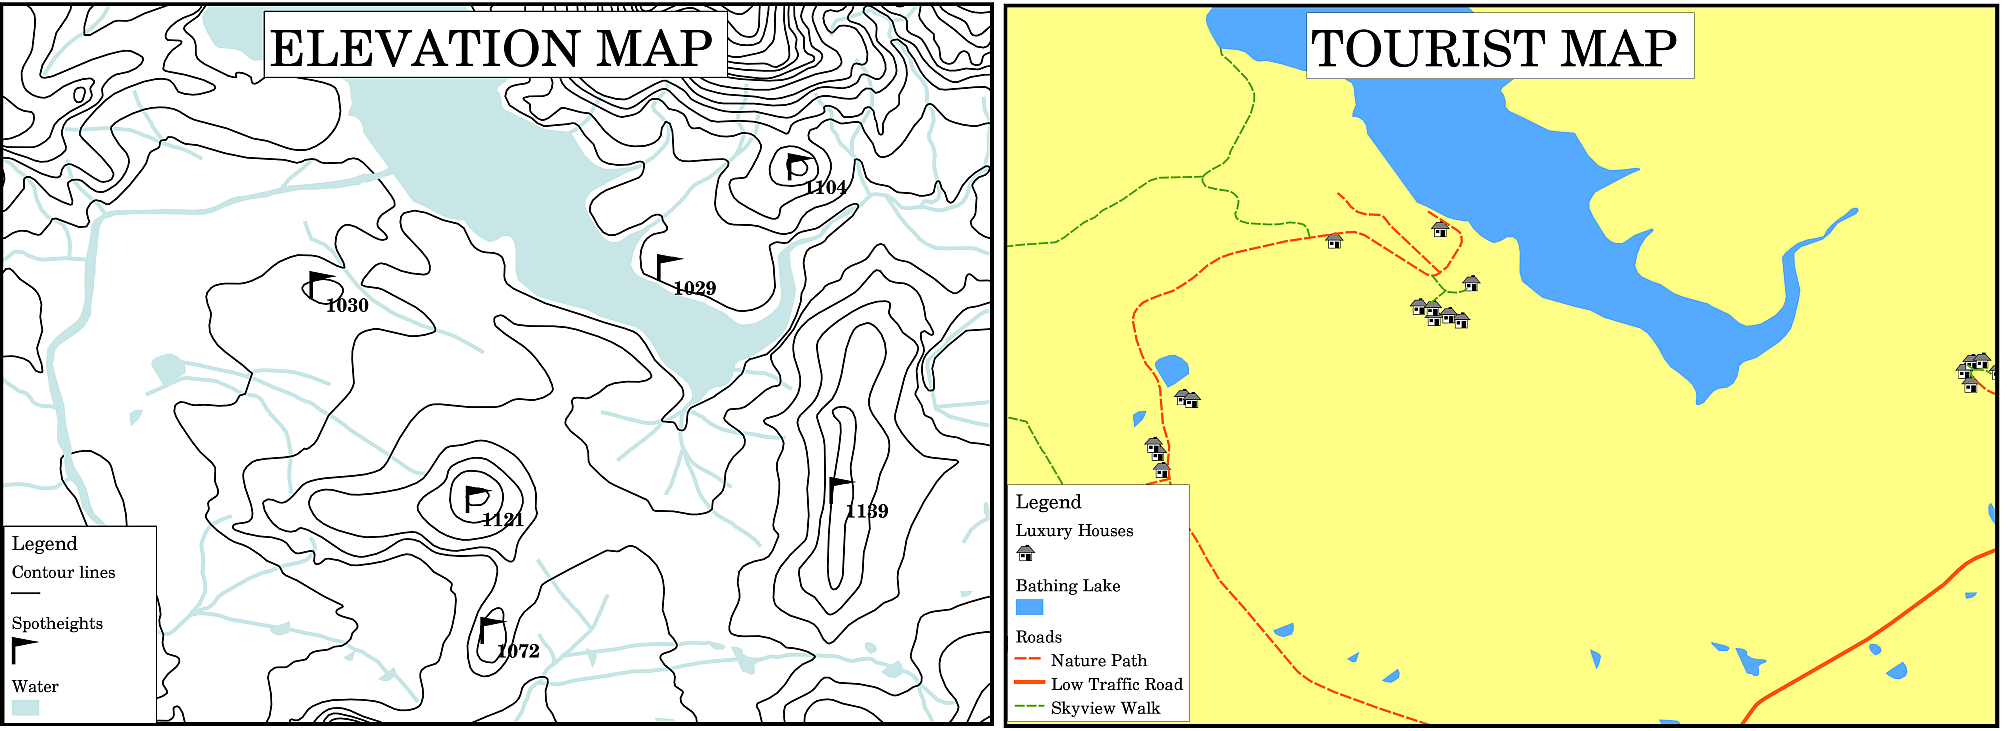
図 9.33 同じ領域からの2つの地図、両方とも背景に水面を持つが、凡例の異なるテーマ、地図記号、色を持つ。
You can also use different symbols and icons in your legend to show different themes. In 図 9.33 you can see a map with a lake in light blue overlaid with contour lines and spot heights to show information about the terrain in that area. On the right side you see the same area with the lake in the background but this map is designed to show tourists the location of houses they can rent for their holidays. It uses brighter colours, a house icon and more descriptive and inviting words in the legend.
9.5. 北向き矢印の詳細
方位(時にはバラコンパスと呼ばれる)は主要な方向、 北 、 南 、 東 、 西 を表示する図です。地図上では、北の方向を示すために使用されます。
たとえば、GISではこのことは、この湖から北に位置している家は地図上の湖上に見つけることができることを意味しています。東の道路は、地図上の水面の右側になり、南の川は水面の下になり、湖の西側に鉄道駅を検索する場合、それは地図上の左側に見つかるでしょう。
9.6. スケールの詳細
The scale of a map, is the value of a single unit of distance on the map, representing distance in the real world. The values are shown in map units (meters, feet or degrees). The scale can be expressed in several ways, for example, in words, as a ratio or as a graphical scale bar (see 図 9.34).
Expressing a scale in words is a commonly used method and has the advantage of being easily understood by most map users. You can see an example of a word based scale in a 図 9.34 (a). Another option is the representative fraction (RF) method, where both the map distance and the ground distance in the real world are given in the same map units, as a ratio. For example, a RF value 1:25,000 means that any distance on the map is 1/25,000 th of the real distance on the ground (see 図 9.34 (b)). The value 25,000 in the ratio is called the scale denominator. More experienced users often prefer the representative fraction method, because it reduces confusion.
表現分数が非常に小さな比、例えば1:1000 000、を表す場合、 小縮尺地図 と呼ばれます。一方、比が非常に大きい場合、例えば1:50 000地図、 大縮尺地図 と呼ばれます。小縮尺地図は 大きな領域 をカバーし、大縮尺地図は 小さな領域 をカバーする、と覚えておくと便利です!
A scale expression as a graphic or bar scale is another basic method of expressing a scale. A bar scale shows measured distances on the map. The equivalent distance in the real world is placed above as you can see in 図 9.34 (c).
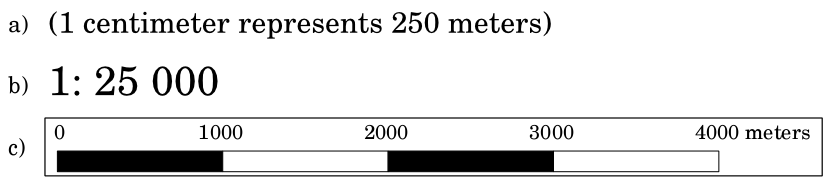
図 9.34 地図の縮尺は、言葉で(a)、比として(b)、またはグラフィックやバースケールとして(c)表現できます
地図は通常、例えば、1:10000、1:25000、1:50 000、1:100000、1:250 000、1:500000の標準縮尺で製造されています。これは地図の読者には何を意味するでしょう?それは地図上での測定距離に 縮尺分母 を掛ければ 現実世界 での距離がわかることを意味します。
例えば、1:25000の縮尺の地図上で100ミリメートルの距離を測定する場合、現実世界の距離はこのように計算します:
100 mm x 25,000 = 2,500,000 mm
これは、地図上の100ミリメートルは、実世界の250万ミリメートル(2500メートル)と等価であることを意味します。
Another interesting aspect of a map scale, is that the lower the map scale, the more detailed the feature information in the map will be. In 図 9.35, you can see an example of this. Both maps are the same size but have a different scale. The image on the left side shows more details, for example the houses south-west of the water body can be clearly identified as separate squares. In the image on the right you can only see a black clump of rectangles and you are not able to see each house clearly.
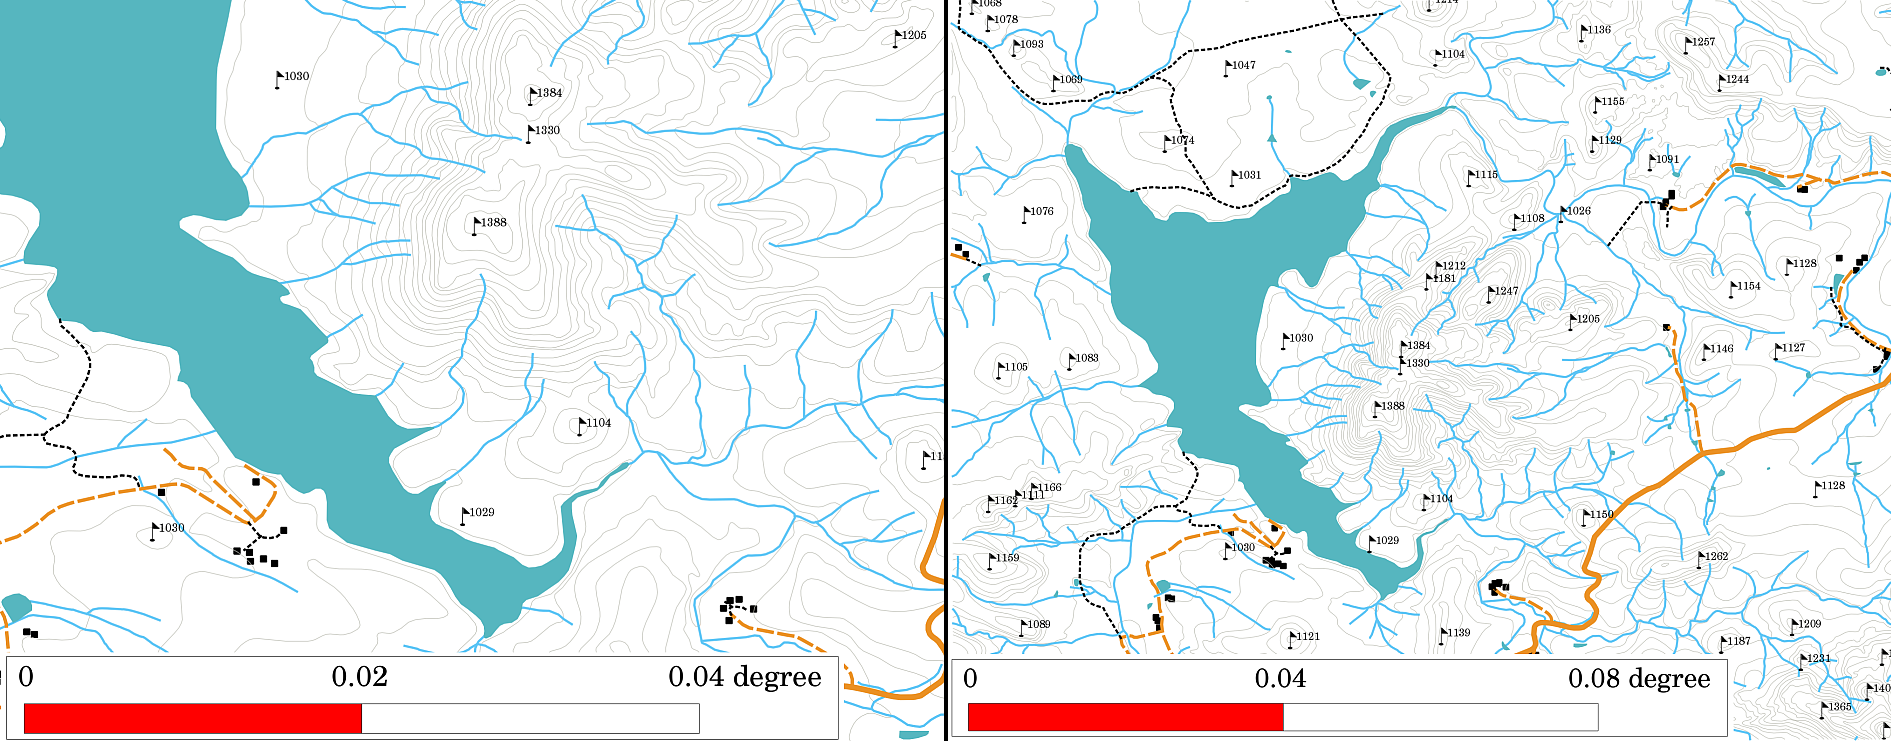
図 9.35 ある地域を二つの異なる縮尺で示す地図。左の地図の縮尺は1:25,000。右の地図の縮尺は1:50,000。
9.7. 整飾の詳細
地図の整飾エリアでは、重要な情報とテキストを追加することが可能です。例えば、使用されるデータの品質に関する情報は、いつだれによって地図の作成されたかなどの詳細についてのアイデアを読者に与えるために有用であり得ます。自分の町の地形図を見る場合、いつだれによって地図が作成されたか知っておくと便利でしょう。地図がすでに50歳であれば、おそらく、もはや存在しないか多分存在しなかった家屋や道路がたくさんあります。地図が公的機関によって作成されたことがわかっている場合は、連絡をとって、それらが更新された情報と、その地図のより多くの現在のバージョンを持っているかどうか尋ねることができます。
9.8. グリッドの詳細
A graticule is a network of lines overlain on a map to make spatial orientation easier for the reader. The lines can be used as a reference. As an example, the lines of a graticule can represent the earth's parallels of latitude and meridians of longitude. When you want to refer to a special area on a map during your presentation or in a report you could say: 'the houses close to latitude 26.04 / longitude -32.11 are often exposed to flooding during January and February' (see 図 9.36).
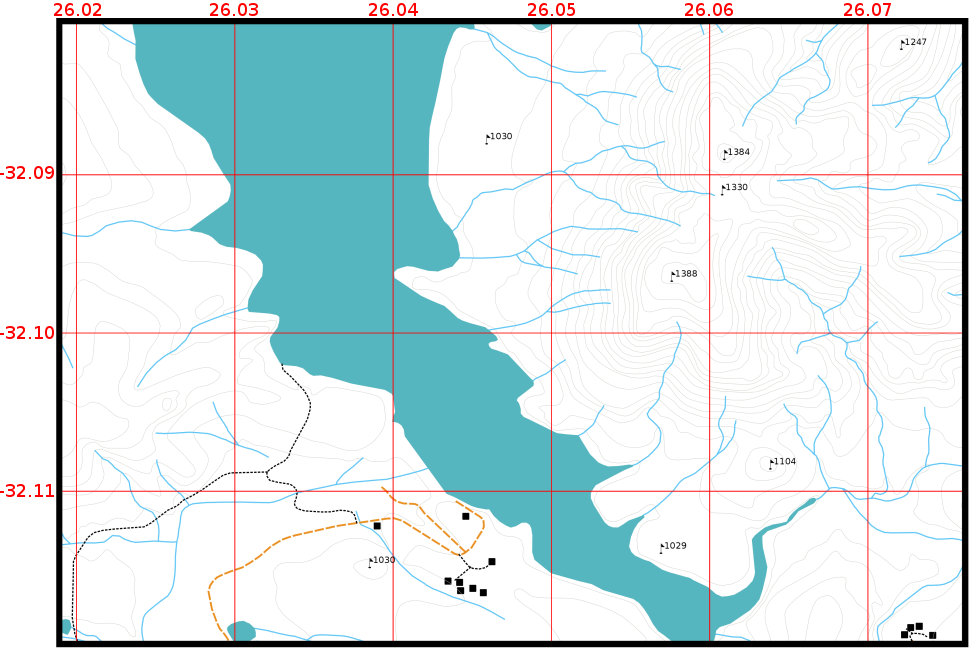
図 9.36 地球の緯度と経度の経線を表す格子線(赤線)。地図上の緯度と経度の値を地図上のより良い方向付けに使用できます。
9.9. 詳細な地図投影の名前
地図投影は、紙の平らなシート上に家、道路や湖のような、そのすべての地物を有する3次元地球を表現しようとします。想像できるように、これは非常に困難であり、さらには何百年も後に世界のどの地域のために完璧に地球を表現することが可能である単一の投影はありません。すべての投影は長所と短所があります。
To be able to create maps as precisely as possible, people have studied, modified, and produced many different kinds of projections. In the end almost every country has developed its own map projection with the goal of improving the map accuracy for their territorial area (see 図 9.37).
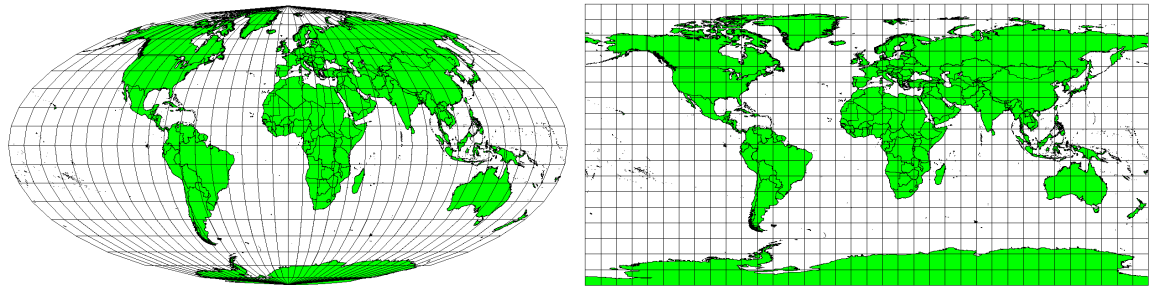
図 9.37 世界はさまざまな投影法があります。 左はMollweide Equal Area投影法、右はPlate Carree Equidistant円柱投影。
With this in mind, we can now understand why it makes sense to add the name of the projection on a map. It allows the reader to see quickly, if one map can be compared with another. For example, features on a map in a so-called Equal Area projection appear very different to features projected in a Cylindrical Equidistant projection (see 図 9.37).
地図投影は、非常に複雑なトピックであり、ここで完全にカバーすることはできません。それについての詳細をお知りになりたい場合は、私たちの前のトピック:「参照座標系」を見てみたいかもしれません。
9.10. 一般的な問題 / 注意すべき点
読者が知る必要があるすべての情報を表示し説明ながらも、理解しやすくて良いレイアウトの地図を作成することが困難な場合があります。これを実現するには、すべての地図要素の理想的な配置と構図を作成する必要があります。地図でどんな物語を語りたいか、凡例、スケールバーと認定などの要素がどのように整列されなければならないかに集中する必要があります。そうすることで、よいデザインの教育的な地図になり、誰が見ても理解できるでしょう。
9.11. わかりましたか?
ここでは以下のことを学びました:
地図製作 は、 地図要素 を一枚の紙に配置することを意味します。
地図要素 は,タイトル,地図,地図境界,凡例,縮尺、方位記号,謝辞です。
縮尺 は、現実の世界では、実際の距離と、地図上の距離の比率を表しています。
縮尺は 地図単位 (メートル,フィート,度)で示します。
凡例 は地図の全てのシンボルを説明します。
地図は, 複雑な情報をできる限り簡潔に説明するべき です。
地図は普通 北が上 で表示されます。
9.12. やってみよう
ここでは人に教える際のアイデアいくつか述べていきます:
GISに地元の地域のいくつかのベクターレイヤーをロードします。生徒たちが道路の種類や建物などのさまざまなタイプの凡例要素の例を識別できるかどうかを確認します。凡例要素のリストを作成し、アイコンがどのように表示されるべきかを定義します。そうすれば、読者は地図内の意味を簡単に把握できます。
生徒たちと一緒に紙の上に地図レイアウトを作成します。地図のタイトル、表示する GIS レイヤー、地図上でどのような色やアイコンが必要かを決めます。 トピック ベクトルデータ と ベクター属性データ で学んだテクニックを使って、それに応じてシンボルを調整してください。テンプレートをお持ちの場合は、 QGIS の印刷レイアウトを開き、地図レイアウトを計画どおりに配置してください。
9.13. 考えてみよう
コンピュータを利用できない場合は、任意の地形図を使用して、生徒たちと地図設計について話し合うことができます。地図が何を伝えたいのか生徒たちが理解しているかどうかを把握します。改善できるものは何ですか?地図がその地域の歴史をどのくらい正確に表現していますか? 100年前の地図は、今日の同じ地図とどう違うのですか?
9.14. より詳しく知りたい場合は
図書:
Chang, Kang-Tsung (2006). Introduction to Geographic Information Systems. 3rd Edition. McGraw Hill. ISBN: 0070658986
DeMers, Michael N. (2005). Fundamentals of Geographic Information Systems. 3rd Edition. Wiley. ISBN: 9814126195
Website: Scale (map)
QGISユーザーガイドもQGISで提供される地図作成に関するより詳細な情報を持っています。
9.15. 次は?
次のセクションでは ベクター分析 について詳しく見て、GISを格好良い地図を作るだけよりも多くのために使用する方法を見ていきます!