8. Системы координат
|
Цель: |
Ознакомиться с системами координат. |
Основные понятия: |
Система координат (CRS), проекция карты, перепроецирование «на лету», широта, долгота |
8.1. Обзор
Map projections try to portray the surface of the earth, or a portion of the earth, on a flat piece of paper or computer screen. In layman’s term, map projections try to transform the earth from its spherical shape (3D) to a planar shape (2D).
A coordinate reference system (CRS) then defines how the two-dimensional, projected map in your GIS relates to real places on the earth. The decision of which map projection and CRS to use depends on the regional extent of the area you want to work in, on the analysis you want to do, and often on the availability of data.
8.2. Подробнее о проекциях
Традиционным способом отображения формы Земли являются глобусы. Однако использование этого подхода имеет свои недостатки. Хотя глобусы по большому счету сохраняют форму Земли и иллюстрируют пространственную конфигурацию объектов размером с континент, их весьма проблематично носить в кармане. Кроме того, они удобны в использовании исключительно при малых масштабах (например 1:100 миллионам).
Большинство тематических карт, используемых в ГИС-приложениях, имеют гораздо больший масштаб. Обычно, наборы ГИС-данных имеют масштаб 1:250 000 или больше, в зависимости от уровня детализации. Глобус таких размеров будет дорогим и его использование будет очень сложным. Поэтому картографы разработали набор приемов, называемых проекциями карты, предназначенный для отображения сферической поверности Земли в двумерном пространстве с достаточной точностью.
Если рассматривать Землю вблизи, её можно считать плоской. Однако, при взгляде из космоса видно, что её форма приближена к сферической. Карты, как будет показано в следующем разделе, отражают реальность. На них показаны не только объекты, но и их форма и пространственное расположение. Каждая проекция имеет достоинства и недостатки. Выбор наилучшей проекции для карты определяется её масштабом и назначением. Например, проекция может давать неприемлемые искажения в случае отображения всего африканского континента, но идеально подходить для создания крупномасштабной (подробной) карты страны. Свойства проекций также могут влиять на визуальные параметры карты. Так, некоторые проекции хорошо подходят для маленьких областей, другие хороши для отображения объектов, протяженных с запада на восток, третьи — для объектов вытянутых с севера на юг.
8.3. Три типа картографических проекций
The process of creating map projections is best illustrated by positioning a light source inside a transparent globe on which opaque earth features are placed. Then project the feature outlines onto a two-dimensional flat piece of paper. Different ways of projecting can be produced by surrounding the globe in a cylindrical fashion, as a cone, or even as a flat surface. Each of these methods produces what is called a map projection family. Therefore, there is a family of planar projections, a family of cylindrical projections, and another called conical projections (see Рис. 8.3)
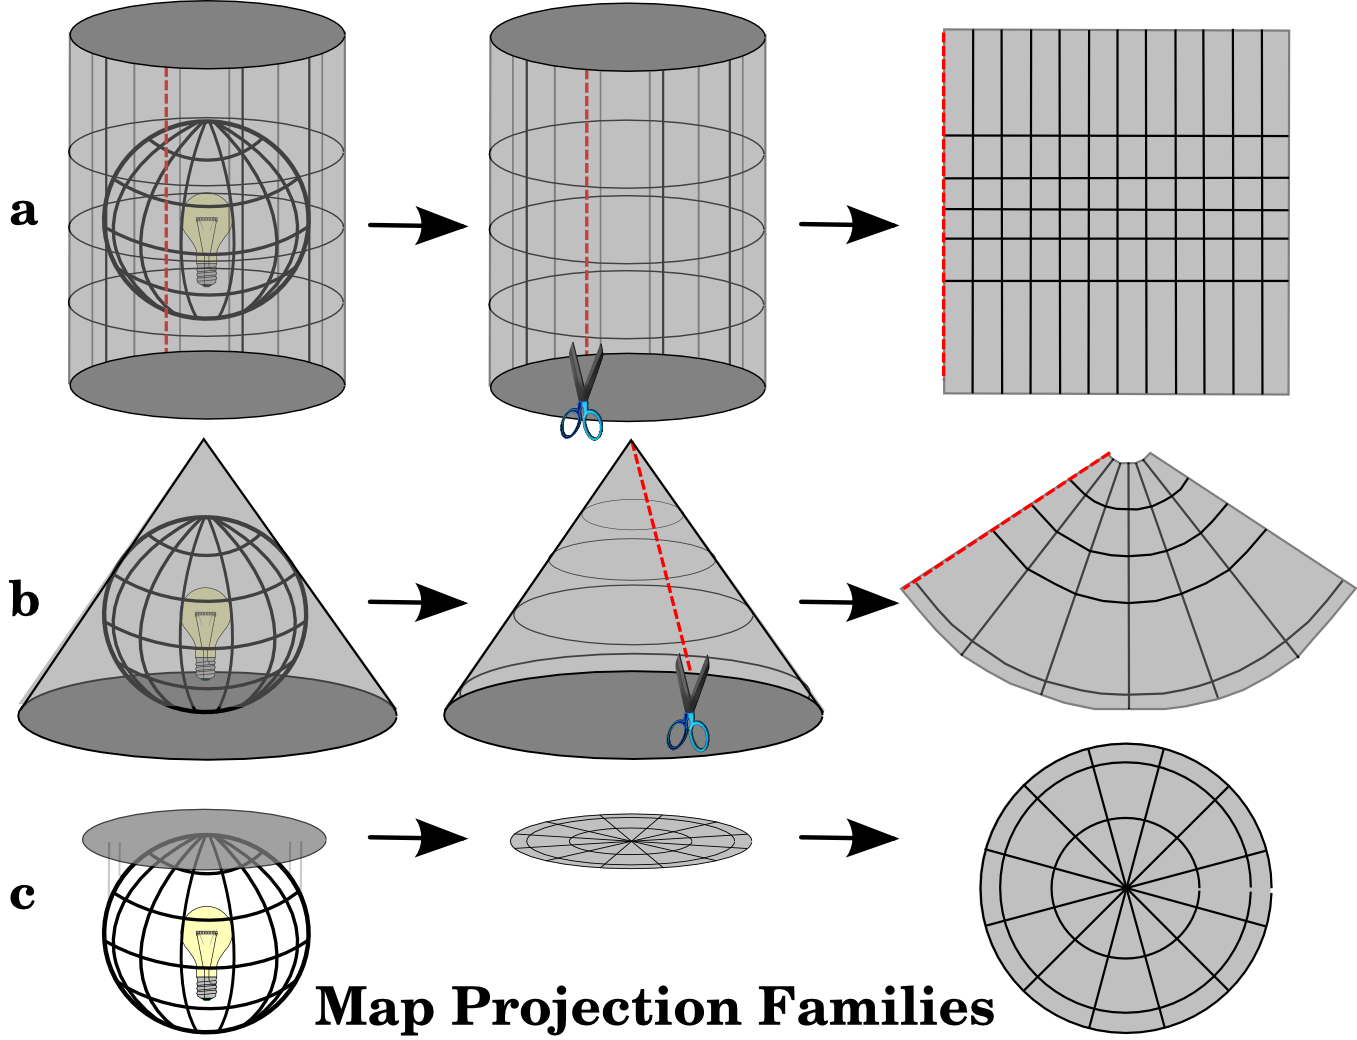
Рис. 8.3 Три типа картографических проекций: a) цилиндрические, b) конические, c) азимутальные.
В настоящее время процесс проецирования сферической Земли на бумагу выполняется с использованием математических преобразований и тригонометрии. Но в основе лежит все то же пропускание луча света через глобус.
8.4. Точность картографических проекций
Map projections are never absolutely accurate representations of the spherical earth. As a result of the map projection process, every map shows distortions of angular conformity, distance and area. A map projection may combine several of these characteristics, or may be a compromise that distorts all the properties of area, distance and angular conformity, within some acceptable limit. Examples of compromise projections are the Winkel Tripel projection and the Robinson projection (see Рис. 8.4), which are often used for producing and visualizing world maps.
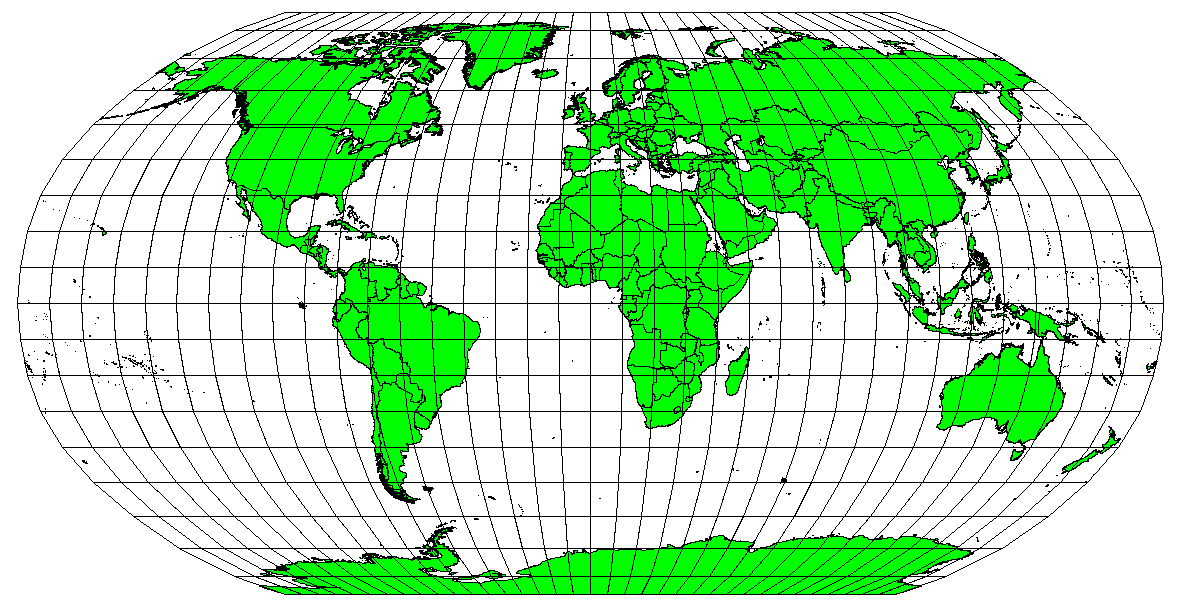
Рис. 8.4 Проекция Робинсона дает приемлемые искажения площади, расстояний и углов.
В большинстве случаев сохранить все характеристики исходных объектов при проецировании невозможно. Это значит, что когда вам требуется выполнить анализ, необходимо подбирать такую проекцию, которая даст наилучшие характеристики для анализа. Например, если требуется измерить расстояния, необходимо выбрать проекцию, которая обеспечит точные расстояния.
8.4.1. Равноугольные проекции
Когда мы работаем с глобусом, основные направления компаса (север, восток, юг и запад) всегда расположены под углом в 90 градусов друг к другу. Другими словами восток всегда будет находиться на 90 градусов от севера. Проекция может сохранять угловые направления, и такая проекция называется конморфной или равноугольной.
These projections are used when the preservation of angular relationships is important. They are commonly used for navigational or meteorological tasks. It is important to remember that maintaining true angles on a map is difficult for large areas and should be attempted only for small portions of the earth. The conformal type of projection results in distortions of areas, meaning that if area measurements are made on the map, they will be incorrect. The larger the area the less accurate the area measurements will be. Examples are the Mercator projection (as shown in Рис. 8.5) and the Lambert Conformal Conic projection. The U.S. Geological Survey uses a conformal projection for many of its topographic maps.
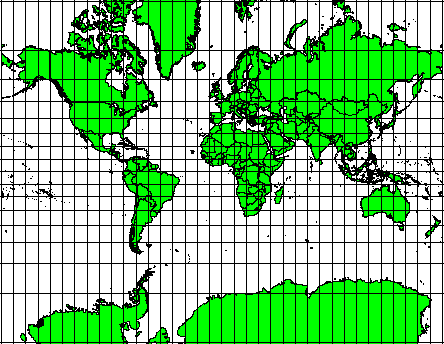
Рис. 8.5 Проекция Меркатора используется в тех случаях, когда важна правильность углов и допустимы искажения площади.
8.4.2. Равнопромежуточные проекции
If your goal in projecting a map is to accurately measure distances, you should select a projection that is designed to preserve distances well. Such projections, called equidistant projections, require that the scale of the map is kept constant. A map is equidistant when it correctly represents distances from the centre of the projection to any other place on the map. Equidistant projections maintain accurate distances from the centre of the projection or along given lines. These projections are used for radio and seismic mapping, and for navigation. The Plate Carree Equidistant Cylindrical (see Рис. 8.6) and the Equirectangular projection are two good examples of equidistant projections. The Azimuthal Equidistant projection is the projection used for the emblem of the United Nations (see Рис. 8.7).
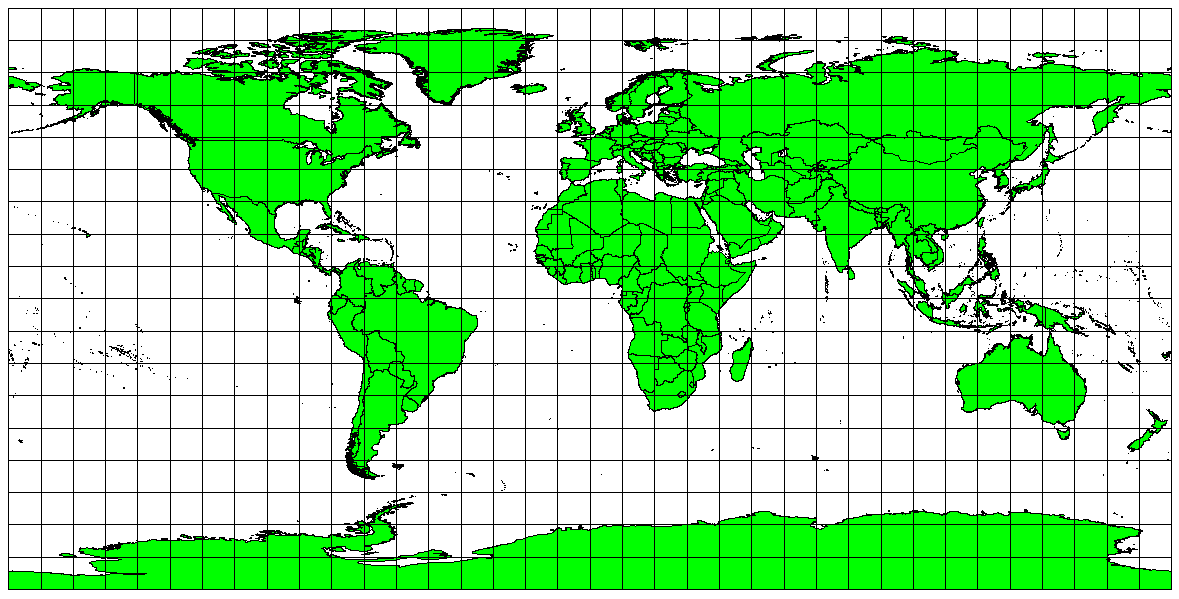
Рис. 8.6 Равнопромежуточная цилиндрическая проекция Плате-Карре используется, когда необходимо получить точные расстояния.

Рис. 8.7 Логотип ООН использует азимутальную равнопромежуточную проекцию.
8.4.3. Равновеликие проекции
When a map portrays areas over the entire map, so that all mapped areas have the same proportional relationship to the areas on the Earth that they represent, the map is an equal area map. In practice, general reference and educational maps most often require the use of equal area projections. As the name implies, these maps are best used when calculations of area are the dominant calculations you will perform. If, for example, you are trying to analyse a particular area in your town to find out whether it is large enough for a new shopping mall, equal area projections are the best choice. On the one hand, the larger the area you are analysing, the more precise your area measures will be, if you use an equal area projection rather than another type. On the other hand, an equal area projection results in distortions of angular conformity when dealing with large areas. Small areas will be far less prone to having their angles distorted when you use an equal area projection. Alber’s equal area, Lambert’s equal area and Mollweide Equal Area Cylindrical projections (shown in Рис. 8.8) are types of equal area projections that are often encountered in GIS work.
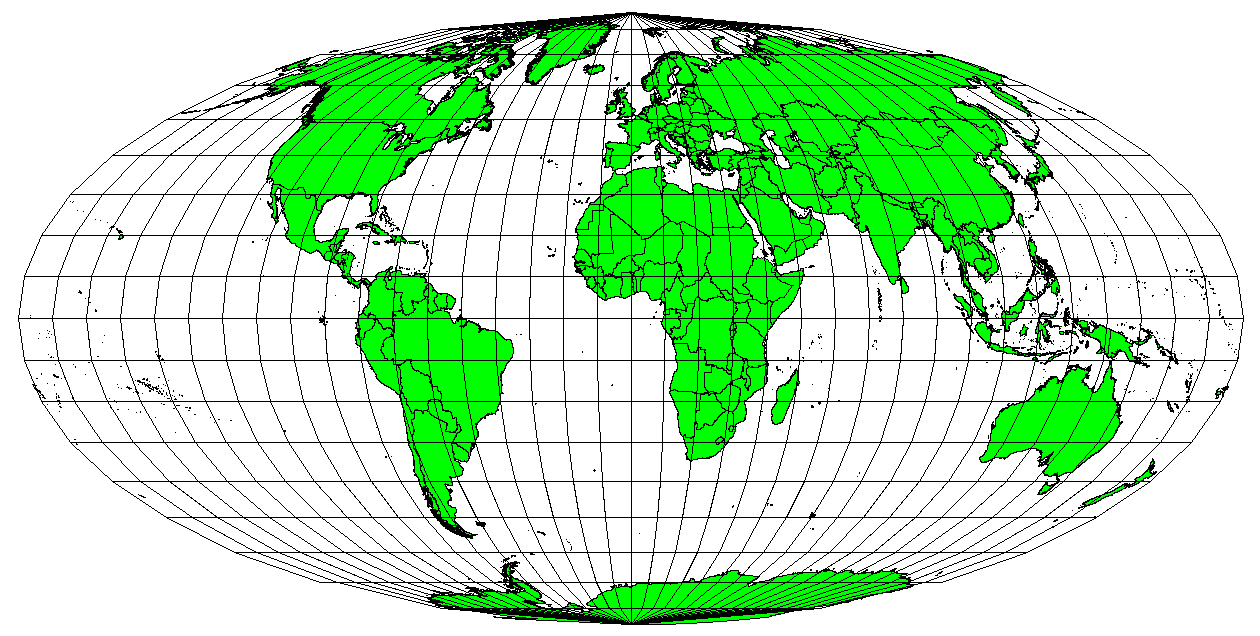
Рис. 8.8 Равновеликая псевдоцилиндрическая проекция Мольвейде, например, гарантирует, что площади всех отображаемых объектов на карте - пропорциональны площадям объектов на поверхности Земли.
Имейте в виду, что картографическая проекция - очень сложная тема. Существуют сотни различных проекций, каждая из которых пытается отобразить на плоском листе бумаги определённую часть поверхности Земли как можно достовернее. На самом деле, выбор используемой проекции - ваш выбор. Многие государства имеют наиболее часто используемые проекции и при обмене данными специалисты следуют государственному тренду.
8.5. Подробнее о системах координат
С помощью систем координат каждая точка на поверхности Земли может быть представлена набором из трёх чисел, называемых координатами. В целом, системы координат делятся на системы координат проекций (также называемых Декартовыми или прямоугольными системами координат) и географические системы координат.
8.5.1. Географические системы координат
Использование географических систем координат очень распространено. Для описания положения на поверхности Земли они используют градусы широты и долготы и, иногда, значение высоты. Наиболее популярная называется WGS 84.
Lines of latitude run parallel to the equator and divide the earth into 180 equally spaced sections from North to South (or South to North). The reference line for latitude is the equator and each hemisphere is divided into ninety sections, each representing one degree of latitude. In the northern hemisphere, degrees of latitude are measured from zero at the equator to ninety at the north pole. In the southern hemisphere, degrees of latitude are measured from zero at the equator to ninety degrees at the south pole. To simplify the digitisation of maps, degrees of latitude in the southern hemisphere are often assigned negative values (0 to -90°). Wherever you are on the earth’s surface, the distance between the lines of latitude is the same (60 nautical miles). See Рис. 8.9 for a pictorial view.
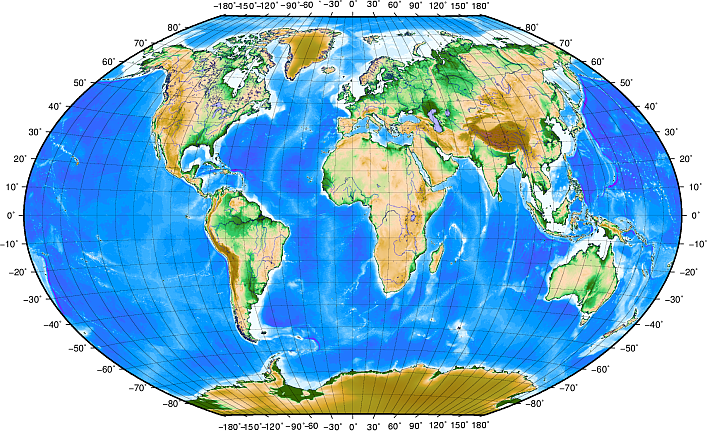
Рис. 8.9 Географическая система координат с параллелями (линии, параллельные экватору) и меридианами с центральным меридианом в Гринвиче.
Lines of longitude, on the other hand, do not stand up so well to the standard of uniformity. Lines of longitude run perpendicular to the equator and converge at the poles. The reference line for longitude (the prime meridian) runs from the North pole to the South pole through Greenwich, England. Subsequent lines of longitude are measured from zero to 180 degrees East or West of the prime meridian. Note that values West of the prime meridian are assigned negative values for use in digital mapping applications. See Рис. 8.9 for a pictorial view.
На экваторе, и только на экваторе, длина дуги в 1 градус меридиана и длина дуги в 1 градус параллели - равны. При движении по направлению к полюсам, расстояние между меридианами постоянно уменьшается, пока, точно на полюсе, все 360° долготы не сойдутся в одной точке - вы даже сможете пальцем прикоснуться к ней (хотя, вероятно, захотите одеть перчатки). Используя географическую систему координат, мы получаем сетку, делящую поверхность Земли на четырёхугольники площадью примерно 12363.365 кв. километров на экваторе, которые практически бесполезны для определения местоположения чего-либо в пределах этого многоугольника.
Чтобы быть по-настоящему полезной, сетка параллелей и меридианов на карте должна быть поделена на достаточно маленькие отрезки, которые можно было бы использовать (с достаточной степенью точности) для описания расположения точки на карте. Для достижения этой цели, градусы делятся на минуты (') и секунды ("). В одном градусе 60 минут, а в минуте 60 секунд (3600 секунд в градусе). Так, на экваторе, одна секунда параллели или меридиана равна 30.87624 метров.
8.5.2. Системы координат проекций (прямоугольные)
A two-dimensional coordinate reference system is commonly defined by two axes. At right angles to each other, they form a so called XY-plane (see Рис. 8.10 on the left side). The horizontal axis is normally labelled X, and the vertical axis is normally labelled Y. In a three-dimensional coordinate reference system, another axis, normally labelled Z, is added. It is also at right angles to the X and Y axes. The Z axis provides the third dimension of space (see Рис. 8.10 on the right side). Every point that is expressed in spherical coordinates can be expressed as an X Y Z coordinate.
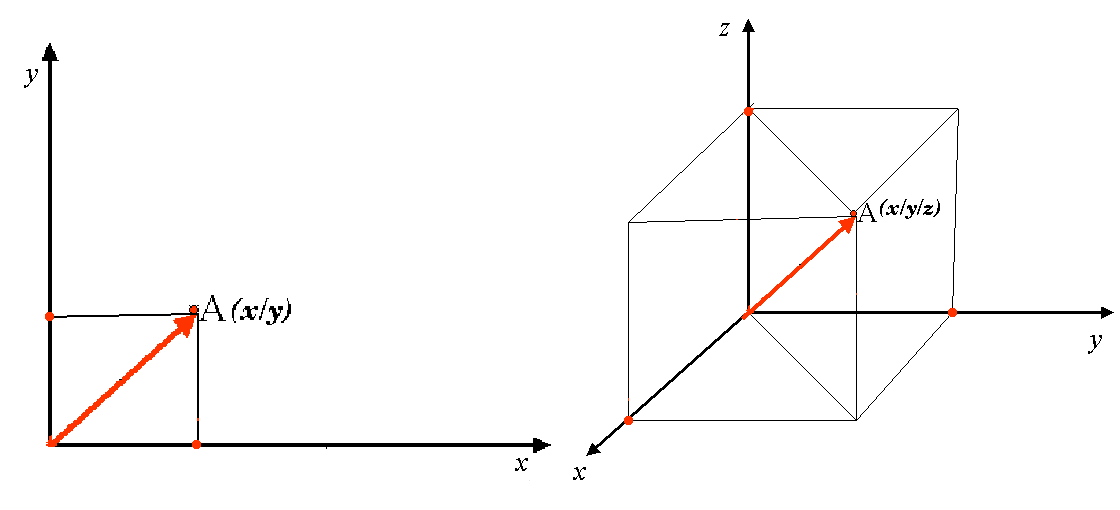
Рис. 8.10 Двух и трёхмерные системы координат.
Системы координат проекций в южном полушарии (к югу от экватора) берут начало от экватора и начального меридиана. Это значит, что значения по оси Y увеличиваются к югу, а значения по оси X увеличиваются на Запад. В северном полушарии (к северу от экватора) началом служат также экватор и начальный меридиан. Однако, теперь значения по оси Y увеличиваются на Север, а значения по оси X увеличиваются на Восток. Далее будет описана часто используемая система координат, называемая Универсальная поперечная проекция Меркатора (Universal Transverse Mercator, UTM).
8.6. Универсальная поперечная проекция Меркатора (UTM)
The Universal Transverse Mercator (UTM) coordinate reference system has its origin on the equator at a specific Longitude. Now the Y-values increase southwards and the X-values increase to the West. The UTM CRS is a global map projection. This means, it is generally used all over the world. But as already described in the section „accuracy of map projections“ above, the larger the area (for example South Africa) the more distortion of angular conformity, distance and area occur. To avoid too much distortion, the world is divided into 60 equal zones that are all 6 degrees wide in longitude from East to West. The UTM zones are numbered 1 to 60, starting at the antimeridian (zone 1 at 180 degrees West longitude) and progressing East back to the antemeridian (zone 60 at 180 degrees East longitude) as shown in Рис. 8.11.
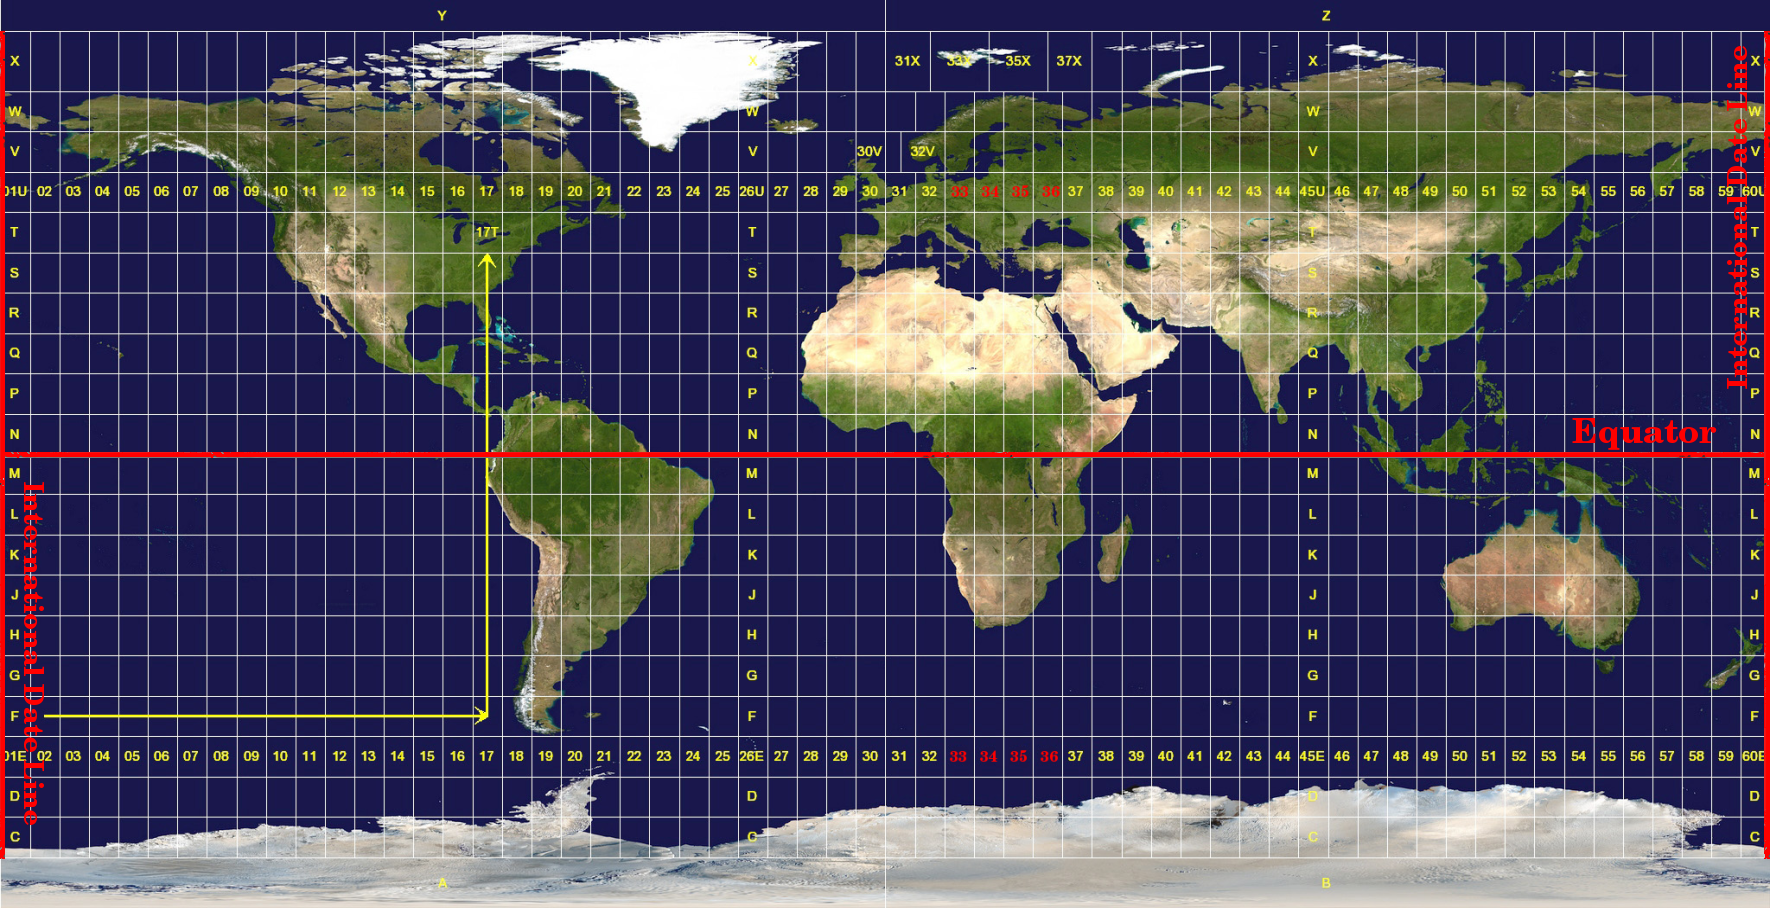
Рис. 8.11 Зоны Универсальной поперечной проекции Меркатора. Для Южной Африки используются зоны UTM: 33S, 34S, 35S, и 36S.
As you can see in Рис. 8.11 and Рис. 8.12, South Africa is covered by four UTM zones to minimize distortion. The zones are called UTM 33S, UTM 34S, UTM 35S and UTM 36S. The S after the zone means that the UTM zones are located south of the equator.
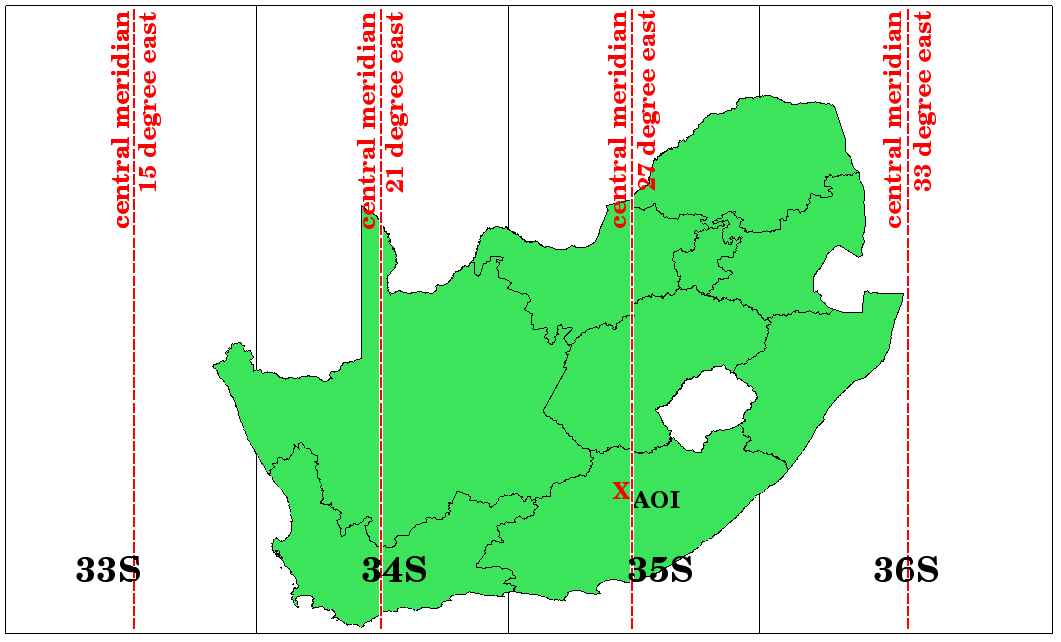
Рис. 8.12 Зоны UTM 33S, 34S, 35S и 36S с центральными меридианами используются для высокоточного проецирования территории Южной Африки. Красный крест показывает Зону интереса (Area of Interest - AOI).
Say, for example, that we want to define a two-dimensional coordinate within the Area of Interest (AOI) marked with a red cross in Рис. 8.12. You can see, that the area is located within the UTM zone 35S. This means, to minimize distortion and to get accurate analysis results, we should use UTM zone 35S as the coordinate reference system.
The position of a coordinate in UTM south of the equator must be indicated with the zone number (35) and with its northing (Y) value and easting (X) value in meters. The northing value is the distance of the position from the equator in meters. The easting value is the distance from the central meridian (longitude) of the used UTM zone. For UTM zone 35S it is 27 degrees East as shown in Рис. 8.12. Furthermore, because we are south of the equator and negative values are not allowed in the UTM coordinate reference system, we have to add a so called false northing value of 10,000,000 m to the northing (Y) value and a false easting value of 500,000 m to the easting (X) value. This sounds difficult, so, we will do an example that shows you how to find the correct UTM 35S coordinate for the Area of Interest.
8.6.1. The northing (Y) value
The place we are looking for is 3,550,000 meters south of the equator, so the northing (Y) value gets a negative sign and is -3,550,000 m. According to the UTM definitions we have to add a false northing value of 10,000,000 m. This means the northing (Y) value of our coordinate is 6,450,000 m (-3,550,000 m + 10,000,000 m).
8.6.2. The easting (X) value
First we have to find the central meridian (longitude) for the UTM zone 35S. As we can see in Рис. 8.12 it is 27 degrees East. The place we are looking for is 85,000 meters West from the central meridian. Just like the northing value, the easting (X) value gets a negative sign, giving a result of -85,000 m. According to the UTM definitions we have to add a false easting value of 500,000 m. This means the easting (X) value of our coordinate is 415,000 m (-85,000 m + 500,000 m). Finally, we have to add the zone number to the easting value to get the correct value.
В результате, координаты нашей Точки интереса, в значениях системы координат UTM зона 35S будут выглядеть следующим образом: 35 415,000 м В / 6,450,000 м С. В некоторых ГИС, когда правильно указана проекция UTM зона 35S и единицы измерения в метрах, номер зоны можно убрать и записать пару координат в более простом виде 415,000 6,450,000.
8.7. Перепроецирование «на лету»
Как вы, вероятно, может себе представить, возможна ситуация когда данные, которые вы хотите использовать в ГИС, спроецированы в различных системах координат. Например, у вас может быть векторный слой границ Южной Африки в UTM 35S и другой векторный слой с информацией о замерах объема осадков, в географической системе координат WGS 84. В ГИС эти два векторных слоя отобразятся в совершенно разных местах окна карты, потому что они имеют разные проекции.
To solve this problem, many GIS include a functionality called on-the-fly projection. It means, that you can define a certain projection when you start the GIS and all layers that you then load, no matter what coordinate reference system they have, will be automatically displayed in the projection you defined. This functionality allows you to overlay layers within the map window of your GIS, even though they may be in different reference systems. In QGIS, this functionality is applied by default.
8.8. Частые ошибки / о чем стоит помнить
Тема картографическая проекция очень сложная и даже профессионалы-географы, геодезисты зачастую испытывают сложности с правильным определением проекций карт и систем координат. Обычно, если работаете в ГИС, у вас уже есть спроецированные данные для начала работы. В большинстве случаев, эти данные будут перепроецироваться в определённую систему координат, поэтому не возникнет необходимости создавать новую систему координат или вручную перепроецировать данные в другую систему координат. Тем не менее, всегда полезно знать что такое проекция карты и система координат.
8.9. Что мы узнали?
Подведём итоги:
Проекция карты изображает поверхность Земли на двухмерном, плоском листе бумаги или экране компьютера.
Существую мировые проекции карт, но большинство проекций созданы и оптимизированы для проецирования малых площадей поверхности Земли.
Картографические проекции никогда абсолютно точно не передают сферическую поверхность Земли. Существуют искажения углов, длин и площадей. Невозможно одновременно корректно отображать все эти характеристики с помощью проекции карты.
Система координат (CRS) определяет, с помощью координат, каким образом двухмерная,спроецированная карта соотносится с реальной местностью на поверхности Земли.
Существуют два различных типа систем координат: Географические системы координат и Системы координат проекций.
Перепроецирование «на лету» - функция ГИС, которая позволяет совмещать слои, даже если они имеют различные системы координат.
8.10. Попробуйте сами!
Вот некоторые идеи для заданий:
Start QGIS
In check No projection (or unknown/non-Earth projection)
Load two layers of the same area but with different projections
Let your pupils find the coordinates of several places on the two layers. You can show them that it is not possible to overlay the two layers.
Then define the coordinate reference system as Geographic/WGS 84 inside the Project Properties dialog
Load the two layers of the same area again and let your pupils see how setting a CRS for the project (hence, enabling «on-the-fly» projection) works.
You can open the Project Properties dialog in QGIS and show your pupils the many different Coordinate Reference Systems so they get an idea of the complexity of this topic. You can select different CRSs to display the same layer in different projections.
8.11. Стоит учесть
If you don’t have a computer available, you can show your pupils the principles of the three map projection families. Get a globe and paper and demonstrate how cylindrical, conical and planar projections work in general. With the help of a transparency sheet you can draw a two-dimensional coordinate reference system showing X axes and Y axes. Then, let your pupils define coordinates (X and Y values) for different places.
8.12. Дополнительная литература
Книги:
Chang, Kang-Tsung (2006). Introduction to Geographic Information Systems. 3rd Edition. McGraw Hill. ISBN: 0070658986
DeMers, Michael N. (2005). Fundamentals of Geographic Information Systems. 3rd Edition. Wiley. ISBN: 9814126195
Galati, Stephen R. (2006): Geographic Information Systems Demystified. Artech House Inc. ISBN: 158053533X
Веб-сайты:
https://foote.geography.uconn.edu/gcraft/notes/mapproj/mapproj_f.html
http://geology.isu.edu/wapi/geostac/Field_Exercise/topomaps/index.htm
Работа с проекциями в QGIS подробно описана в Руководстве пользователя QGIS.
8.13. Что дальше?
Следующий раздел посвящен созданию карт.