17. メッシュデータの操作
17.1. メッシュとは?
メッシュとは非構造格子のことで、通常、時間的な要素やその他の要素を持っています。空間成分には、2Dまたは3D空間の頂点、辺、面の集合が含まれます。
頂点 - (レイヤの座標参照系の)XY(Z) 成分を持つ点です。
辺 - 頂点の組を接続します。
面 - 面は閉じた形状を形成する辺の集合です。通常は三角形または四辺形(quad)で、頂点数が多い多角形はめったにありません。
上記の要素に基づいて、メッシュレイヤはさまざまなタイプの構造を持つことができます:
1Dメッシュ:頂点と辺で構成されます。辺は2つの頂点を接続し、その上にデータ(スカラまたはベクタ)を割り当てることができます。 1Dメッシュネットワークは、たとえば、都市の排水システムのモデリングに使用できます。
2Dメッシュ:三角形の面や、構造格子または非構造格子の四角形の面で構成されます。
3Dレイヤードメッシュ:複数の積み重ねられた2D非構造メッシュで構成され、それぞれが垂直座標によって垂直方向(レベル)に押し出されたものです。頂点と面は、各垂直レベルで同じトポロジを持っています。メッシュ定義(垂直レベルの押し出し)は、一般的には時間とともに変化する可能性があります。データは通常、ボリュームの中心か、またはパラメトリック関数によって定義されます。
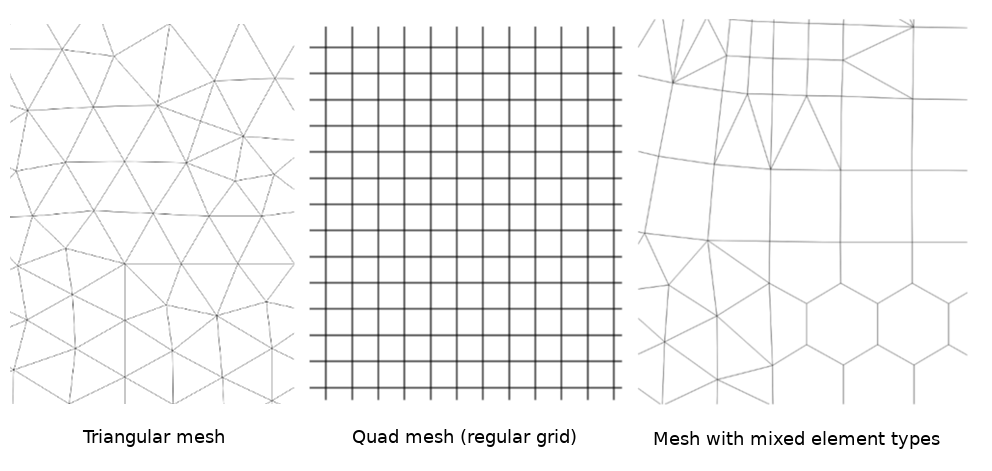
図 17.1 さまざまなメッシュタイプ
メッシュは空間構造に関する情報を提供します。さらに、メッシュはすべての頂点に値を割り当てるデータセット(グループ)を持つことができます。たとえば、次の図に示すように頂点が番号付けされた三角メッシュがあるとします:
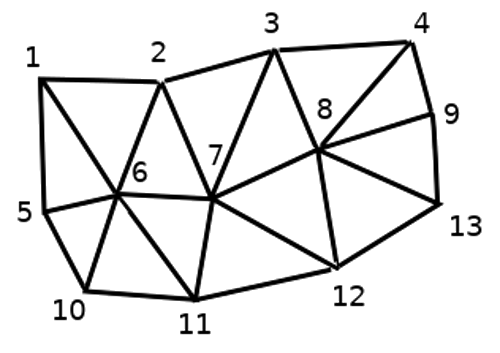
図 17.2 頂点に番号が付けられた三角形グリッド
各頂点は異なるデータセット(通常は複数の量)を格納でき、それらのデータセットは時間的な次元を持つこともできます。したがって、1つのファイルに複数のデータセットを含めることができます。
以下のテーブルは、メッシュデータセットに格納できる情報についての概念を示しています。テーブルの列はメッシュの頂点のインデックスを表し、各行は1つのデータセットを表します。データセットはさまざまなデータ型を持つことができます。この例の場合には、ある特定の時間(t1、t2、t3)における地上10mの風速がテーブルに格納されています。
同様に、メッシュデータセットは各頂点のベクトル値も格納できます。たとえば、与えられたタイムスタンプでの風向ベクトルは、
地上10m風速 |
1 |
2 |
3 |
... |
|---|---|---|---|---|
time=t1 における地上10m風速 |
17251 |
24918 |
32858 |
... |
time=t2 における地上10m風速 |
19168 |
23001 |
36418 |
... |
time=t3 における地上10m風速 |
21085 |
30668 |
17251 |
... |
... |
... |
... |
... |
... |
time=t1 における地上10m風向 |
[20,2] |
[20,3] |
[20,4.5] |
... |
time=t2 における地上10m風向 |
[21,3] |
[21,4] |
[21,5.5] |
... |
time=t3 における地上10m風向 |
[22,4] |
[22,5] |
[22,6.5] |
... |
... |
... |
... |
... |
... |
色を値に割り当てることでデータを可視化することができ( 単バンド疑似カラー のラスタレンダリングと同様です)、メッシュトポロジに従って頂点間のデータが補間されます。いくつかの量は単純なスカラー値ではなく、2Dベクトル(例えば風向)であるのはよくあることです。そのような量については、方向を示す矢印を表示することが望ましいでしょう。
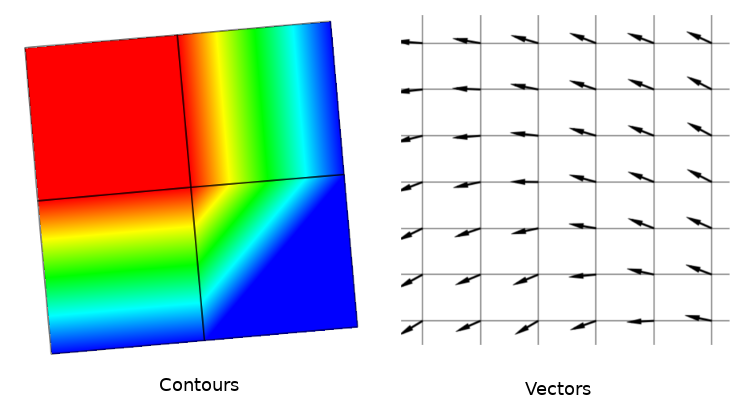
図 17.3 メッシュデータの可視化事例
17.2. サポートする形式
QGISは MDALドライバ を使用してメッシュデータにアクセスし、 さまざまなフォーマット をネイティブにサポートしています。QGISでメッシュレイヤを編集できるかどうかは、フォーマットとメッシュ構造タイプによります。
メッシュデータセットをQGISに読み込むには、 データソースマネージャ ダイアログで  メッシュ タブを使用します。詳細は、 メッシュレイヤを読み込む を参照してください。
17.3. メッシュデータセットのプロパティ
メッシュレイヤの レイヤプロパティ ダイアログは、レイヤのデータセットグループとそのレンダリング(アクティブなデータセットグループ、シンボロジ、2Dおよび3Dレンダリング)を管理するための一般的な設定を提供します。また、レイヤに関する情報も提供します。
レイヤプロパティ ダイアログにアクセスするには:
レイヤ パネル内でレイヤをダブルクリックするか、レイヤを右クリックして、ポップアップメニューから プロパティ... を選択する
レイヤが選択された状態で、 メニューを選ぶ
メッシュレイヤの レイヤプロパティ ダイアログには、以下のセクションがあります:
|
||
|
||
[1] レイヤスタイルパネル からも利用可能です
注釈
メッシュレイヤのプロパティの大半は、ダイアログの下部にある スタイル メニューを使用して .qml ファイルに保存したり、読み込んだりすることができます。詳細については、 カスタムスタイルを管理する を参照してください。
17.3.1. 情報プロパティ
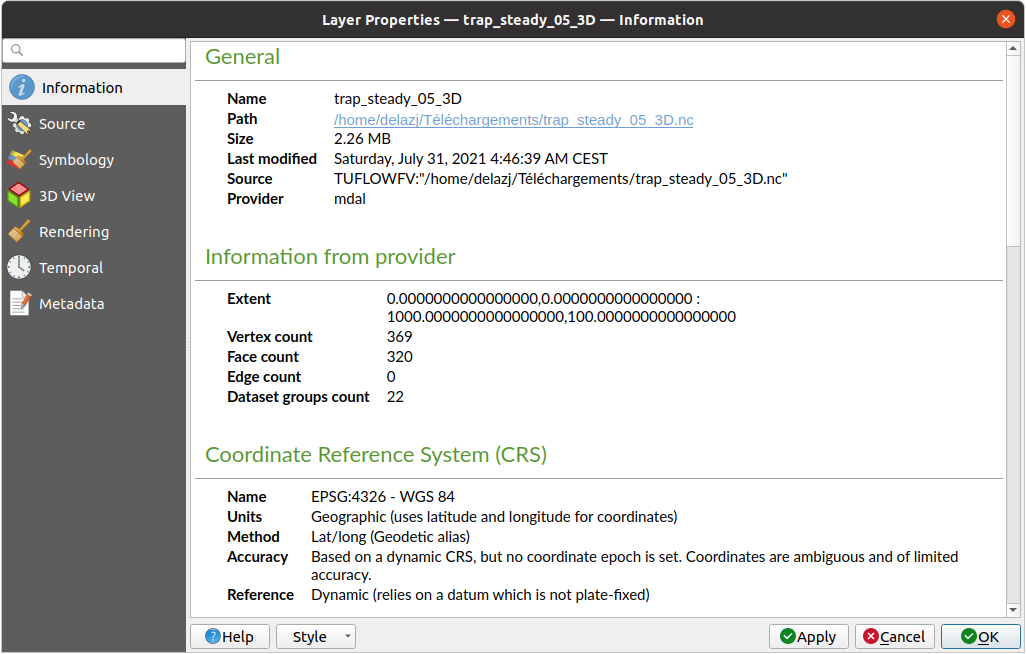
図 17.4 メッシュレイヤの情報プロパティ
 情報 タブは読み取り専用で、現在のレイヤの要約された情報やメタデータをさっと掴むことができる興味深い場所です。提供される情報には、以下のものがあります:
一般情報:プロジェクト内での名前、ソースへのパス、付随的なファイルのリスト、最終更新時刻、ファイルの大きさ、使用しているプロバイダ
プロバイダからの情報:領域、頂点の数、面の数、エッジ数、データセット数
空間参照システム(CRS):CRSの名前、単位、投影法、精度、参照(静的か動的か)
入力された メタデータ からの情報:アクセス、領域、リンク、連絡先、履歴など
17.3.2. ソースプロパティ
 ソース タブは、選択されたメッシュに関する以下のような基本的な情報を表示します:
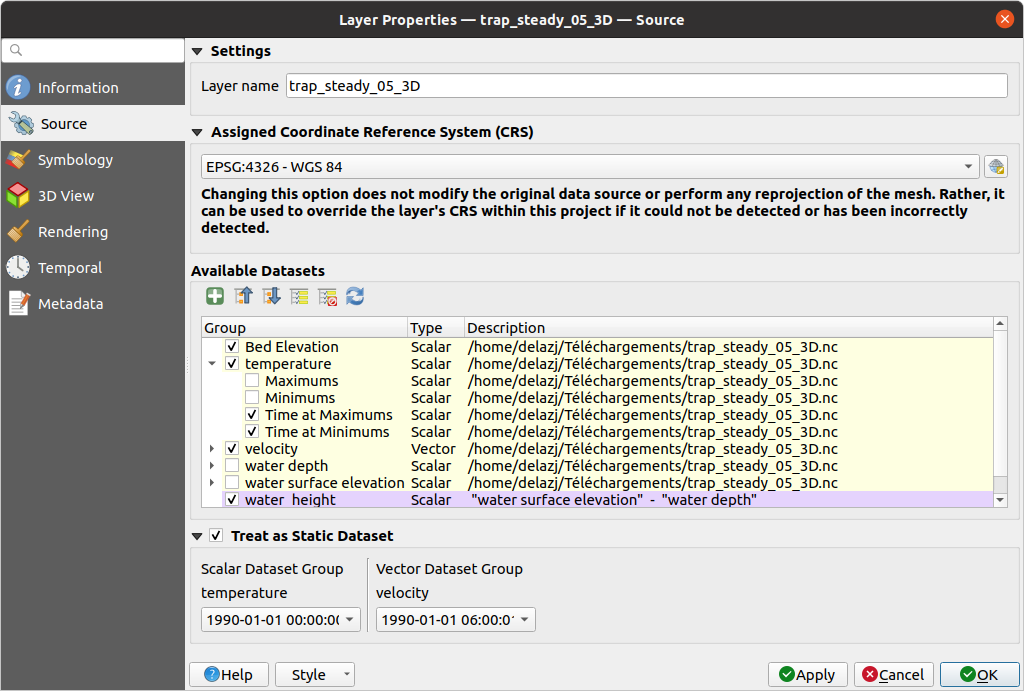
図 17.5 メッシュレイヤのソースプロパティ
レイヤ パネルで表示されるレイヤ名
座標参照系の設定:レイヤに 設定されたCRS を表示します。最近使用したCRSをドロップダウンリストから選ぶか、
 CRSの選択 ボタン( 座標参照系セレクタ 参照)をクリックすることで、レイヤのCRSを変更できます。レイヤのCRSが間違っている場合か、CRSが何も設定されていない場合にのみ、この操作を行ってください。
利用可能なデータセット のフレームには、メッシュレイヤ内のすべてのデータセットグループ(とサブグループ)が、その種類や説明とともにツリービュー形式でリストされています。通常のデータセット(すなわちファイル内に保存されたデータ)と、仮想データセット( オンザフライで計算されたもの )の両方が表示されます。
 メッシュに追加データセットを割り当てる ボタンを使用すると、現在のメッシュレイヤにさらにデータグループを追加します。
 すべて折りたたむ と
  すべて展開する は、グループが埋め込まれている場合にデータセットのツリーを折りたたみ・展開します
一部のデータセットにしか興味がない場合、他のデータセットのチェックを外し、プロジェクト内で利用不可にできます。
グループ名をダブルクリックすると、データセットの名前を変更できます。
 デフォルトにリセット :グループのすべてにチェックを入れ、データ名をプロバイダの元の名前に戻します。
仮想データセットグループ上で右クリックすると、以下の操作が可能です:
プロジェクトから データセットグループを削除
データセットグループを別名で保存... :ディスク上のファイルにサポートする任意の形式で保存します。新しいファイルはプロジェクト内で現在のメッシュレイヤに割り当てられます。
 Treat as static dataset グループにチェックを入れると、メッシュレイヤのレンダリング時にマップの時系列ナビゲーションプロパティを無視できます。アクティブなデータセットグループ(
 データセット タブで選択されたグループ)のそれぞれについて、次の設定ができます:
none に設定:データセットグループは完全に表示されません
データセットを表示 :例えば、時間とは無関係な「地盤高」データセットに使用します
特定の日時を抽出:指定した時刻にマッチするデータセットをレンダリングし、マップの時系列ナビゲーション中はこれで固定します
17.3.3. シンボロジプロパティ
シンボロジ ボタンをクリックすると、ダイアログを有効化します。シンボロジのプロパティは、複数のタブに分かれています:
17.3.3.1. データセット
データセット タブはレイヤにどのデータセットを使用するかの制御や設定を行う中心的な場所です。以下のアイテムがあります:
グループ :メッシュデータセットで利用可能なグループと、以下のデータがあるかどうかを表示します:
 スカラデータセット
 ベクタデータセット:デフォルトでは、各ベクタデータセットは自動的に生成されたベクタの大きさを表すスカラデータセットを持ちます
データセット名の横にあるアイコンをクリックすると、表示するデータのグループとタイプの選択ができます。
選択データセットグループのメタデータ は、以下についての詳細を表示します:
メッシュ型:辺または面
データタイプ:頂点、辺、面またはボリューム
ベクトル型かどうか
メッシュレイヤのオリジナルの名前
単位(あれば)
選択したデータセットに対する 混合モード が利用可能です。
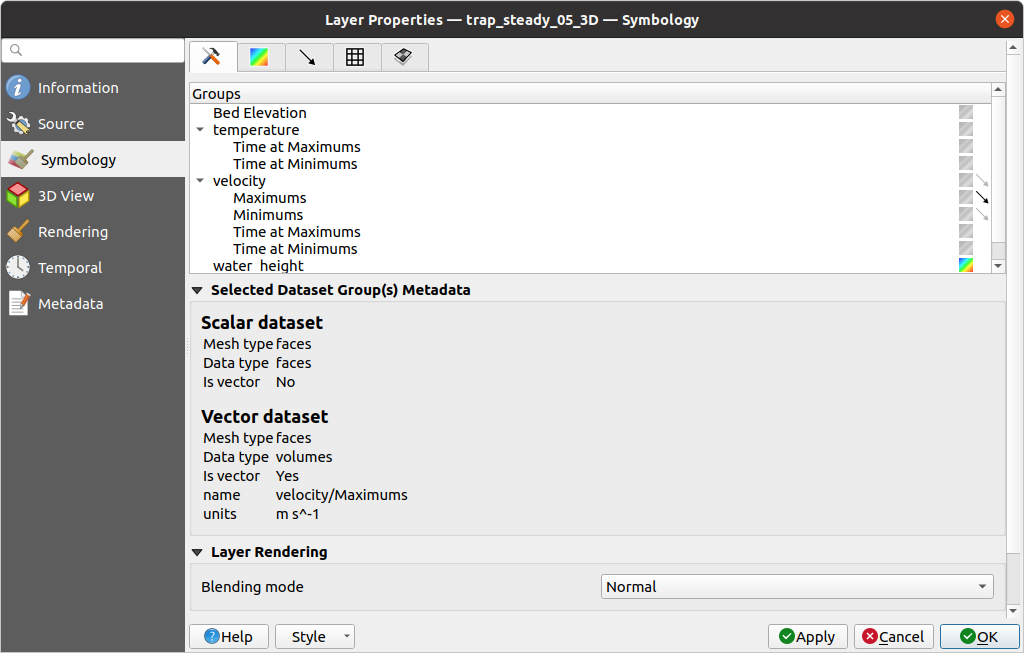
図 17.6 メッシュレイヤのデータセット
選択したベクトルやスカラーのグループには、次のタブを使用してシンボロジを適用できます。
17.3.3.2. 等高線シンボロジ
注釈
 等高線(Contours) タブは、 データセット タブでスカラーデータセットが選択されている場合にのみ、有効化することができます。
等高線(Contours) タブでは、以下の 図 17.7 に示すように、選択したグループに対するコンター表示の現在の可視化オプションの確認と変更ができます。
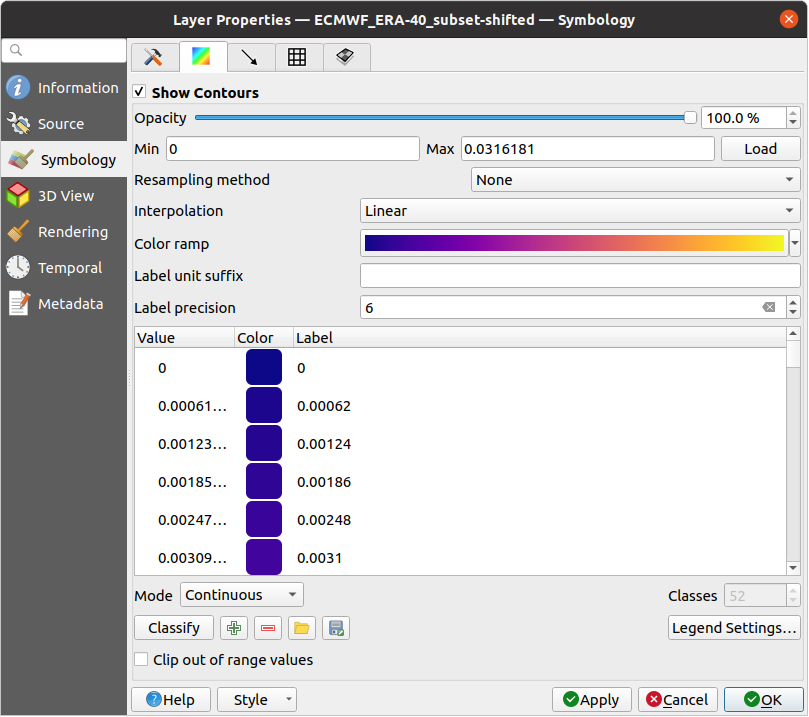
図 17.7 メッシュレイヤのコンタースタイルの設定
1Dのメッシュに対しては、辺の ストローク幅 の設定があります。ストローク幅はデータセット全体で一定のサイズとすることも、ジオメトリに沿って変化させる(詳細は 補間された線のレンダラー を参照)こともできます。
2Dメッシュタイプの場合は、スライダーやスピンボックスを使用して現在のグループの 不透明度 が設定できます。
現在のグループで表現したい値の範囲を入力します。
読み込み ボタンを使用して現在のグループの最小値と最大値を取得できますが、範囲の一部を除外したい場合には自身で値を入力してください。2D / 3Dメッシュの場合、 リサンプリング方法 で 隣接平均 を使用すると、周囲の頂点の値を面に(あるいは周囲の面から頂点に)補間できます。データセットが頂点で定義されているか(あるいは面で定義されているか)に応じて、QGISはこの設定を なし (面定義の場合は 隣接平均 )にデフォルトで設定することで、頂点上の値を使用してデフォルトのレンダリングが滑らかになるようにします。
カラーランプシェーダ のクラス分類を使用して、データセットをクラス分けできます。
17.3.3.3. ベクタシンボロジ
注釈
 ベクタ タブは、 データセット タブでベクトルデータセットが選択されている場合にのみ、有効化することができます。
ベクタ タブでは、 図 17.8 に示すように、選択したグループに対するベクトル表示の現在の可視化オプションの確認と変更ができます。
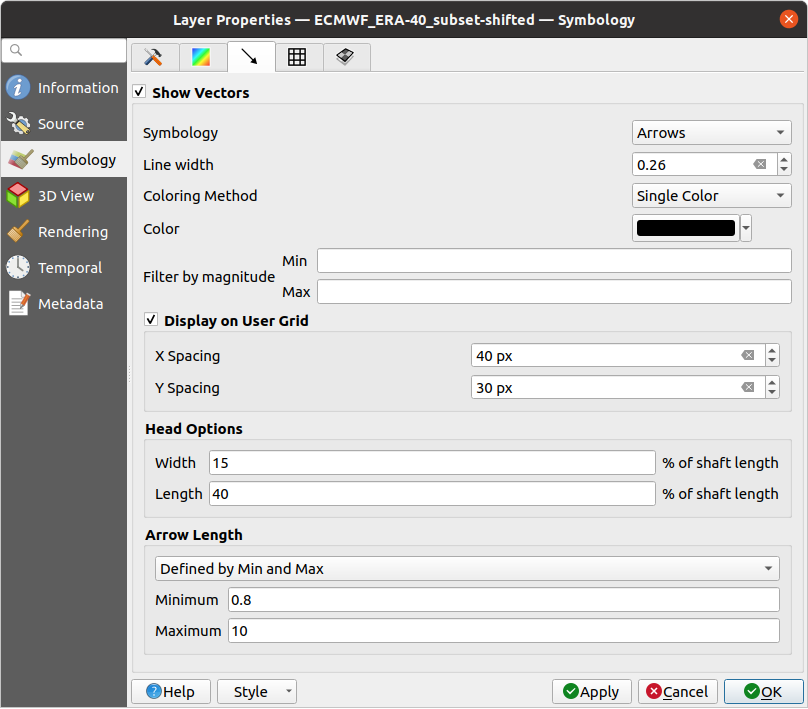
図 17.8 矢印を使用したメッシュレイヤのベクトルスタイルの設定
メッシュのベクタデータセットは、さまざまな種類の シンボロジ を使用してスタイル設定ができます:
矢印 :ベクトルは、生のデータセットでの定義位置(つまり、ノード上または要素の中心)と同じ位置、またはユーザー定義のグリッド上(したがって、均等に分布します)に矢印で表現されます。矢印の長さは生データで定義されている矢印の大きさに比例しますが、さまざまな方法でスケーリングできます。
流線 :ベクトルは開始点から発生する流線で表現されます。流線の発生点はメッシュの頂点やユーザー定義のグリッド、あるいはランダムとすることができます。
トレース :流線のより良いアニメーションです。これは、水中にランダムに砂(トレーサー)を投げ入れ、それがどのように流れるかを見るような効果が得られます。
以下の表に示すように、利用可能なプロパティは選択したシンボロジによって異なります。
ラベル |
説明とプロパティ |
矢印 |
流線 |
トレース |
|---|---|---|---|---|
線幅 |
ベクトルを表現するシンボルの幅 |
|
|
|
色付け方法 |
|
|
|
|
大きさでフィルタリング |
選択したデータセットのうち、大きさが 最小値(Min) から 最大値(Max) の範囲内にあるベクトルのみを表示する |
|
|
|
グリッド上に表示 |
X方向の間隔 と Y方向の間隔 によるユーザー定義のグリッド上にベクトルを配置する。ベクトルの大きさは近傍の値から内挿される |
|
|
|
ヘッドオプション |
矢印のヘッドの 長さ と 幅 を、矢印の軸の長さに対する百分率で指定する |
|
||
矢印の長さ |
|
|
||
流線シード法 |
|
|
||
パーティクルの数 |
可視化のために投入したい「砂(トレーサー)」の量 |
|
||
最大テール長 |
パーティクルが消えるまでの時間 |
|
17.3.3.4. レンダリング
 レンダリング タブには、QGISが提供するメッシュ構造の表示とカスタマイズの機能があります。表示のための 線幅 と 線の色 を設定できます:
1Dメッシュの辺
2Dメッシュの場合:
ネイティブメッシュレンダリング :レイヤのオリジナルの面と辺を表示する
三角メッシュレンダリング :辺を追加して、面を三角形として表示する
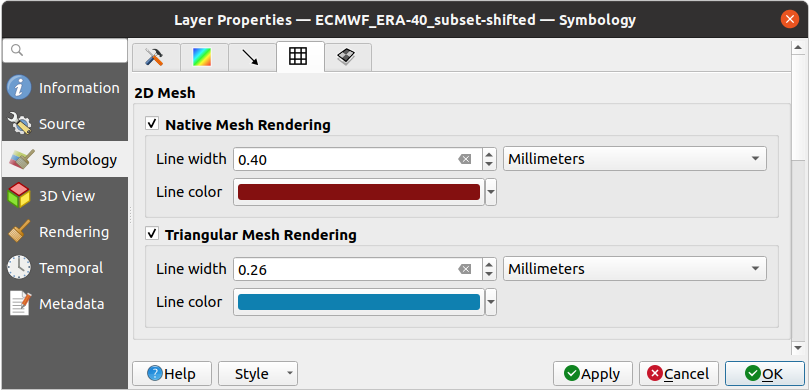
図 17.9 2Dメッシュのレンダリング
17.3.3.5. 多層メッシュ平均化法
3Dレイヤードメッシュは、2D非構造メッシュを垂直座標によって垂直方向( レベル )に押し出したものが複数積み重なったもので構成されます。頂点と面は、各垂直レベルで同じトポロジーを持ちます。値は通常、ベースとなる2Dメッシュの上に規則的に積み重ねられたボリュームに保存されます。2Dキャンバス上でこれを可視化するためには、ボリューム(3D)の値をメッシュレイヤで表示可能な面(2D)上の値に変換する必要があります。  多層メッシュ平均化法(Stacked mesh averaging method) は、これを処理するためのさまざまな平均化 / 補間方法を提供します。
2Dのデータセットを導出するための方法と、それに対応するパラメータ(レベルインデックス、深度、標高など)を選択できます。各方法について、ダイアログに適用例が示されていますが、詳細については https://fvwiki.tuflow.com/index.php?title=Depth_Averaging_Results にあります。
17.3.4. 3Dビュープロパティ
メッシュレイヤは頂点のZ値に基づいて 3Dマップビューの地形 としても使用できます。  3Dビュー プロパティタブから、メッシュレイヤのデータセットを同じ3Dビューでレンダリングすることもできます。従って、頂点の鉛直成分はデータセット値(例えば水面の標高)と等しいように設定することができ、メッシュのテクスチャは他のデータセット値(例えば速度)をカラーランプシェーダでレンダリングするように設定できます。
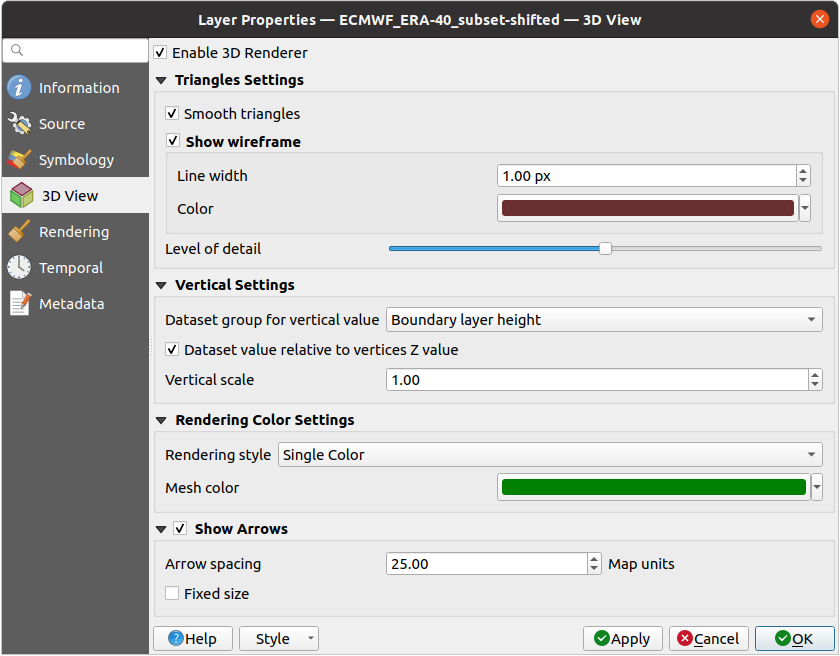
図 17.10 メッシュデータセットの3Dプロパティ
 3Dレンダラを有効にする にチェックを入れると、以下のプロパティを編集できます:
三角形設定 では、
スムース三角形 :3Dレンダリングを改善するため、隣接する三角形の間の角をスムージングする
ワイヤフレームを表示 : 線幅 と 色 を設定可能
詳細水準(Level of detail) :レンダリングするメッシュレイヤをどれだけ 簡素化 するかを制御します。スライダーの右端は元のメッシュで、左に行くほどメッシュレイヤは簡略化され、ディテールがより少なくなります。このオプションは、 レンダリング タブで メッシュの簡素化 オプションを有効にした場合のみ利用可能です。
- 垂直設定 は、垂直成分のふるまいを制御します。
レンダリングされる三角形の頂点について、
垂直方向のデータセットグループ :メッシュの垂直成分に使用するデータセットグループ
- Z値に対する相対値 :データセットの値を絶対Z座標とみなすか、または頂点のネイティブなZ値からの相対座標とみなすか
鉛直スケール :データセットのZ値に適用するスケーリング係数
レンダリング色設定 : レンダリングスタイル は、 等高線シンボロジ で設定したカラーランプシェーダ( 2D等高線カラーランプシェーダ )に基づく色、または、 メッシュの色 に関連付けられた 単一色
矢印を表示 : ベクトルの2Dレンダリング で使用されるデータセットグループと同じデータセットに基づいて、メッシュレイヤデータセットの3Dエンティティ上に矢印を表示します。矢印は2Dの色設定を使って表示されます。また、 矢印の間隔 の定義や、 固定サイズ とするか大きさでスケーリングするかを定義できます。矢印は重なり合うことができないため、この矢印の間隔設定は矢印の最大サイズも定義します。
17.3.5. レンダリングプロパティ
メッシュレイヤは数百万の面を持つことがあるため、レンダリングには非常に時間がかかることがあります。これは特に、面が小さすぎて表示はできないものの、全ての面がビュー内にある場合に顕著です。レンダリングを高速化するためにメッシュレイヤを簡素化すると、さまざまな 詳細水準(level of detail) を表す1つまたは複数のメッシュが生成され、QGISにどの詳細水準のメッシュレイヤをレンダリングさせるかを選択できます。簡素化されたメッシュは三角形の面のみとなることに留意してください。
 レンダリング タブで メッシュの簡素化 にチェックを入れると、以下が設定できます:
削減係数 :簡素化されたメッシュの連続するレベルの生成を制御します。例えば、ベースメッシュに5百万個の面があり、削減係数が10の場合、最初の簡素化されたメッシュはおよそ500,000個の面、2番目は50,000個の面、3番目は5000個の面、といった具合になります。削減係数が大きいほどより単純なメッシュ(つまり、より大きなサイズの三角形)に早く到達し、詳細水準の数も少なくなります。
最小三角形サイズ :表示が許可される三角形の平均サイズ(ピクセル単位)です。メッシュの平均サイズがこの値よりも小さい場合には、より低い詳細水準のメッシュのレンダリングに切り替わります。
17.3.6. 時系列プロパティ
 時系列 タブは、時間経過に伴うレイヤのレンダリングを制御するオプションを提供します。これは、有効化されたデータセットグループの時系列値を動的に表示できるようになります。このような動的なレンダリングには、マップキャンバスで 時系列ナビ を有効にする必要があります。
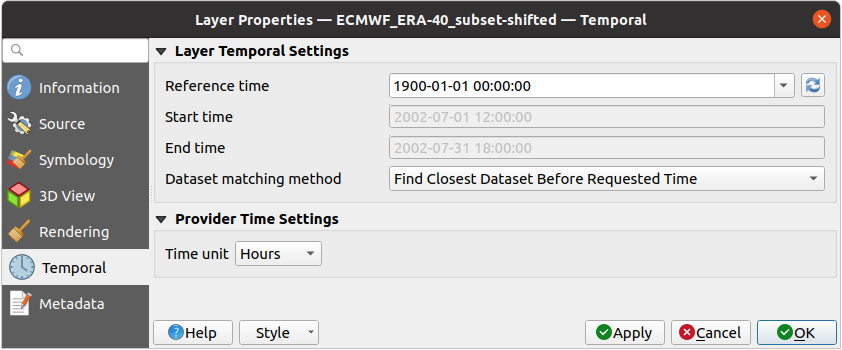
図 17.11 メッシュの時系列プロパティ
レイヤ時間設定
参照時間 は、データセットグループの絶対的な日時としての基準です。デフォルトでは、QGISはソースレイヤを解析し、レイヤのデータセットグループ内の最初の有効な参照時間を返します。これが利用できない場合は、この値はプロジェクトの時間範囲によって設定されるか、現在の日付にフォールバックされます。考慮すべき 開始時刻 と 終了時刻 は、データセット内部のタイムスタンプのステップに基づいて計算されます。
カスタムの 参照時間 (と時間範囲)を設定することができ、変更は
プロバイダから再読み込み ボタンを使用して元に戻すことができます。データセット検索方法 :指定された時間に表示するデータセットを決定します。選択肢は、 時間内に最も近いデータセットを見つける と 時間内に最も近いデータセットを見つける(前後) の2つです。
プロバイダ時間設定
時間単位 は、元データから抽出されるか、ユーザーが定義します。この値は、マップの時系列ナビゲーションの際に、メッシュレイヤの速度をプロジェクト内の他のレイヤと揃えるために使用されます。サポートしている単位は、 秒 、 分 、 時 、および 日 です。
17.3.7. メタデータプロパティ
 メタデータ タブには、レイヤに関するメタデータレポートの作成・編集オプションがあります。詳細は メタデータ を参照してください。
17.4. Editing a mesh layer
QGIS allows to create a mesh layer from scratch or based on an existing one. You can create/modify the geometries of the new layer whom you can assign datasets afterwards. It's also possible to edit an existing mesh layer. Because the editing operation requires a frames-only layer, you will be asked to either remove any associated datasets first (make sure you have them available if they still are necessary) or create a copy (only geometries) of the layer.
注釈
QGIS does not allow to digitize edges on mesh layers. Only vertices and faces are mesh elements that can be created. Also not all supported mesh formats can be edited in QGIS (see permissions).
17.4.1. Overview of the mesh digitizing tools
To interact with or edit a base mesh layer element, following tools are available.
ラベル |
Purpose |
Location |
|---|---|---|
|
Access to save, rollback or cancel changes in all or selected layers simultaneously |
Digitizing toolbar |
|
Turn on/off the layer in edit mode |
Digitizing toolbar |
|
Save changes done to the layer |
Digitizing toolbar |
|
Undo the last change(s) - Ctrl+Z |
Digitizing toolbar |
|
Redo the last undone action(s) - Ctrl+Shift+Z |
Digitizing toolbar |
|
Turn on/off the Advanced Digitizing Panel |
Advanced Digitizing toolbar |
|
Recreate index and renumber the mesh elements for optimization |
Mesh menu |
|
Select/Create vertices and faces |
Mesh Digitizing toolbar |
|
Select vertices and faces overlapped by a drawn polygon |
Mesh Digitizing toolbar |
|
Select vertices and faces using an expression |
Mesh Digitizing toolbar |
|
Modify coordinates of a selection of vertices |
Mesh Digitizing toolbar |
|
Split faces and constrain Z value using a linear geometry |
Mesh Digitizing toolbar |


17.4.2. Exploring the Z value assignment logic
When a mesh layer is turned into edit mode, a Vertex Z value widget opens at the top right of the map canvas. By default, its value corresponds to the Default Z value set in tab. When there are selected vertices, the widget displays the average Z value of the selected vertices.
During editing, the Vertex Z value is assigned to new vertices.
It is also possible to set a custom value: edit the widget, press Enter
and you will override the default value and make use of this new value in
the digitizing process.
Click the  icon in the widget to reset its value to the Options
default value.
icon in the widget to reset its value to the Options
default value.
17.4.2.1. Rules of assignment
When creating a new vertex, its Z value definition may vary depending on the active selection in the mesh layer and its location. The following table displays the various combinations.
Vertex creation |
Are there selected vertices in mesh layer? |
Source of assigned value |
Assigned Z Value |
|---|---|---|---|
"Free" vertex, not connected to any face or edge of a face |
No |
Vertex Z value |
Default or user defined |
Advanced
Digitizing Panel (if
z widget is in
|
z widget if in
|
||
Yes |
Vertex Z value |
Average of the selected vertices |
|
Vertex on an edge |
--- |
Mesh layer |
Interpolated from the edge's vertices |
Vertex on a face |
--- |
Mesh layer |
Interpolated from the face's vertices |
Vertex snapped to a 2D vector feature |
--- |
Vertex Z value |
Default or user defined |
Vertex snapped to a 3D vector vertex |
--- |
Vector layer |
Vertex |
Vertex snapped to a 3D vector segment |
--- |
Vector layer |
Interpolated along the vector segment |

注釈
The Vertex Z value widget is deactivated if the Advanced Digitizing Panel is enabled and no mesh element is selected. The latter's z widget then rules the Z value assignment.
17.4.2.2. Modifying Z value of existing vertices
To modify the Z value of vertices, the most straightforward way is:
Select one or many vertices. The Vertex Z value widget will display the average height of the selection.
Change the value in the widget.
Press Enter. The entered value is assigned to the vertices and becomes the default value of next vertices.
Another way to change the Z value of a vertex is to move and snap it on a vector layer feature with the Z value capability. If more than one vertex are selected, the Z value can't be changed in this way.
The Transform mesh vertices dialog also provides means to modify the Z value of a selection of vertices (along with their X or Y coordinates).
17.4.3. Selecting mesh elements
17.4.3.1. Using Digitize Mesh Elements
Activate the  Digitize Mesh Elements tool.
Hover over an element and it gets highlighted, allowing you to select it.
Digitize Mesh Elements tool.
Hover over an element and it gets highlighted, allowing you to select it.
Click on a vertex, and it is selected.
Click on the small square at the center of a face or an edge, and it gets selected. Connected vertices are also selected. Conversely, selecting all the vertices of an edge or a face also selects that element.
Drag a rectangle to select overlapping elements (a selected face comes with all their vertices). Press Alt key if you want to select only completely contained elements.
To add elements to a selection, press Shift while selecting them.
To remove an element from the selection, press Ctrl and reselect it. A deselected face will also deselect all their vertices.
17.4.3.2. Using Select Mesh Elements by Polygon
Activate the  Select Mesh Elements by Polygon tool and:
Draw a polygon (left-click to add vertex, Backspace to undo last vertex, Esc to abort the polygon and right-click to validate it) over the mesh geometries. Any partially overlapping vertices and faces will get selected. Press Alt key while drawing if you want to select only completely contained elements.
Right-click over the geometry of a vector layer's feature, select it in the list that pops up and any partially overlapping vertices and faces of the mesh layer will get selected. Use Alt while drawing to select only completely contained elements.
To add elements to a selection, press Shift while selecting them.
To remove an element from the selection, press Ctrl while drawing over the selection polygon.
17.4.3.3. Using Select Mesh Elements by Expression
Another tool for mesh elements selection is  Select Mesh Elements by Expression. When pressed, the tool opens the mesh
expression selector dialog from which you can:
Select Mesh Elements by Expression. When pressed, the tool opens the mesh
expression selector dialog from which you can:
Select the method of selection:
Select by vertices: applies the entered expression to vertices, and returns matching ones and their eventually associated edges/faces
Select by faces: applies the entered expression to faces, and returns matching ones and their associated edges/vertices
Write the expression of selection. Depending on the selected method, available functions in the Meshes group will be filtered accordingly.
Run the query by setting how the selection should behave and pressing:
 Select: replaces any existing selection
in the layer
Select: replaces any existing selection
in the layer Add to current selection
 Remove from current selection
17.4.4. Modifying mesh elements
17.4.4.1. Adding vertices
To add vertices to a mesh layer:
Press the
Digitize mesh elements buttonA Vertex Z value widget appears on the top right corner of the map canvas. Set this value to the Z coordinate you would like to assign to the subsequent vertices
Then double-click:
outside a face: adds a "free vertex", that is a vertex not linked to any face. This vertex is represented by a red dot when the layer is in editing mode.
on the edge of existing face(s): adds a vertex on the edge, splits the face(s) into triangles connected to the new vertex
inside a face: splits the face into triangles whose edges connect the surrounding vertices to the new vertex.
17.4.4.2. Adding faces
To add faces to a mesh layer:
Press the
Digitize mesh elements buttonA Vertex Z value widget appears on the top right corner of the map canvas. Set this value to the Z coordinate you would like to assign to the subsequent vertices.
Double-click to add a first vertex or move the cursor next to a vertex.
Click the small triangle that appears next to the vertex and move the cursor to the next vertex position; you can snap to existing vertex or double-click to add a new one.
Proceed as above to add as many vertices you wish for the face. Press Backspace button to undo the last vertex.
While moving the mouse, a rubberband showing the shape of the face is displayed. If it is shown in green, then the expected face is valid and you can right-click to add it to the mesh. If in red, the face is not valid (e.g. because it self-intersects, overlaps an existing face or vertex, ...) and can't be added. You'd need to fix the geometry.
Press Esc to abort the face digitizing.
Right-click to validate the face.
17.4.4.3. Removing mesh elements
Enable the
Digitize mesh elements toolRight-click and select:
Remove Selected Vertices and Fill Hole(s) or press Ctrl+Del: removes vertices and linked faces and fills the hole(s) by triangulating from the neighbor vertices
Remove Selected Vertices Without Filling Hole(s) or press Ctrl+Shift+Del: removes vertices and linked faces and do not fill hole(s)
Remove Selected Face(s) or press Shift+Del: removes faces but keeps the vertices
These options are also accessible from the contextual menu when hovering over a single item without selecting.
17.4.4.4. Moving mesh elements
To move vertices and faces of a mesh layer:
Enable the
Digitize mesh elements toolTo start moving the element, click on a vertex or the centroid of a face/edge
Move the cursor to the target location (snapping to vector features is supported).
If the new location does not generate an invalid mesh, the moved elements appear in green. Click again to release them at this location. Faces whose vertices are all selected are translated, their neighbors are reshaped accordingly.
17.4.4.5. Transforming mesh vertices
The  Transform Vertices Coordinates tool gives
a more advanced way to move vertices, by editing their X, Y and/or Z coordinates
thanks to expressions.
Transform Vertices Coordinates tool gives
a more advanced way to move vertices, by editing their X, Y and/or Z coordinates
thanks to expressions.
Select the vertices you want to edit the coordinates
Press
Transform Vertices Coordinates.
A dialog opens with a mention of the number of selected vertices.
You can still add or remove vertices from the selection.Depending on the properties you want to modify, you need to check the X coordinate, Y coordinate and/or Z value.
Then enter the target position in the box, either as a numeric value or an expression (using the
 Expression dialog)
With the
 Import Coordinates of the Selected Vertex
pressed, the X, Y and Z boxes are automatically filled with its coordinates
whenever a single vertex is selected. A convenient and quick way to adjust
vertices individually.
Import Coordinates of the Selected Vertex
pressed, the X, Y and Z boxes are automatically filled with its coordinates
whenever a single vertex is selected. A convenient and quick way to adjust
vertices individually.Press Preview Transform to simulate the vertices new location and preview the mesh with transformation.
If the preview is green, transformed mesh is valid and you can apply the transformation.
If the preview is red, the transformed mesh is invalid and you can not apply the transformation until it is corrected.
Press Apply Transform to modify the selected coordinates for the set of vertices.
17.4.4.6. Reshaping mesh geometry
The contextual menu
Enable the
Digitize mesh elementsSelect mesh item(s), or not
Hover over a mesh element, it gets highlighted.
Right-click and you can:
Split Selected Face(s) (Split Current Face): splits the face you are hovering over or each selected quad mesh faces into two triangles
Delaunay Triangulation with Selected vertices: builds triangular faces using selected free vertices.
Refine Selected Face(s) (Refine Current Face): splits the face into four faces, based on vertices added at the middle of each edge (a triangle results into triangles, a quad into quads). Also triangulates adjacent faces connected to the new vertices.
The edge markers
When the Digitize mesh elements is active and you hover
over an edge, the edge is highlighted and it is possible to interact with it.
Depending on the context, following markers may be available:
a square, at the center of the edge: click on it to select extremity vertices.
a cross if the two faces on either side can be merged: click on it to delete the edge and merge the faces.
a circle if the edge is between two triangles: Click on it to flip the edge, i.e. connect it instead to the two other "free" vertices of the faces
The Force by Selected Geometries tool
The  Force by Selected Geometries tool
provides advanced ways to apply break lines using lines geometry.
A break line will force the mesh to have edges along the line. Note that
the break line will not be considered persistent once the operation is done;
resulting edges will not act as constraints anymore and can be modified like
any other edge.
This can be used for example to locally modify a mesh layer with accurate
lines, as river banks or border of road embankments.
Force by Selected Geometries tool
provides advanced ways to apply break lines using lines geometry.
A break line will force the mesh to have edges along the line. Note that
the break line will not be considered persistent once the operation is done;
resulting edges will not act as constraints anymore and can be modified like
any other edge.
This can be used for example to locally modify a mesh layer with accurate
lines, as river banks or border of road embankments.
Enable the
Force by Selected Geometries toolIndicate the geometry to use as "forcing line"; it can be:
picked from a line or polygon feature in the map canvas: right-click over the vector feature and select it from the list in the contextual menu.
a virtual line drawn over the mesh frame: left-click to add vertices, right-click for validation. Vertices Z value is set through the Vertex Z value widget or the z widget if the Advanced Digitizing Panel is on. If the line is snapped to a mesh vertex or a 3D vector feature's vertex or segment, the new vertex takes the snapped element Z value.
Mesh faces that overlap the line geometry or the polygon's boundary will be
affected in a way that depends on options you can set from
the Force by Selected
Geometries tool drop-down menu:
- Add new vertex on intersecting edges: with this option,
a new vertex is added each time the forcing line intersect an edge. This option
leads to split along the line each encountered faces.
Without this option, encountered faces are removed and replaced by faces coming from a triangulation with only the existing vertices plus the vertices of the forcing lines (new vertices are also added on the boundary edge intersecting the forcing lines).
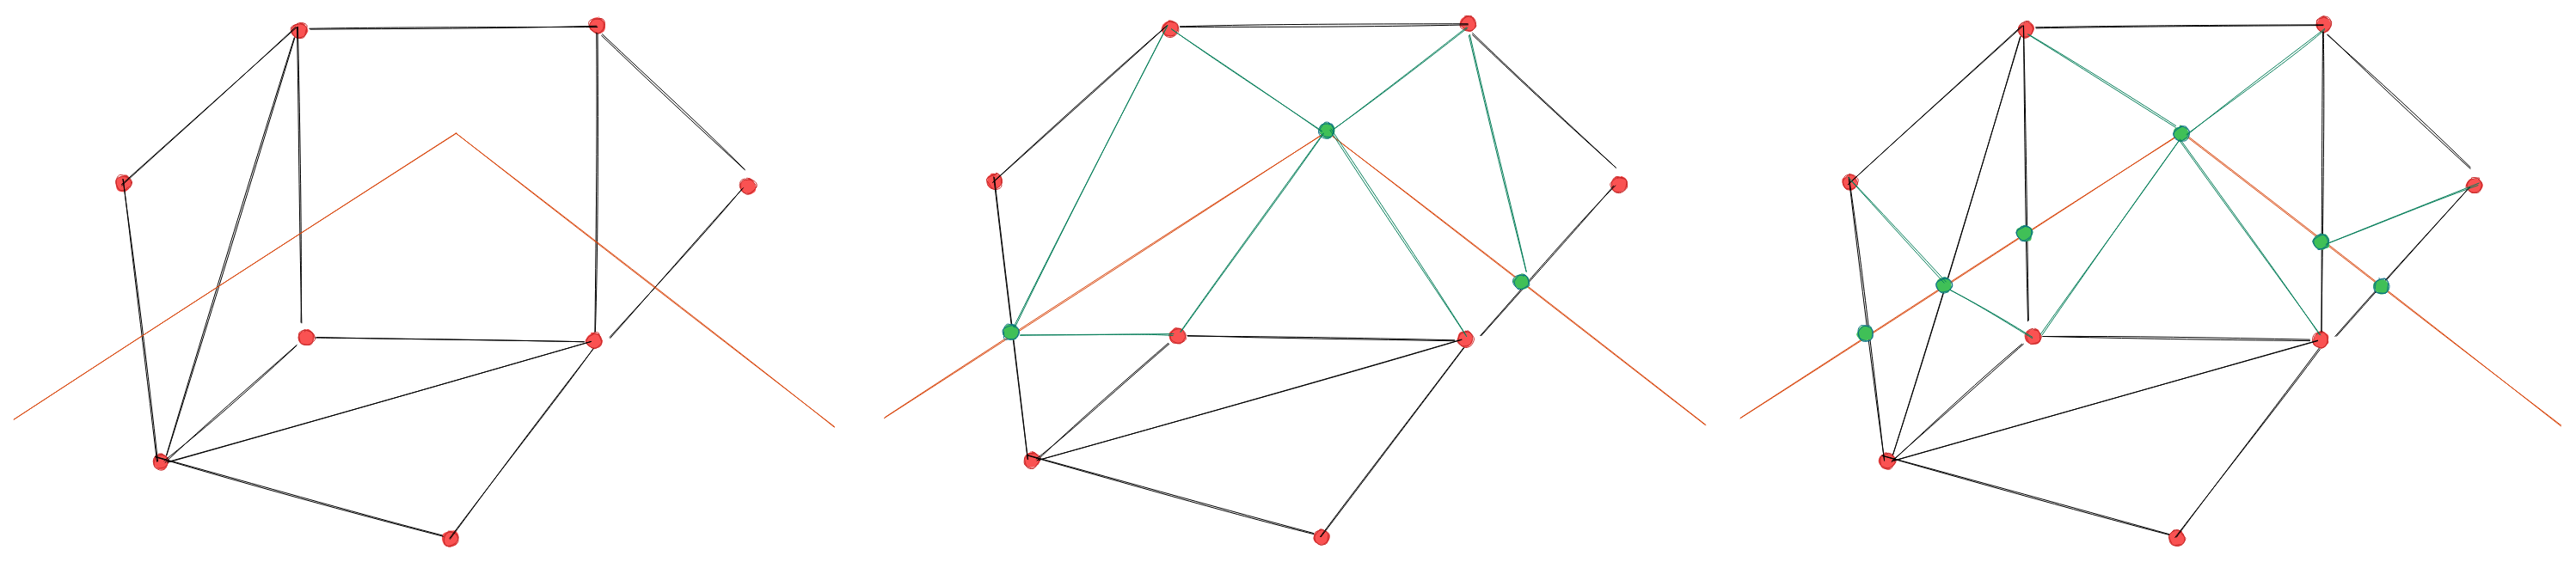
図 17.12 Force Mesh using a line geometry - Results without (middle) and with (right) new vertex on edges intersection
Interpolate Z value from: set how the new vertices Z value is calculated. It can be from:
the Mesh itself: the new vertices Z value is interpolated from vertices of the face they fall within
or the Forcing line: if the line is defined by a 3D vector feature or a drawn line then the new vertices Z value is derived from its geometry. In case of 2D line feature, the new vertices Z value is the Vertex Z value.
Tolerance: when an existing mesh vertex is closer to the line than the tolerance value, do not create new vertex on the line but use the existing vertex instead. The value can be set in Meters at Scale or in Map Units (more details at 単位セレクタ).
17.4.5. Reindexing meshes
During edit, and in order to allow quick undo/redo operations, QGIS keeps empty
places for deleted elements, which may lead to growing memory use and
inefficient mesh structuring.
The  tool is designed to remove these holes and renumber the indices of
faces and vertices so that they are continuous and somewhat reasonably ordered.
This optimizes relation between faces and vertices and increases the efficiency
of calculation.
tool is designed to remove these holes and renumber the indices of
faces and vertices so that they are continuous and somewhat reasonably ordered.
This optimizes relation between faces and vertices and increases the efficiency
of calculation.
注釈
The Reindex Faces and Vertices tool saves
the layer and clear the undo/redo stacks, disabling any rollback.
17.5. メッシュ計算機
メニューの先頭にある メッシュ計算機 ツールを使用すると、既存のデータセットグループに対して算術演算や論理演算を行い、新しいデータセットグループを生成できます( 図 17.13 参照)。
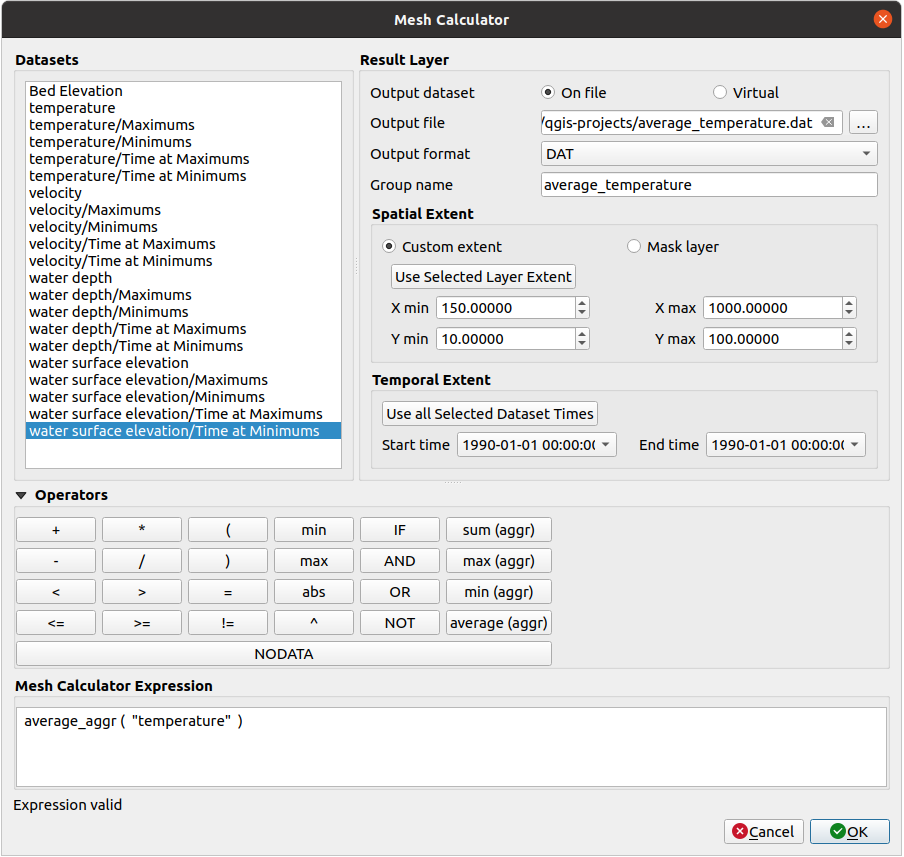
図 17.13 メッシュ計算機
データセット のリストには、アクティブなメッシュレイヤ内の全てのデータセットグループが含まれます。データセットグループを式で使用するには、リスト内でグループ名をダブルクリックします。すると、 メッシュ計算機の式 フィールドにグループが追加されます。続いて演算子ボタンを使用したりボックスに演算子を直接入力して、計算式を構築してください。
ラスタレイヤ では、出力レイヤのプロパティを設定できます:
- ディスクに書き込まないオンザフライ・ラスタを作成
これにチェックを入れない場合、出力結果は通常の新しいファイルとしてディスク上に保存されます。 出力ファイル のパスと、 出力形式 を指定する必要があります。
チェックを入れた場合、メッシュレイヤに新しいデータセットグループが追加されます。データセットグループの値はメモリには保存されておらず、各データセットはメッシュ計算機に入力された計算式で必要となった時に計算されます。この仮想のデータセットはプロジェクトに保存され、レイヤの ソース プロパティタブから必要に応じて削除したり、ファイルに永続化させたりすることができます。
どちらの場合でも、出力データセットグループの グループ名 を指定する必要があります。
空間範囲 は計算で考慮する範囲で、以下の設定があります:
カスタム範囲 :座標の X最小値 、 X最大値 、 Y最小値 、 Y最大値 を手動で入力するか、既存のデータセットグループから抽出します(範囲に使用したいデータセットをリストで選択し、 選択レイヤの領域を使用 ボタンを押すと上記の座標フィールドが入力されます)
プロジェクトのポリゴンレイヤによる定義( マスクレイヤ ):ポリゴン地物のジオメトリを使用してメッシュレイヤのデータセットを切り抜きます
時系列範囲 :データセットが考慮する時間範囲を 開始時刻 と 終了時刻 のオプションで設定します。これは、データセットグループの既存の時間ステップの中から選択します。また、 全ての選択データセット時間を使用 ボタンを押して、時間の全範囲を設定することもできます。
演算子 セクションには利用可能なすべての演算子があります。演算子をメッシュ計算機の式ボックスに追加するには、それに応じたボタンをクリックします。算術計算( + 、 - 、 * など)や統計関数( min 、 max 、 sum (aggr) 、 average (aggr) など)が利用できます。条件式( = 、 != 、 < 、 >= 、 IF 、 AND 、 NOT など)は、偽の場合は 0 、真の場合は 1 を返すので、他の演算子や関数と共に使うことができます。 NODATA 値も式中で使用できます。
メッシュ計算機の式 ウィジェットには実行する式が表示され、式を編集することができます。