17. 메시 데이터 작업
17.1. 메시란 무엇일까요?
메시(mesh)란 일반적으로 시계열 및 기타 요소들을 가지고 있는 비구조적 그리드를 말합니다. 공간 요소는 2차원 또는 3차원 공간에 있는 꼭짓점, 변(edge) 및 면(face)의 집합을 담고 있습니다:
꼭짓점: XY(Z) 포인트 (레이어 좌표계)
변: 연결된 두 꼭짓점
면: 면이란 닫힌 도형(closed shape)을 형성하는 경계의 집합을 말합니다. 일반적으로 삼각형 또는 사변형(quadrilateral)이며, 드물게 더 많은 꼭짓점을 가진 폴리곤도 면이 될 수 있습니다.
위의 정의에 따라서, 메시 레이어는 서로 다른 구조 유형들을 가질 수 있습니다:
1차원 메시: 꼭짓점 및 변으로 이루어집니다. 변이란 꼭짓점 두 개를 잇는 선분으로, (스칼라 또는 벡터) 데이터를 할당시킬 수 있습니다. 예를 들면 도시 하수 시스템 모델링에 1차원 메시 네트워크를 활용할 수 있습니다.
2차원 메시: 삼각면, 정규 사분면(regular quads) 또는 비구조적 사분면(unstructured quads)으로 이루어집니다.
3차원 레이어드 메시: 수직 좌표를 통해 수직 방향(수준)으로 각각 압출(extrusion)된 2차원 비구조적 메시 여러 개의 층위로 이루어집니다. 각 수직 수준에서 꼭짓점과 면의 위상은 동일합니다. 메시 정의는 (수직 수준 압출은) 일반적으로 시간에 따라 변화할 수도 있습니다. 3차원 메시 데이터는 일반적으로 부피 중심 또는 어떤 파라미터 함수로 정의됩니다.
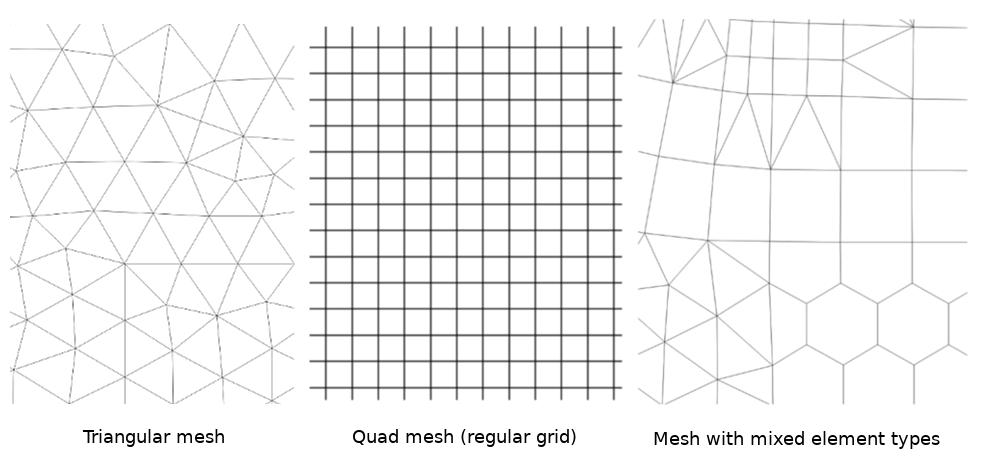
그림 17.1 서로 다른 메시 유형
메시는 공간 구조에 관한 정보를 제공합니다. 거기에 더해, 메시는 모든 꼭짓점에 값을 할당하는 데이터셋(그룹)을 보유할 수 있습니다. 예를 들면, 다음 그림처럼 번호가 붙은 꼭짓점을 가진 삼각형 메시의 경우:
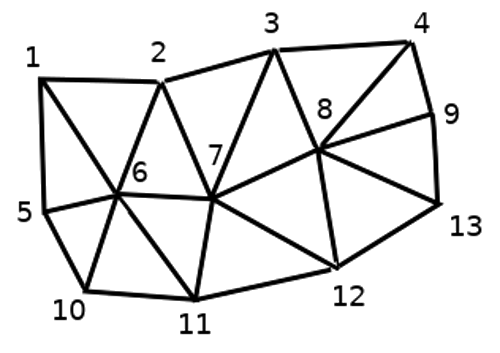
그림 17.2 번호가 붙은 꼭짓점을 가진 삼각형 그리드
각 꼭짓점이 서로 다른 (일반적으로 여러 수량의) 데이터셋을 저장할 수 있으며, 이 데이터셋들은 시계열 차원도 보유할 수 있습니다. 따라서 단일 파일이 여러 데이터셋을 담고 있을 수도 있습니다.
다음 테이블을 보면 메시 데이터셋에 어떤 데이터를 저장할 수 있는지 알 수 있습니다. 테이블 열은 메시 꼭짓점들의 인덱스를 나타내며, 각 행은 데이터셋 하나를 나타냅니다. 데이터셋은 서로 다른 데이터 유형들을 보유할 수 있습니다. 이 테이블의 경우, 특정 시간(t1, t2, t3)에 표고 10m에서 측정한 풍속을 저장하고 있습니다.
비슷한 방식으로, 메시 데이터셋이 각 꼭짓점에 벡터값도 저장할 수 있습니다. 예를 들어 지정한 타임 스탬프 순간의 풍향처럼 말이죠:
표고 10m 바람 |
1 |
2 |
3 |
… |
|---|---|---|---|---|
t1 시간의 표고 10m 풍속 |
17251 |
24918 |
32858 |
… |
t2시간의 표고 10m 풍속 |
19168 |
23001 |
36418 |
… |
t3 시간의 표고 10m 풍속 |
21085 |
30668 |
17251 |
… |
… |
… |
… |
… |
… |
t1 시간의 표고 10m 풍향 |
[20,2] |
[20,3] |
[20,4.5] |
… |
t2 시간의 표고 10m 풍향 |
[21,3] |
[21,4] |
[21,5.5] |
… |
t3 시간의 표고 10m 풍향 |
[22,4] |
[22,5] |
[22,6.5] |
… |
… |
… |
… |
… |
… |
값에 색상을 할당하고 (단일 밴드 의사색상 래스터 렌더링 작업과 비슷합니다) 메시 위상에 따라 꼭짓점 사이의 데이터를 보간해서 데이터를 가시화할 수 있습니다. 몇몇 수량이 단순 스칼라(scalar) 값이 아니라 2차원 벡터인 (예: 풍향) 경우도 흔합니다. 이런 수량의 경우 방향을 나타내는 화살표를 표시하는 편이 바람직합니다.
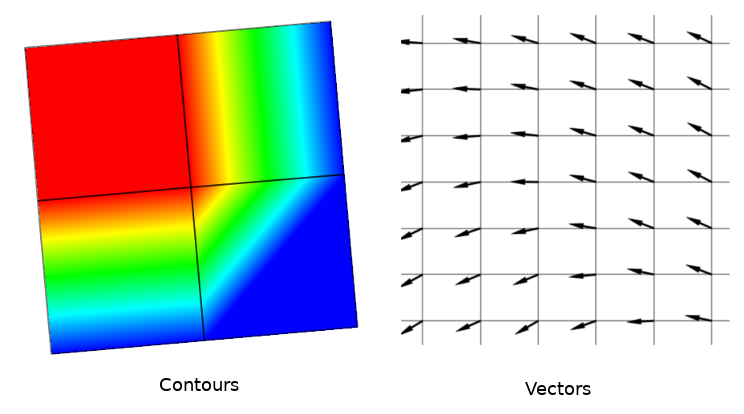
그림 17.3 메시 데이터를 가시화할 수 있는 방법들
17.2. 지원 포맷
QGIS는 MDAL 드라이버 를 이용해서 메시 데이터에 접근하기 때문에 다양한 포맷들 을 네이티브하게 지원합니다. QGIS가 메시 레이어를 편집할 수 있느냐 없느냐는 메시 포맷 및 구조 유형에 따라 달라집니다.
Data Source Manager 대화창에 있는  Mesh 탭을 통해 QGIS로 메시 데이터셋을 불러올 수 있습니다. 더 자세한 내용은 메시 레이어 불러오기 를 읽어보세요.
17.3. 메시 데이터셋 속성
메시 레이어의 Layer Properties 대화창은 레이어의 데이터셋 그룹과 각 그룹의 렌더링을 (활성 데이터셋 그룹, 심볼, 2차원 및 3차원 렌더링 등등을) 관리할 수 있는 일반 설정을 제공합니다. 또 레이어에 대한 정보를 제공하기도 합니다.
Layer Properties 대화창을 열려면:
Layers 패널에서 레이어를 더블 클릭하거나, 오른쪽 클릭한 다음 컨텍스트 메뉴에서 Properties… 를 선택하십시오.
레이어를 선택한 다음 메뉴를 클릭하십시오.
메시 Layer Properties 대화창은 다음 탭들로 이루어져 있습니다:
|
||
|
||
[1] 레이어 스타일 작업 패널 에서도 사용할 수 있습니다.
참고
대화창 하단에 있는 Style 메뉴를 이용해서 메시 레이어 속성 대부분을 .qml 파일로 저장하거나 .qml 파일로부터 불러올 수 있습니다. 자세한 내용은 사용자 지정 스타일 관리하기 를 참조하세요.
17.3.1. 정보 속성
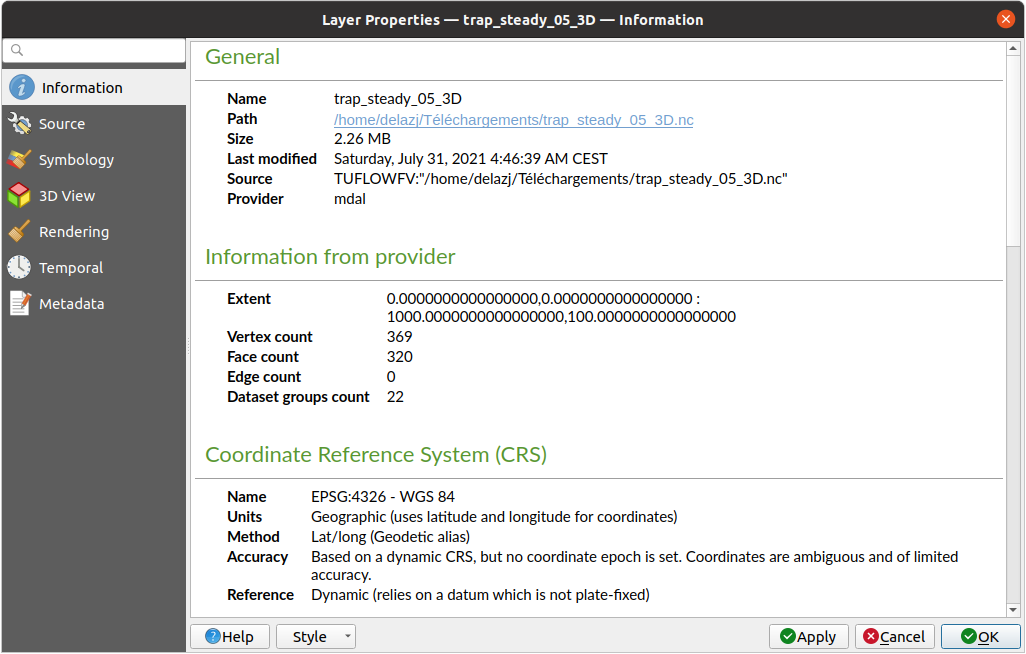
그림 17.4 메시 레이어 정보 속성
 Information 탭은 읽기 전용으로, 현재 레이어에 대한 요약 정보 및 메타데이터를 한 눈에 볼 수 있는 흥미로운 장소입니다. 다음과 같은 정보를 제공합니다:
프로젝트명, 소스 경로, 보조 파일 목록, 최신 저장 시간 및 용량, 사용 제공자 등의 일반 정보
해당 레이어의 제공자 기반: 범위, 꼭짓점, 면, 변 그리고/또는 데이터셋 그룹 개수
좌표계: 이름, 단위, 메소드, 정확도, 참조(예: 정적인지 동적인지 여부)
채워진 메타데이터 로부터 추출: 접근, 범위, 링크, 연락처, 이력, …
17.3.2. 소스 속성
 Source 탭은 선택한 메시에 대한 다음과 같은 기본 정보를 표시합니다:
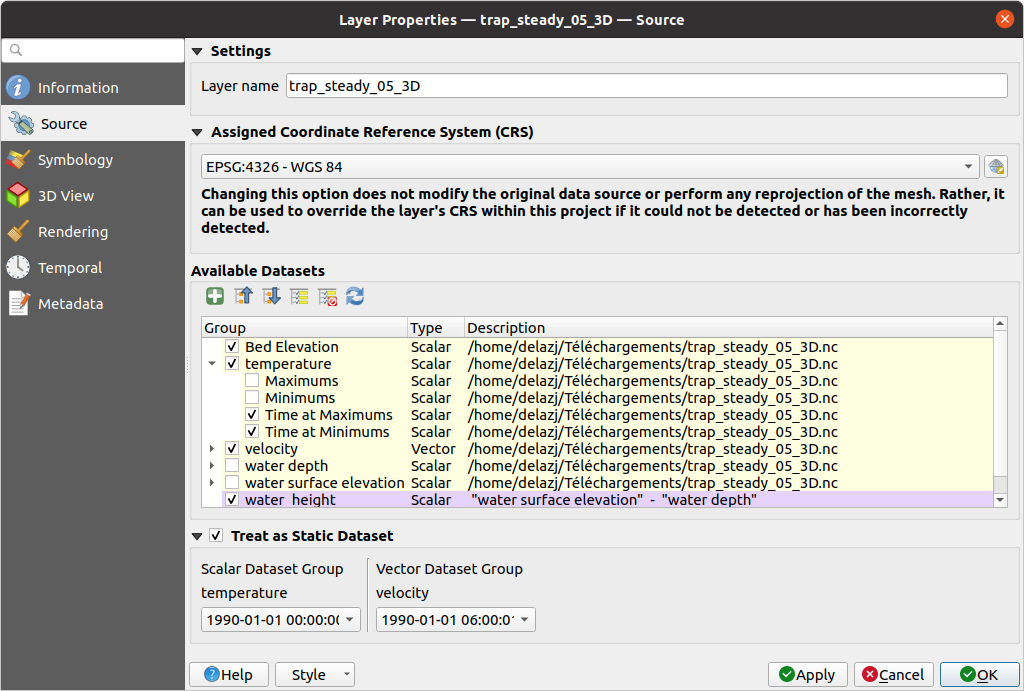
그림 17.5 메시 레이어 소스 속성
Layers 패널에 표시할 레이어명
좌표계 설정: 레이어에 할당된 좌표계 를 표시합니다. 드롭다운 목록에서 최근 사용된 좌표계를 선택하거나
 Select CRS 버튼을 (좌표계 선택기 참조) 클릭하면 레이어 좌표계를 변경할 수 있습니다. 레이어에 적용된 좌표계가 틀렸거나 적용된 좌표계가 없는 경우에만 변경하십시오.
Available datasets 프레임은 메시 레이어에 있는 모든 데이터셋 그룹(및 하위 그룹)들의 목록을 담고 있습니다. 트리 뷰에서 각 그룹의 유형 및 설명을 볼 수 있습니다. (예를 들어 파일에 데이터를 저장하는) 정규 데이터셋과 (실시간으로 계산되는) 가상 데이터셋 둘 다 목록화됩니다.
현재 메시 레이어에 더 많은 그룹을 추가하려면
 Assign extra dataset to mesh 버튼을 사용하십시오.
내장된 그룹들의 경우
 Collapse all 및
  Expand all 버튼으로 트리 뷰를 접거나 펼쳐보십시오.
관심을 가진 데이터셋이 몇 개 되지 않는다면 다른 데이터셋들을 체크 해제해서 프로젝트에서 사용할 수 없게 만들 수도 있습니다.
데이터셋 이름을 더블클릭하면 데이터셋을 재명명할 수 있습니다.
 Reset to defaults: 모든 그룹을 체크하고 제공자에 있는 원래 이름으로 되돌립니다.
가상 데이터셋 그룹을 오른쪽 클릭하면:
Remove dataset group: 프로젝트에서 해당 데이터셋 그룹을 제거할 수 있습니다.
Save dataset group as…: 해당 데이터셋 그룹을 디스크 상에 어떤 지원 포맷으로든 파일로 저장할 수 있습니다. 이 새 파일은 프로젝트에 있는 현재 메시 레이어에 할당된 채로 유지됩니다.
 Treat as static dataset 그룹을 체크하면 메시 레이어를 렌더링하는 동안 맵 시계열 탐색 속성을 무시할 수 있습니다. (
 Datasets 탭에서 선택한) 각 활성 데이터셋 그룹에 대해:
None 으로 설정하면 해당 데이터셋 그룹을 하나도 표시하지 않습니다.
예를 들어 시계열 데이터가 아닌 “지층 표고(bed elevation)”의 경우, Display dataset 으로 설정할 수 있습니다.
특정 날짜/시간을 추출할 수 있습니다: 지정한 시간과 일치하는 데이터셋을 렌더링해서 맵 탐색 동안 해당 시계열로 고정시킵니다.
17.3.3. 심볼 속성
Symbology 버튼을 클릭해서 심볼 대화창을 활성화시키십시오. 심볼 속성은 몇 개의 탭으로 나뉘어져 있습니다:
17.3.3.1. 데이터셋
Datasets 탭에서 레이어에 어떤 데이터셋을 사용할지 제어하고 설정합니다. 다음 항목들을 설정할 수 있습니다:
메시 데이터셋에서 사용할 수 있는 Groups 가 다음 가운데 어느 유형을 제공하는지:
 스칼라(scalar) 데이터셋
또는
 벡터 데이터셋: 기본적으로 각 벡터 데이터셋은 그 규모(magnitude)를 표현하는 스칼라 데이터셋 하나를 자동적으로 생성합니다.
데이터셋 이름 옆에 있는 아이콘을 클릭하면 표현할 그룹과 데이터 유형을 선택할 수 있습니다.
Selected dataset group(s) metadata 에서 다음과 같은 상세 정보를 볼 수 있습니다:
메시 유형: 변(edge) 또는 면(face)
데이터 유형: 꼭짓점, 변, 면 또는 부피
데이터셋 그룹이 벡터 유형인지 아닌지
메시 레이어에 있는 원래 이름
적용 가능한 경우, 단위
선택한 데이터셋에 사용할 수 있는 혼합 모드
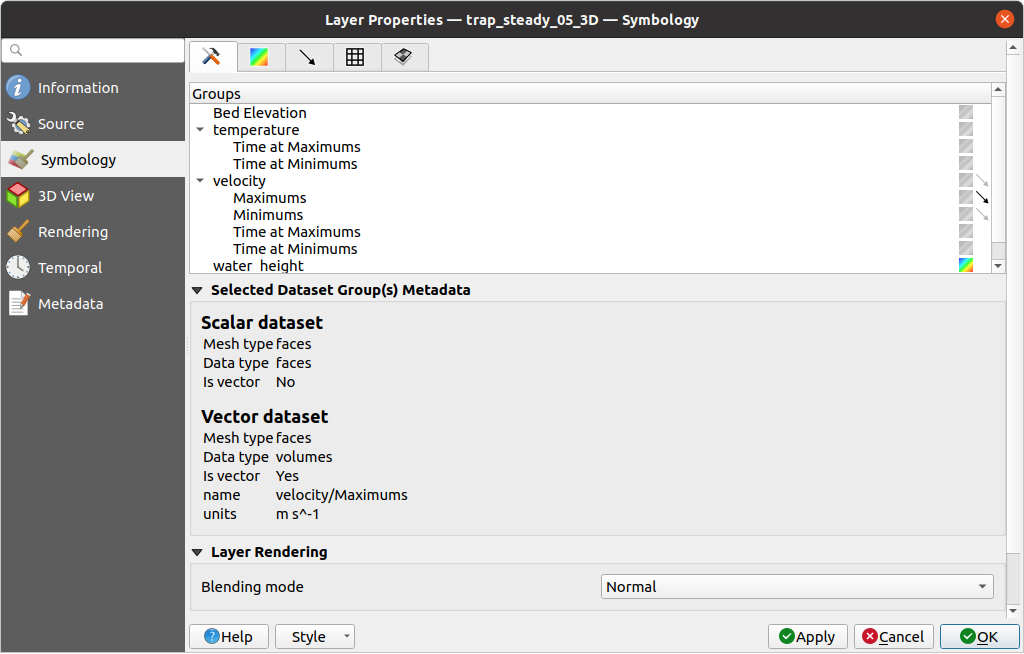
그림 17.6 메시 레이어 데이터셋
선택한 벡터 그리고/또는 스칼라 그룹에 다음 탭들을 이용해서 심볼을 적용할 수 있습니다.
17.3.3.2. 등고선 심볼
참고
 Contours 탭은 Datasets 탭에서 스칼라 데이터셋을 선택한 경우에만 활성화됩니다.
Contours 탭에서는 다음 그림 17.7 에서 볼 수 있듯이 선택한 그룹의 현재 등고선 시각화 옵션을 확인하고 변경할 수 있습니다:
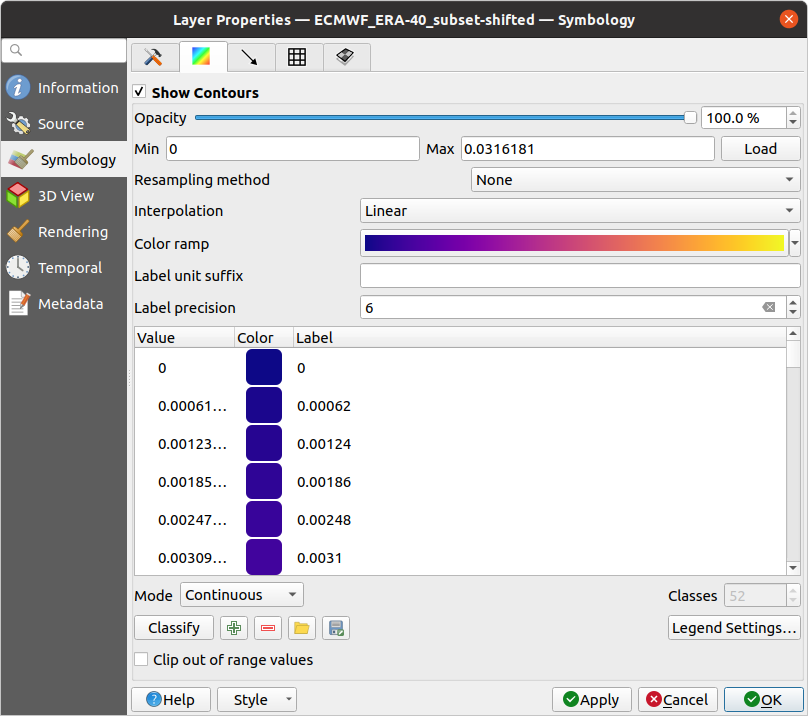
그림 17.7 메시 레이어에서 등고선 스타일 작업하기
1차원 메시의 경우, 변의 Stroke width 를 설정하십시오. 전체 데이터셋에 대해 고정 너비를 설정할 수도 있고, 아니면 도형에 따라 다른 너비를 설정할 수도 있습니다. (더 자세한 내용은 보간된 라인 렌더링 작업자 를 참조하세요.)
2차원 메시 유형의 경우, 슬라이드 바 또는 스핀박스를 사용해서 현재 그룹의 Opacity 를 설정할 수 있습니다.
사용자가 현재 그룹에 대해 표현하고자 하는 값의 범위를 입력하십시오: 현재 그룹의 최소/최대값을 가져오려면
Load 아이콘을 클릭하고, 어떤 범위를 제외하려면 사용자 지정 값을 입력하십시오.2차원/3차원 메시의 경우, Neighbour average 메소드를 이용해서 면들을 둘러싼 꼭짓점들에 대해 (또는 꼭짓점들을 둘러싼 면들로부터) 값을 보간하려면 Resampling method 를 선택하십시오. 데이터셋이 (면 각각에 대해) 꼭짓점들에 대해 정의되어 있는지에 따라, QGIS는 꼭짓점들에 대한 값을 이용해서 기본 렌더링을 매끄럽게 유지하기 위해 (각각 Neighbour average 인) None 메소드를 이 설정의 기본값으로 사용합니다.
색상표 셰이더(color ramp shader) 범주화를 이용해서 데이터셋을 범주화시키십시오.
17.3.3.3. 벡터 심볼
참고
Vectors 탭은 Datasets 탭에서 벡터 데이터셋을 선택한 경우에만 활성화됩니다.
Vectors 탭에서는 다음 그림 17.8 에서 볼 수 있듯이 선택한 그룹의 현재 벡터 시각화 옵션을 확인하고 변경할 수 있습니다:
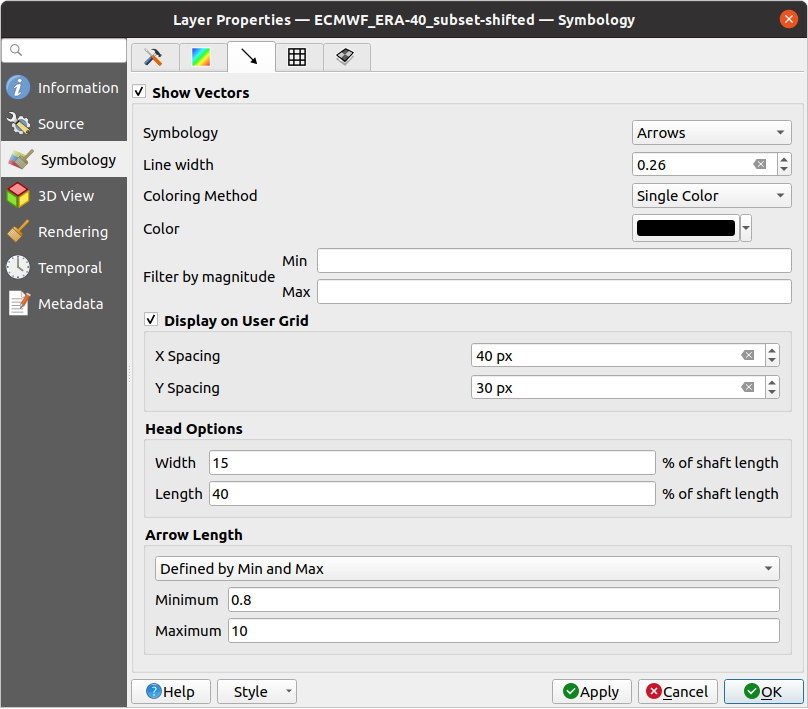
그림 17.8 메시 레이어에서 화살표로 벡터 스타일 작업하기
다양한 유형의 Symbology 를 이용해서 메시 벡터 데이터셋의 스타일을 작업할 수 있습니다:
화살표: 벡터가 원시 데이터셋에서 (예를 들어 노드에서 또는 요소의 중심에서) 또는 사용자 정의 그리드에서 (그러니까 균등하게 분포되어) 정의된 대로, 동일한 위치에서 벡터를 화살표로 표현할 수 있습니다. 화살표의 길이는 원시 데이터에 정의된 벡터 규모에 비례하지만, 다양한 메소드로 크기를 조정할 수 있습니다.
유선(流線; streamline): 벡터를 시작점(start point)에서 시작하는 유선으로 표현합니다. 이 시작점은 메시의 꼭짓점, 사용자 그리드, 또는 임의의 위치에서 시작할 수 있습니다.
추적(trace): 유선보다 더 보기 좋은 애니메이션입니다. 물 속에 모래알을 임의로 던진 다음 해당 모래가 어디로 떠내려 가는지를 확인하는 것과 비슷한 효과를 보여줍니다.
선택한 심볼에 따라 사용할 수 있는 속성은 다음 표와 같습니다.
라벨 |
설명 및 속성 |
화살표 |
유선 |
추적 |
|---|---|---|---|---|
Line width |
벡터 표현의 너비 |
|
|
|
Coloring method |
|
|
|
|
Filter by magnitude |
선택한 데이터셋에서 그 길이가 Min 과 Max 범위 사이에 떨어지는 벡터만 표시 |
|
|
|
Display on user grid |
그리드 상에 벡터를 사용자 지정 X spacing 및 Y spacing 으로 배치한 다음 벡터 길이를 이웃을 기반으로 보간 |
|
|
|
Head options |
Length 및 Width: 화살촉의 길이 및 너비를 화살대 길이의 백분율로 설정 |
|
||
Arrow length |
|
|
||
Streamlines seeding method |
|
|
||
Particles count |
사용자가 시각화에 던져 넣고자 하는 “모래”의 양 |
|
||
Max tail length |
입자가 사라질 때까지의 시간 |
|
17.3.3.4. 렌더링
QGIS는  Rendering 탭에서 메시 구조를 표시하고 사용자 지정할 수 있는 다양한 옵션을 제공합니다. 다음을 표현하기 위해 Line width 및 Line color 를 설정할 수 있습니다:
1차원 메시의 경우, 변(edge)
2차원 메시의 경우:
Native mesh rendering: 레이어로부터 원본 면과 변을 표시
Triangular mesh rendering: 더 많은 변을 추가해서 면을 삼각형으로 표시
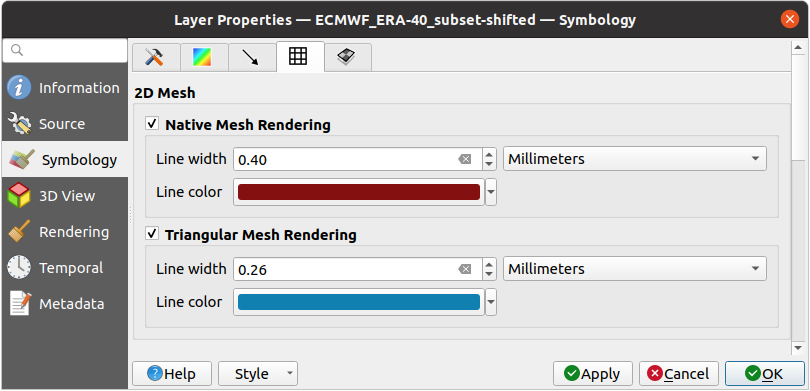
그림 17.9 2차원 메시 렌더링
17.3.3.5. 메시 스택 평균화 메소드
3D layered meshes consist of multiple stacked 2D unstructured meshes each
extruded in the vertical direction (levels) by means of a vertical
coordinate. The vertices and faces have the same topology in each vertical level.
Values are usually stored on the volumes that are regularly stacked over
base 2d mesh. In order to visualise them on 2D canvas, you need to convert
values on volumes (3d) to values on faces (2d) that can be shown in mesh layer.
The  Stacked mesh averaging method provides different
averaging/interpolation methods to handle this.
Stacked mesh averaging method provides different
averaging/interpolation methods to handle this.
You can select the method to derive the 2D datasets and corresponding parameters (level index, depth or height values). For each method, an example of application is shown in the dialog but you can read more on the methods at https://fvwiki.tuflow.com/index.php?title=Depth_Averaging_Results.
17.3.4. 3D View Properties
Mesh layers can be used as terrain in a 3D map view
based on their vertices Z values. From the  3D View properties tab,
it’s also possible to render the mesh layer’s dataset in the same 3D view.
Therefore, the vertical component of the vertices can be set equal to dataset
values (for example, level of water surface) and the texture of the mesh can
be set to render other dataset values with color shading (for example velocity).
3D View properties tab,
it’s also possible to render the mesh layer’s dataset in the same 3D view.
Therefore, the vertical component of the vertices can be set equal to dataset
values (for example, level of water surface) and the texture of the mesh can
be set to render other dataset values with color shading (for example velocity).
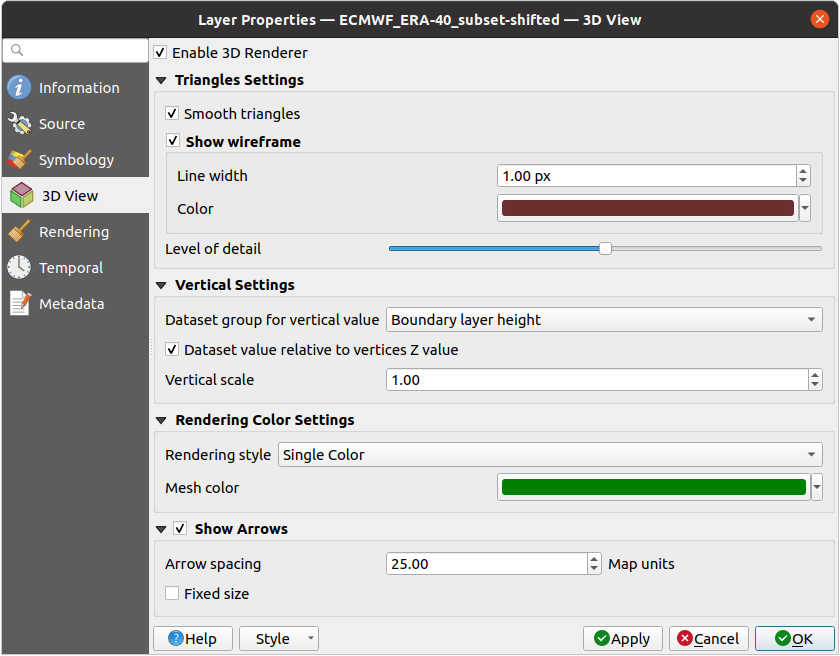
그림 17.10 Mesh dataset 3D properties
Check  Enable 3D Renderer and you can edit following
properties:
Enable 3D Renderer and you can edit following
properties:
Under Triangle settings
Smooth triangles: Angles between consecutive triangles are smoothed for a better 3D rendering
Show wireframe whose you can set the Line width and Color
Level of detail: Controls how simplified the mesh layer to render should be. On the far right, it is the base mesh, and the more you go left, the more the layer is simplified and is rendered with less details. This option is only available if the Simplify mesh option under the Rendering tab is activated.
- Vertical settings to control behavior of the vertical component
of vertices of rendered triangles
Dataset group for vertical value: the dataset group that will be used for the vertical component of the mesh
- Dataset value relative to vertices Z value: whether
to consider the dataset values as absolute Z coordinate or relative to
the vertices native Z value
Vertical scale: the scale factor to apply to the dataset Z values
Rendering color settings with a Rendering style that can be based on the color ramp shader set in 등고선 심볼 (2D contour color ramp shader) or as a Single color with an associated Mesh color
Show arrows: displays arrows on mesh layer dataset 3D entity, based on the same vector dataset group used in the vector 2D rendering. They are displayed using the 2D color setting. It’s also possible to define the Arrow spacing and, if it’s of a Fixed size or scaled on magnitude. This spacing setting defines also the max size of arrows because arrows can’t overlap.
17.3.5. Rendering Properties
As mesh layers can have millions of faces, their rendering can sometimes be very slow, especially when all the faces are displayed in the view whereas they are too small to be viewed. To speed up the rendering, you can simplify the mesh layer, resulting in one or more meshes representing different levels of detail and select at which level of detail you would like QGIS to render the mesh layer. Note that the simplify mesh contains only triangular faces.
From the  Rendering tab, check
Simplify mesh and set:
Rendering tab, check
Simplify mesh and set:
a Reduction factor: Controls generation of successive levels of simplified meshes. For example, if the base mesh has 5M faces, and the reduction factor is 10, the first simplified mesh will have approximately 500 000 faces, the second 50 000 faces, the third 5000,… If a higher reduction factor leads quickly to simpler meshes (i.e. with triangles of bigger size), it produces also fewer levels of detail.
Minimum triangle size: the average size (in pixels) of the triangles that is permitted to display. If the average size of the mesh is lesser than this value, the rendering of a lower level of details mesh is triggered.
17.3.6. Temporal Properties
The  Temporal tab provides options to control
the rendering of the layer over time. It allows to dynamically display
temporal values of the enabled dataset groups. Such a dynamic rendering
requires the temporal navigation to be enabled
over the map canvas.
Temporal tab provides options to control
the rendering of the layer over time. It allows to dynamically display
temporal values of the enabled dataset groups. Such a dynamic rendering
requires the temporal navigation to be enabled
over the map canvas.
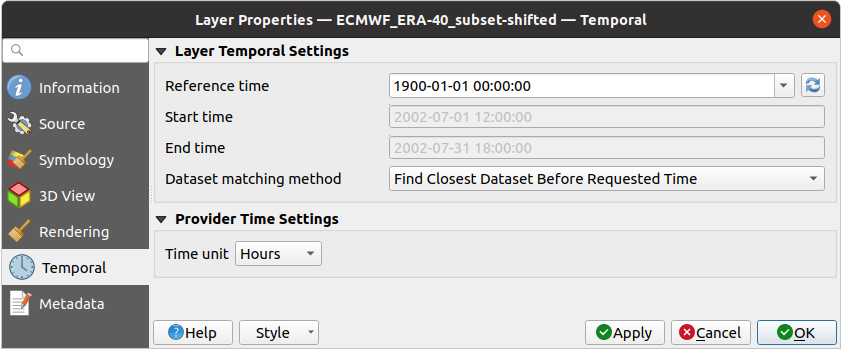
그림 17.11 Mesh Temporal properties
Layer temporal settings
Reference time of the dataset group, as an absolute date time. By default, QGIS parses the source layer and returns the first valid reference time in the layer’s dataset group. If unavailable, the value will be set by the project time range or fall back to the current date. The Start time and End time to consider are then calculated based on the internal timestamp step of the dataset.
It is possible to set a custom Reference time (and then the time range), and revert the changes using the
Reload from provider
button.Dataset matching method: determines the dataset to display at the given time. Options are Find closest dataset before requested time or Find closest dataset from requested time (after or before).
Provider time settings
Time unit extracted from the raw data, or user defined. This can be used to align the speed of the mesh layer with other layers in the project during map time navigation. Supported units are Seconds, Minutes, Hours and Days.
17.3.7. Metadata Properties
The  Metadata tab provides you with options
to create and edit a metadata report on your layer.
See Metadata for more information.
Metadata tab provides you with options
to create and edit a metadata report on your layer.
See Metadata for more information.
17.4. Editing a mesh layer
QGIS allows to create a mesh layer from scratch or based on an existing one. You can create/modify the geometries of the new layer whom you can assign datasets afterwards. It’s also possible to edit an existing mesh layer. Because the editing operation requires a frames-only layer, you will be asked to either remove any associated datasets first (make sure you have them available if they still are necessary) or create a copy (only geometries) of the layer.
참고
QGIS does not allow to digitize edges on mesh layers. Only vertices and faces are mesh elements that can be created. Also not all supported mesh formats can be edited in QGIS (see permissions).
17.4.1. Overview of the mesh digitizing tools
To interact with or edit a base mesh layer element, following tools are available.
라벨 |
Purpose |
Location |
|---|---|---|
|
Access to save, rollback or cancel changes in all or selected layers simultaneously |
Digitizing toolbar |
|
Turn on/off the layer in edit mode |
Digitizing toolbar |
|
Save changes done to the layer |
Digitizing toolbar |
|
Undo the last change(s) - Ctrl+Z |
Digitizing toolbar |
|
Redo the last undone action(s) - Ctrl+Shift+Z |
Digitizing toolbar |
|
Turn on/off the Advanced Digitizing Panel |
Advanced Digitizing toolbar |
|
Recreate index and renumber the mesh elements for optimization |
Mesh menu |
|
Select/Create vertices and faces |
Mesh Digitizing toolbar |
|
Select vertices and faces overlapped by a drawn polygon |
Mesh Digitizing toolbar |
|
Select vertices and faces using an expression |
Mesh Digitizing toolbar |
|
Modify coordinates of a selection of vertices |
Mesh Digitizing toolbar |
|
Split faces and constrain Z value using a linear geometry |
Mesh Digitizing toolbar |


17.4.2. Exploring the Z value assignment logic
When a mesh layer is turned into edit mode, a Vertex Z value widget opens at the top right of the map canvas. By default, its value corresponds to the Default Z value set in tab. When there are selected vertices, the widget displays the average Z value of the selected vertices.
During editing, the Vertex Z value is assigned to new vertices.
It is also possible to set a custom value: edit the widget, press Enter
and you will override the default value and make use of this new value in
the digitizing process.
Click the  icon in the widget to reset its value to the Options
default value.
icon in the widget to reset its value to the Options
default value.
17.4.2.1. Rules of assignment
When creating a new vertex, its Z value definition may vary depending on the active selection in the mesh layer and its location. The following table displays the various combinations.
Vertex creation |
Are there selected vertices in mesh layer? |
Source of assigned value |
Assigned Z Value |
|---|---|---|---|
“Free” vertex, not connected to any face or edge of a face |
No |
Vertex Z value |
Default or user defined |
Advanced
Digitizing Panel (if
z widget is in
|
z widget if in
|
||
Yes |
Vertex Z value |
Average of the selected vertices |
|
Vertex on an edge |
— |
Mesh layer |
Interpolated from the edge’s vertices |
Vertex on a face |
— |
Mesh layer |
Interpolated from the face’s vertices |
Vertex snapped to a 2D vector feature |
— |
Vertex Z value |
Default or user defined |
Vertex snapped to a 3D vector vertex |
— |
Vector layer |
Vertex |
Vertex snapped to a 3D vector segment |
— |
Vector layer |
Interpolated along the vector segment |

참고
The Vertex Z value widget is deactivated if the Advanced Digitizing Panel is enabled and no mesh element is selected. The latter’s z widget then rules the Z value assignment.
17.4.2.2. Modifying Z value of existing vertices
To modify the Z value of vertices, the most straightforward way is:
Select one or many vertices. The Vertex Z value widget will display the average height of the selection.
Change the value in the widget.
Press Enter. The entered value is assigned to the vertices and becomes the default value of next vertices.
Another way to change the Z value of a vertex is to move and snap it on a vector layer feature with the Z value capability. If more than one vertex are selected, the Z value can’t be changed in this way.
The Transform mesh vertices dialog also provides means to modify the Z value of a selection of vertices (along with their X or Y coordinates).
17.4.3. Selecting mesh elements
17.4.3.1. Using Digitize Mesh Elements
Activate the  Digitize Mesh Elements tool.
Hover over an element and it gets highlighted, allowing you to select it.
Digitize Mesh Elements tool.
Hover over an element and it gets highlighted, allowing you to select it.
Click on a vertex, and it is selected.
Click on the small square at the center of a face or an edge, and it gets selected. Connected vertices are also selected. Conversely, selecting all the vertices of an edge or a face also selects that element.
Drag a rectangle to select overlapping elements (a selected face comes with all their vertices). Press Alt key if you want to select only completely contained elements.
To add elements to a selection, press Shift while selecting them.
To remove an element from the selection, press Ctrl and reselect it. A deselected face will also deselect all their vertices.
17.4.3.2. Using Select Mesh Elements by Polygon
Activate the  Select Mesh Elements by Polygon tool and:
Draw a polygon (left-click to add vertex, Backspace to undo last vertex, Esc to abort the polygon and right-click to validate it) over the mesh geometries. Any partially overlapping vertices and faces will get selected. Press Alt key while drawing if you want to select only completely contained elements.
Right-click over the geometry of a vector layer’s feature, select it in the list that pops up and any partially overlapping vertices and faces of the mesh layer will get selected. Use Alt while drawing to select only completely contained elements.
To add elements to a selection, press Shift while selecting them.
To remove an element from the selection, press Ctrl while drawing over the selection polygon.
17.4.3.3. Using Select Mesh Elements by Expression
Another tool for mesh elements selection is  Select Mesh Elements by Expression. When pressed, the tool opens the mesh
expression selector dialog from which you can:
Select Mesh Elements by Expression. When pressed, the tool opens the mesh
expression selector dialog from which you can:
Select the method of selection:
Select by vertices: applies the entered expression to vertices, and returns matching ones and their eventually associated edges/faces
Select by faces: applies the entered expression to faces, and returns matching ones and their associated edges/vertices
Write the expression of selection. Depending on the selected method, available functions in the Meshes group will be filtered accordingly.
Run the query by setting how the selection should behave and pressing:
 Select: replaces any existing selection
in the layer
Select: replaces any existing selection
in the layer Add to current selection
 Remove from current selection
17.4.4. Modifying mesh elements
17.4.4.1. Adding vertices
To add vertices to a mesh layer:
Press the
Digitize mesh elements buttonA Vertex Z value widget appears on the top right corner of the map canvas. Set this value to the Z coordinate you would like to assign to the subsequent vertices
Then double-click:
outside a face: adds a “free vertex”, that is a vertex not linked to any face. This vertex is represented by a red dot when the layer is in editing mode.
on the edge of existing face(s): adds a vertex on the edge, splits the face(s) into triangles connected to the new vertex
inside a face: splits the face into triangles whose edges connect the surrounding vertices to the new vertex.
17.4.4.2. Adding faces
To add faces to a mesh layer:
Press the
Digitize mesh elements buttonA Vertex Z value widget appears on the top right corner of the map canvas. Set this value to the Z coordinate you would like to assign to the subsequent vertices.
Double-click to add a first vertex or move the cursor next to a vertex.
Click the small triangle that appears next to the vertex and move the cursor to the next vertex position; you can snap to existing vertex or double-click to add a new one.
Proceed as above to add as many vertices you wish for the face. Press Backspace button to undo the last vertex.
While moving the mouse, a rubberband showing the shape of the face is displayed. If it is shown in green, then the expected face is valid and you can right-click to add it to the mesh. If in red, the face is not valid (e.g. because it self-intersects, overlaps an existing face or vertex, …) and can’t be added. You’d need to fix the geometry.
Press Esc to abort the face digitizing.
Right-click to validate the face.
17.4.4.3. Removing mesh elements
Enable the
Digitize mesh elements toolRight-click and select:
Remove Selected Vertices and Fill Hole(s) or press Ctrl+Del: removes vertices and linked faces and fills the hole(s) by triangulating from the neighbor vertices
Remove Selected Vertices Without Filling Hole(s) or press Ctrl+Shift+Del: removes vertices and linked faces and do not fill hole(s)
Remove Selected Face(s) or press Shift+Del: removes faces but keeps the vertices
These options are also accessible from the contextual menu when hovering over a single item without selecting.
17.4.4.4. Moving mesh elements
To move vertices and faces of a mesh layer:
Enable the
Digitize mesh elements toolTo start moving the element, click on a vertex or the centroid of a face/edge
Move the cursor to the target location (snapping to vector features is supported).
If the new location does not generate an invalid mesh, the moved elements appear in green. Click again to release them at this location. Faces whose vertices are all selected are translated, their neighbors are reshaped accordingly.
17.4.4.5. Transforming mesh vertices
The  Transform Vertices Coordinates tool gives
a more advanced way to move vertices, by editing their X, Y and/or Z coordinates
thanks to expressions.
Transform Vertices Coordinates tool gives
a more advanced way to move vertices, by editing their X, Y and/or Z coordinates
thanks to expressions.
Select the vertices you want to edit the coordinates
Press
Transform Vertices Coordinates.
A dialog opens with a mention of the number of selected vertices.
You can still add or remove vertices from the selection.Depending on the properties you want to modify, you need to check the X coordinate, Y coordinate and/or Z value.
Then enter the target position in the box, either as a numeric value or an expression (using the
 Expression dialog)
With the
 Import Coordinates of the Selected Vertex
pressed, the X, Y and Z boxes are automatically filled with its coordinates
whenever a single vertex is selected. A convenient and quick way to adjust
vertices individually.
Import Coordinates of the Selected Vertex
pressed, the X, Y and Z boxes are automatically filled with its coordinates
whenever a single vertex is selected. A convenient and quick way to adjust
vertices individually.Press Preview Transform to simulate the vertices new location and preview the mesh with transformation.
If the preview is green, transformed mesh is valid and you can apply the transformation.
If the preview is red, the transformed mesh is invalid and you can not apply the transformation until it is corrected.
Press Apply Transform to modify the selected coordinates for the set of vertices.
17.4.4.6. Reshaping mesh geometry
The contextual menu
Enable the
Digitize mesh elementsSelect mesh item(s), or not
Hover over a mesh element, it gets highlighted.
Right-click and you can:
Split Selected Face(s) (Split Current Face): splits the face you are hovering over or each selected quad mesh faces into two triangles
Delaunay Triangulation with Selected vertices: builds triangular faces using selected free vertices.
Refine Selected Face(s) (Refine Current Face): splits the face into four faces, based on vertices added at the middle of each edge (a triangle results into triangles, a quad into quads). Also triangulates adjacent faces connected to the new vertices.
The edge markers
When the Digitize mesh elements is active and you hover
over an edge, the edge is highlighted and it is possible to interact with it.
Depending on the context, following markers may be available:
a square, at the center of the edge: click on it to select extremity vertices.
a cross if the two faces on either side can be merged: click on it to delete the edge and merge the faces.
a circle if the edge is between two triangles: Click on it to flip the edge, i.e. connect it instead to the two other “free” vertices of the faces
The Force by Selected Geometries tool
The  Force by Selected Geometries tool
provides advanced ways to apply break lines using lines geometry.
A break line will force the mesh to have edges along the line. Note that
the break line will not be considered persistent once the operation is done;
resulting edges will not act as constraints anymore and can be modified like
any other edge.
This can be used for example to locally modify a mesh layer with accurate
lines, as river banks or border of road embankments.
Force by Selected Geometries tool
provides advanced ways to apply break lines using lines geometry.
A break line will force the mesh to have edges along the line. Note that
the break line will not be considered persistent once the operation is done;
resulting edges will not act as constraints anymore and can be modified like
any other edge.
This can be used for example to locally modify a mesh layer with accurate
lines, as river banks or border of road embankments.
Enable the
Force by Selected Geometries toolIndicate the geometry to use as “forcing line”; it can be:
picked from a line or polygon feature in the map canvas: right-click over the vector feature and select it from the list in the contextual menu.
a virtual line drawn over the mesh frame: left-click to add vertices, right-click for validation. Vertices Z value is set through the Vertex Z value widget or the z widget if the Advanced Digitizing Panel is on. If the line is snapped to a mesh vertex or a 3D vector feature’s vertex or segment, the new vertex takes the snapped element Z value.
Mesh faces that overlap the line geometry or the polygon’s boundary will be
affected in a way that depends on options you can set from
the Force by Selected
Geometries tool drop-down menu:
- Add new vertex on intersecting edges: with this option,
a new vertex is added each time the forcing line intersect an edge. This option
leads to split along the line each encountered faces.
Without this option, encountered faces are removed and replaced by faces coming from a triangulation with only the existing vertices plus the vertices of the forcing lines (new vertices are also added on the boundary edge intersecting the forcing lines).
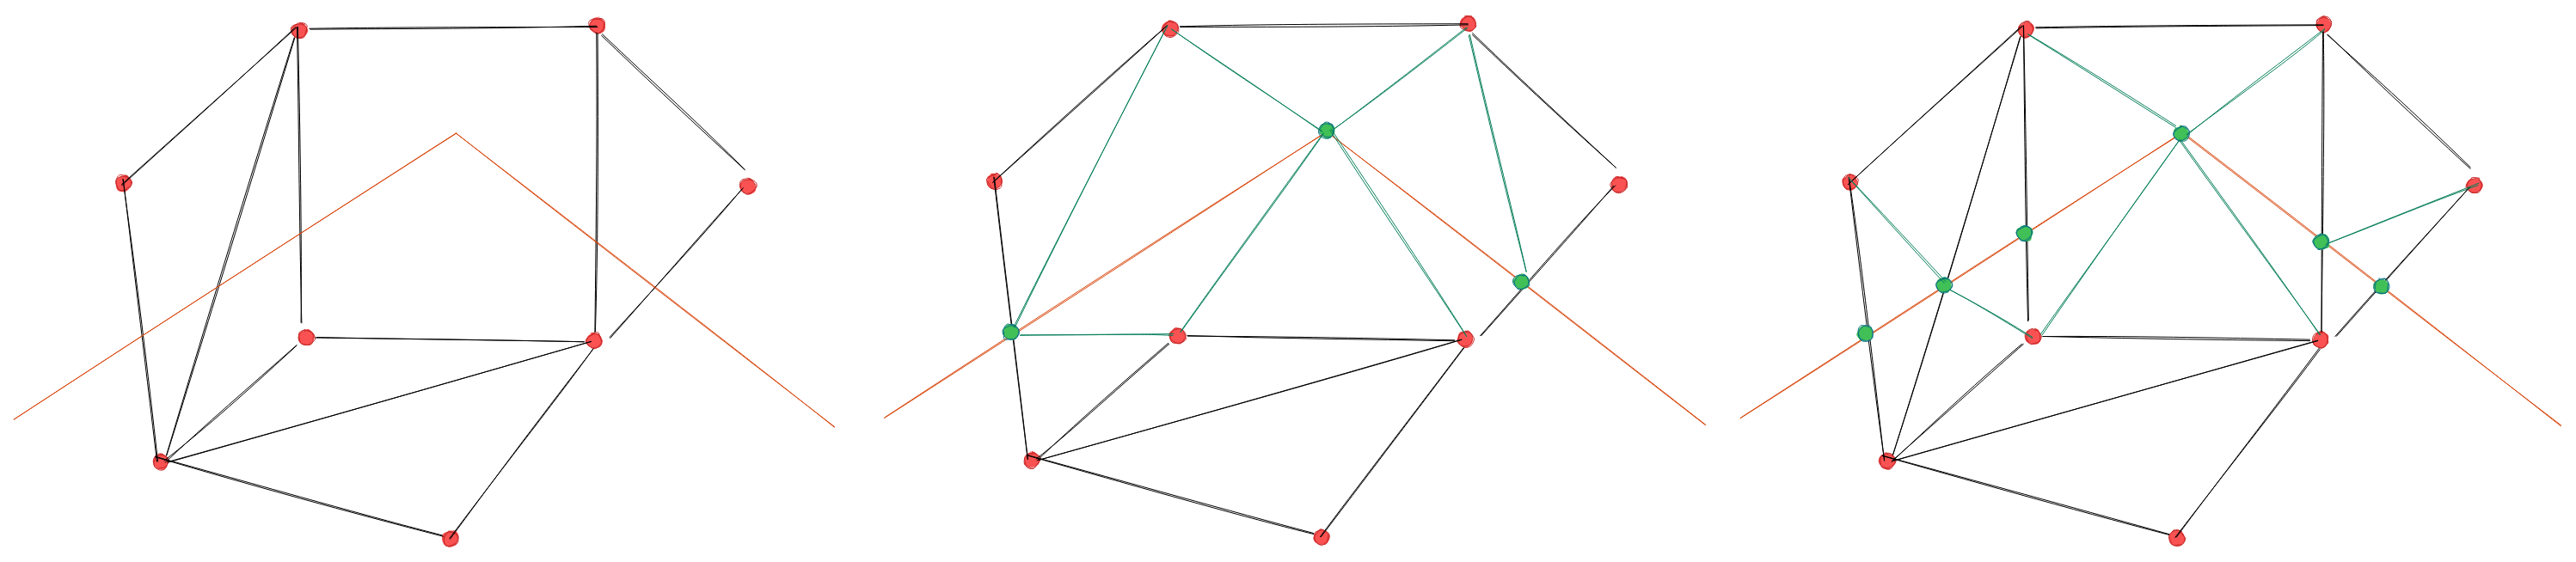
그림 17.12 Force Mesh using a line geometry - Results without (middle) and with (right) new vertex on edges intersection
Interpolate Z value from: set how the new vertices Z value is calculated. It can be from:
the Mesh itself: the new vertices Z value is interpolated from vertices of the face they fall within
or the Forcing line: if the line is defined by a 3D vector feature or a drawn line then the new vertices Z value is derived from its geometry. In case of 2D line feature, the new vertices Z value is the Vertex Z value.
Tolerance: when an existing mesh vertex is closer to the line than the tolerance value, do not create new vertex on the line but use the existing vertex instead. The value can be set in Meters at Scale or in Map Units (more details at 단위 선택기).
17.4.5. Reindexing meshes
During edit, and in order to allow quick undo/redo operations, QGIS keeps empty
places for deleted elements, which may lead to growing memory use and
inefficient mesh structuring.
The  tool is designed to remove these holes and renumber the indices of
faces and vertices so that they are continuous and somewhat reasonably ordered.
This optimizes relation between faces and vertices and increases the efficiency
of calculation.
tool is designed to remove these holes and renumber the indices of
faces and vertices so that they are continuous and somewhat reasonably ordered.
This optimizes relation between faces and vertices and increases the efficiency
of calculation.
참고
The Reindex Faces and Vertices tool saves
the layer and clear the undo/redo stacks, disabling any rollback.
17.5. Mesh Calculator
The Mesh Calculator tool from the top menu allows you to perform arithmetic and logical calculations on existing dataset groups to generate a new dataset group (see 그림 17.13).
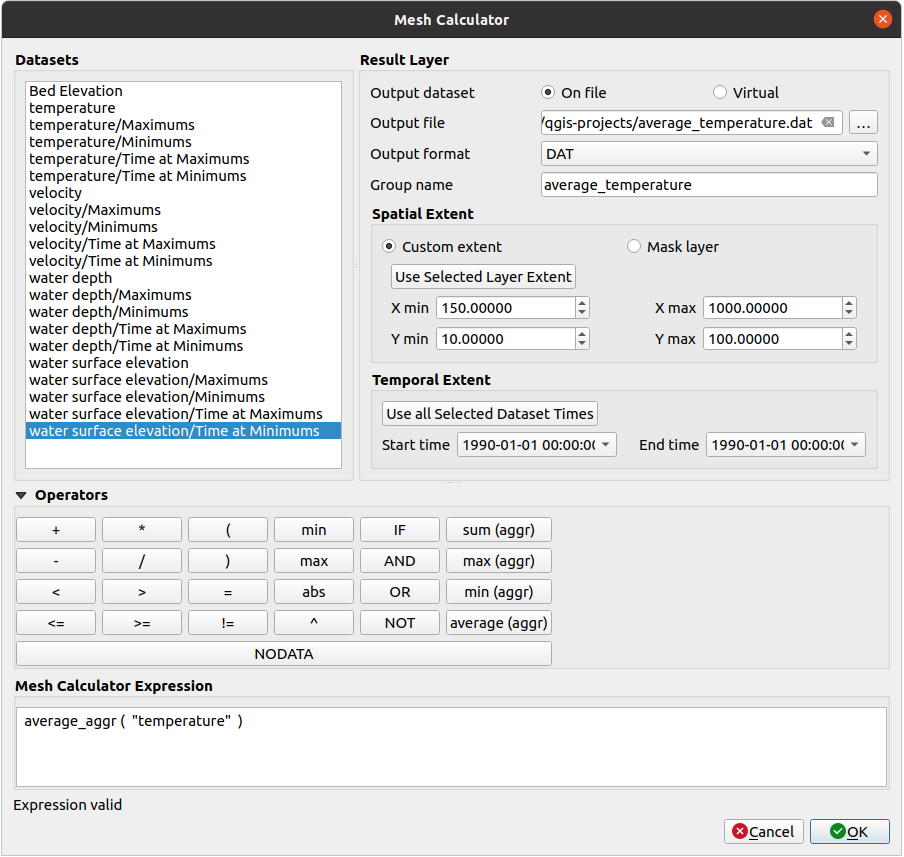
그림 17.13 Mesh Calculator
The Datasets list contains all dataset groups in the active mesh layer. To use a dataset group in an expression, double click its name in the list and it will be added to the Mesh calculator expression field. You can then use the operators to construct calculation expressions, or you can just type them into the box.
The Result Layer helps you configure properties of the output layer:
- Create on-the-fly dataset group instead of writing layer
to disk:
If unchecked, the output is stored on disk as a new plain file. An Output File path and an Output Format are required.
If checked, a new dataset group will be added to the mesh layer. Values of the dataset group are not stored in memory but each dataset is calculated when needed with the formula entered in the mesh calculator. That virtual dataset group is saved with the project, and if needed, it can be removed or made persistent in file from the layer Source properties tab.
In either case, you should provide a Group Name for the output dataset group.
The Spatial extent to consider for calculation can be:
a Custom extent, manually filled with the X min, X max, Y min and Y max coordinate, or extracted from an existing dataset group (select it in the list and press Use selected layer extent to fill the abovementioned coordinate fields)
defined by a polygon layer (Mask layer) of the project: the polygon features geometry are used to clip the mesh layer datasets
The Temporal extent to take into account for datasets can be set with the Start time and End time options, selected from the existing dataset groups timesteps. They can also be filled using the Use all selected dataset times button to take the whole range.
The Operators section contains all available operators. To add an operator
to the mesh calculator expression box, click the appropriate button. Mathematical
calculations (+, -, *, … ) and statistical functions (min,
max, sum (aggr), average (aggr), … ) are available.
Conditional expressions (=, !=, <, >=, IF, AND, NOT, … )
return either 0 for false and 1 for true, and therefore can be used with other operators
and functions. The NODATA value can also be used in the expressions.
The Mesh Calculator Expression widget shows and lets you edit the expression to execute.