13.2. 심볼 선택기
심볼 선택기는 심볼을 디자인하기 위한 주 대화창입니다. 마커(marker), 라인(line) 또는 채우기(fill) 심볼을 생성하거나 편집할 수 있습니다.
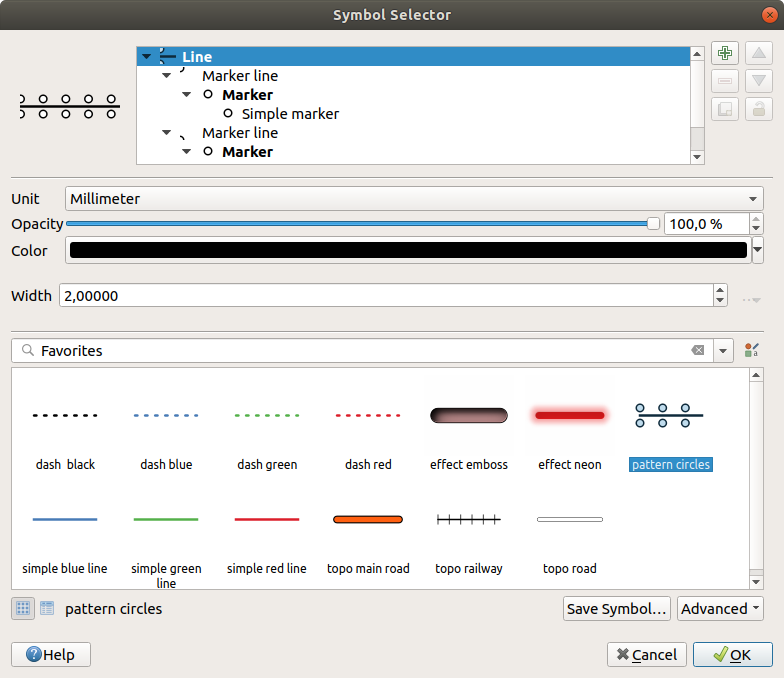
그림 13.10 라인 심볼 디자인하기
다음은 심볼 선택기 대화창을 구성하는 주 요소 두 가지입니다:
심볼 트리: 이후에 결합해서 새 전체 수준 심볼을 형성하는 심볼 레이어를 표시합니다.
설정: 트리에서 선택한 심볼 레이어의 환경을 설정합니다.
13.2.1. 심볼 레이어 트리
심볼은 여러 Symbol layers 로 이루어질 수 있습니다. 심볼 트리는 이후에 결합해서 새 전체 수준 심볼을 형성하는 이 심볼 레이어들의 적층(overlay)을 표시합니다. 게다가, 심볼 속성을 변경하자마자 동적인 심볼 표현이 업데이트됩니다.
심볼 트리 항목에서 선택한 수준에 따라, 트리 관리 작업을 도와주는 다양한 도구가 활성화되어 사용할 수 있습니다:


13.2.2. 심볼 환경 설정
QGIS는 심볼, 그 다음 심볼 레이어라는 두 단계를 거쳐 심볼의 환경을 설정합니다.
13.2.2.1. 심볼
트리의 최상 수준에서, 심볼은 레이어 도형에 따라 마커, 라인 또는 채우기 유형이 될 수 있습니다. 각 심볼은 하나 이상의 (어느 유형이든) 심볼 또는 심볼 레이어를 내장할 수 있습니다.
전체 수준 심볼에 적용되는 다음 몇몇 파라미터를 설정할 수 있습니다:
Unit: 밀리미터, 포인트, 픽셀, 축척에 따른 미터, 맵 단위 또는 인치 가운데 하나를 선택할 수 있습니다. (자세한 내용은 단위 선택기 를 참조하세요.)
Opacity: 투명도를 설정할 수 있습니다.
Color: 사용자가 이 파라미터를 변경하면, 잠기지 않은 모든 하위 심볼 색상에 그 색상값을 반영합니다.
Size 및 Rotation: 마커 심볼 전용의 크기 및 기울기 파라미터입니다.
Width: 라인 심볼 전용의 선의 폭 파라미터입니다.
팁
심볼 수준에서 심볼이 내장한 모든 심볼 레이어 차원의 크기를 비례에 맞게 재조정하려면 (마커 심볼 전용) Size 나 (라인 심볼 전용) Width 속성을 사용하십시오.
참고
스타일 관리자 대화창에서 심볼을 설정할 때 폭, 크기 또는 기울기 파라미터 옆에 있는 데이터 정의 무시 버튼은 비활성화돼 있습니다. 심볼이 레이어와 연결된 다음에야, 이 버튼으로 비례 또는 다변량 분석 렌더링을 생성할 수 있습니다.
심볼 라이브러리 미리보기: 동일 유형의 심볼들이 표시되며, 위에 있는 편집 가능한 드롭다운 목록을 통해 양식 없는 텍스트 또는 카테고리 로 동일 유형의 심볼들을 필터링할 수 있습니다. 또
 Style Manager 버튼을 사용해서 심볼 목록을 업데이트하고 스타일 관리자라는 이름의 유래가 된 대화창을 열 수 있습니다. 이 대화창에서 스타일 관리자 절에서 설명하는 모든 기능을 사용할 수 있습니다.
심볼은 다음 가운데 한 가지 방법으로 표시됩니다:
프레임 하단에 있는
 List View 버튼을 통한 (썸네일, 명칭 및 관련 태그를 함께 표시하는) 아이콘 목록
또는
 Icon View 버튼을 통한 아이콘 미리보기
심볼 라이브러리에 편집 중인 심볼을 추가하려면 Save Symbol 버튼을 클릭하십시오.
Advanced
 옵션을 통해 다음 작업을 할 수 있습니다:
Clip features to canvas extent: 라인 및 채우기 심볼 전용 설정으로, 캔버스 범위를 따라 피처를 잘라냅니다.
Force right-hand rule orientation: 채우기 심볼 전용으로, 채우기 심볼의 고리 방향을 표준 “오른손 법칙” 을 따르도록 강제 렌더링할 수 있습니다. (예를 들어 외부 고리가 시계 방향, 내부 고리가 모두 반시계 방향인 폴리곤인 경우에 말이죠.)
이 방향 고정은 렌더링 중에만 적용되고, 원본 피처 도형을 변경하지는 않습니다. 이렇게 설정하면 렌더링 중인 데이터셋과 개별 피처의 고리 방향과 상관없이, 일관된 외형을 가진 채우기 심볼을 생성할 수 있습니다.
심볼이 적용되는 레이어의 심볼 에 따라, Advanced 메뉴에서 다음과 같은 추가 설정을 할 수 있습니다:
심볼 수준…: 심볼 렌더링 순서를 정의합니다.
Match to Saved Symbols… 및 Match to Symbols from File…: 자동적으로 범주에 심볼을 할당 합니다.
13.2.2.2. 심볼 레이어
트리의 낮은 수준에서, 심볼 레이어를 사용자 지정할 수 있습니다. 사용할 수 있는 심볼 레이어 유형은 상위 심볼 유형을 따릅니다. 심볼 렌더링을 향상시키기 위해 심볼 레이어에  그리기 효과 를 적용할 수 있습니다.
모든 심볼 레이어 유형의 모든 옵션을 다 설명하는 것이 불가능하기 때문에, 특별하고 중요한 옵션들만 설명하겠습니다.
공통 파라미터
심볼 레이어가 마커, 라인, 채우기 하위 유형인지 상관없이, 심볼 레이어를 작성하는 데 다음 공통 옵션 및 위젯을 쓸 수 있습니다:
색상 선택기 위젯: 색상을 쉽게 조정할 수 있습니다.
Units: 밀리미터, 포인트, 픽셀, 축척에 따른 미터, 맵 단위 또는 인치 가운데 하나를 선택할 수 있습니다. (자세한 내용은 단위 선택기 를 참조하세요.)
 Data-defined override 위젯: 거의 모든 옵션들 옆에 있으며, 각 심볼을 사용자 지정하는 능력을 확장합니다. (자세한 내용은 데이터 정의 무시 설정 을 참조하세요.)
 Enable symbol layer: 이 옵션은 심볼 레이어의 가시성을 제어합니다. 심볼 레이어를 비활성화하면 심볼 렌더링 시 그리지 않지만 심볼 내에 저장합니다. 심볼 레이어를 숨길 수 있다는 사실은 사용자 심볼을 디자인하는 데 유용합니다. 디자인 도중 심볼 레이어를 제거하지 않아도 되기 때문입니다. 이때 데이터 정의 무시를 사용하면 (예를 들어 피처 속성을 이용한) 표현식을 기반으로 서로 다른 심볼 레이어들을 숨기거나 표시할 수 있습니다.
- Draw effects 버튼: 효과 렌더링 을 이용할 수 있습니다.
참고
다음에 설명할 내용이 심볼 레이어의 유형은 피처 도형에 종속된다고 가정하고 있긴 하지만, 심볼 레이어를 다른 심볼 레이어 안에 삽입할 수 있다는 사실을 기억하십시오. 이 경우, 낮은 수준의 심볼 레이어 파라미터(위치, 오프셋 등등)가 피처 도형 자체가 아니라 높은 수준의 심볼에 종속될 수도 있습니다.
마커 심볼
포인트 도형 피처에 어울리는 마커 심볼은 다음과 같은 여러 Symbol layer types 를 가지고 있습니다:
단순 마커 (기본값)
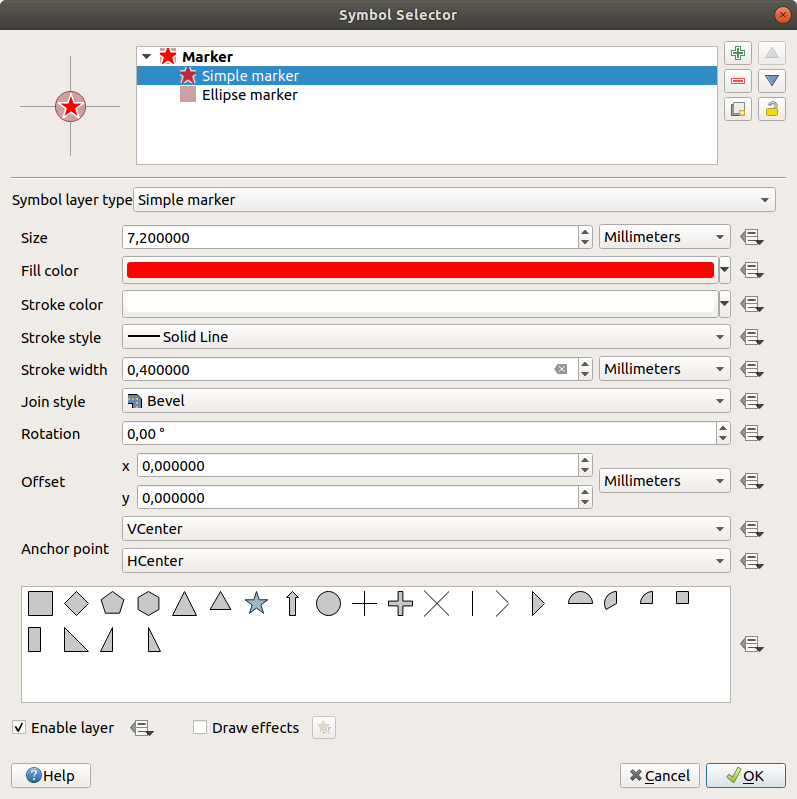
그림 13.11 단순 마커 심볼 디자인하기
The simple marker symbol layer type has the following properties:
Size in various supported units
Fill color
Stroke color, Stroke style from a predefined list and Stroke size
Join style: it can be Bevel, Miter or Round
Cap style: it can be Square, Flat or Round
Rotation
Offset in X and Y directions from the feature
Anchor point: defining the quadrant point on the symbol to settle as placement origin. This is the point the Offset is applied on.
타원체 마커: 단순 마커 심볼 레이어로, 너비 및 높이를 사용자 지정할 수 있습니다.
채운 마커(filled marker): 단순 마커 심볼 레이어와 비슷하지만, 마커를 렌더링하는 데 채우기 하위 심볼 을 이용한다는 점이 다릅니다. 이 마커를 사용하면 마커를 렌더링하는 데 그레이디언트 또는 부풀리기(shapeburst) 같은 모든 기존 QGIS 채우기 (및 획) 스타일을 사용할 수 있습니다.
글꼴 마커(font marker): 단순 마커 심볼 레이어와 비슷하지만, 마커를 렌더링하는 데 설치된 글꼴을 이용한다는 점이 다릅니다. 이 마커의 추가적인 속성은 다음과 같습니다:
Font family: 글꼴 집합
Font style: 글꼴 스타일
Character(s): 심볼로서 표시될 텍스트를 나타냅니다. 텍스트를 직접 입력하거나, 글꼴 문자 집합 위젯에서 텍스트 문자를 선택할 수 있습니다. 또한 Preview 에서 텍스트 문자를 선택한 설정대로 실시간 미리보기할 수도 있습니다.
도형 생성기(geometry generator) (도형 생성기 참조)
마스크(mask): 마스크 심볼의 하위 심볼이 마스크 형태를 정의합니다. 마스크 심볼의 색상 속성은 무시되며, 투명도만 적용될 것입니다. 마스크 심볼이 색상이 고정된 라벨 또는 다른 심볼과 겹치는 경우 유용한 습성입니다. 이렇지 않으면 겹치는 라벨 또는 심볼을 읽기 어렵기 때문입니다. 더 자세한 내용은 마스크 속성 을 참조하세요.
Raster image marker: use an image (
PNG,JPG,BMP…) as marker symbol. The image can be a file on the disk, a remote URL, embedded in the style database (more details) or it can be encoded as a base64 string. Width and height of the image can be set independently or using the Lock aspect ratio. The size can be set using any of the
common units or as a percentage of the image’s original
size (scaled by the width).
Lock aspect ratio. The size can be set using any of the
common units or as a percentage of the image’s original
size (scaled by the width).벡터장 마커(vector field marker) (벡터장 마커 참조)
SVG marker: provides you with images from your SVG paths (set in menu) to render as marker symbol. Width and height of the symbol can be set independently or using the
Lock aspect ratio. Each SVG file colors and stroke can
also be adapted. The image can be a file on the disk, a remote URL, embedded
in the style database (more details) or it can
be encoded as a base64 string.The symbol can also be set with Dynamic SVG parameters. See Parametrizable SVG section to parametrize an SVG symbol.
참고
SVG 버전 요구사항
QGIS는 SVG Tiny 1.2 profile 을 따라 SVG 파일을 렌더링합니다. 이 프로파일은 휴대폰, PDA, 노트북, 데스크탑컴퓨터를 아우르는 광범위한 기기에서 실행되도록 설계되어 있기 때문에, SVG의 성능을 확장하기 위한 새 피처들과 함께 SVG 1.1 전체에 포함된 피처들의 서브셋을 포함하고 있습니다.
이 사양에 포함되지 않은 일부 피처는 QGIS에서 정확하게 렌더링되지 않을 수도 있습니다.
라인 심볼
라인 도형 피처에 어울리는 라인 심볼은 다음과 같은 여러 Symbol layer types 를 가지고 있습니다:
Simple line (default)
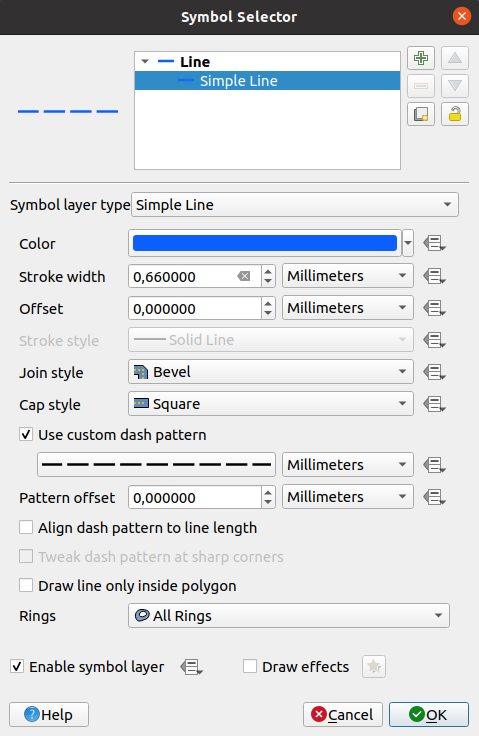
그림 13.12 단순 라인 심볼 디자인하기
단순 라인 심볼 레이어 유형의 속성은 많은 부분 단순 마커 심볼 과 동일하며, 추가로:
- Use custom dash pattern: Stroke style 설정을 무시하고 사용자 지정 점선 패턴을 사용합니다.
Pattern offset: the positioning of the dashes/spaces in the line can be tweaked, so that they can be placed at nicer positions to account for corners in the line (also can be used potentially to “align” adjacent dash pattern borders)
- Align dash pattern to line length: 라인의 끝이 점선 패턴의 틈이 아니라 완전한 점선 요소로 끝나도록 점선 패턴 길이를 조정합니다.
- Tweak dash pattern at sharp corners: 완전한 점선 요소가 뾰족한 모서리에 걸치도록 – 뾰족한 모서리가 드러나도록 – 점선 패턴의 배치를 동적으로 조정합니다. 이 옵션은 Align dash pattern to line length 옵션을 체크한 상태에서만 동작합니다.
Trim lines from Start and/or End: allows for the line rendering to trim off the first x mm and last y mm from the actual line string when drawing the line. It can be used e.g. when creating complex symbols where a line layer should not overlap marker symbol layers placed at the start and end of the line. The start/end trim distance supports a range of units, including percentage of the overall line length, and can be data defined for extra control.
화살표(arrow): 라인을 만곡 (또는 직선) 화살표로 그립니다. 라인의 한쪽 또는 양쪽에 화살촉 표시를 할 수 있는데, 다음과 같은 옵션(및 데이터 정의)으로 화살표를 환경 설정할 수 있습니다:
Head type
Arrow type
Arrow width
Arrow width at start
Head length
Head thickness
Offset
(라인 피처가 적어도 꼭짓점 3개를 가지고 있어야만 하는)
Curved arrows 만곡 화살표를 새 선분마다 Repeat arrow on each segment 반복해서 생성할 수 있습니다. 또 화살표 본체를 렌더링하는 데 그레이디언트나 부풀리기 같은 채우기 심볼 도 이용합니다. 도형 생성기와 결합하면, 이 심볼 레이어 유형으로 흐름도를 표현할 수 있습니다.도형 생성기(geometry generator) (도형 생성기 참조)
Interpolated line: allows to render a line whose Stroke width and/or Color may be constant (given a Fixed width and Single color parameters) or vary along the geometry. When varying, necessary inputs are:
Start value and End value: Values that will be used for interpolation at the extremities of the features geometry. They can be fixed values, feature’s attributes or based on an expression.
Min. value and Max. value: Values between which the interpolation is performed. Press the
 Load button to automatically fill them based
on the minimum and maximum start/end values applied to the layer.
Load button to automatically fill them based
on the minimum and maximum start/end values applied to the layer.Only available for the stroke option:
Min. width and Max. width: define the range of the varying width. Min. width is assigned to the Min. value and Max. width to the Max. value. A unit can be associated.
- Use absolute value: only consider absolute value
for interpolation (negative values are used as positive).
- Ignore out of range: by default, when
the
[start value - end value]range of a feature is not included in the[min. value - max. value]range, the out-of-bounds parts of the feature’s geometry are rendered with the min or max width. Check this option to not render them at all.
For varying color, you can use any of the interpolation methods of color ramp classification
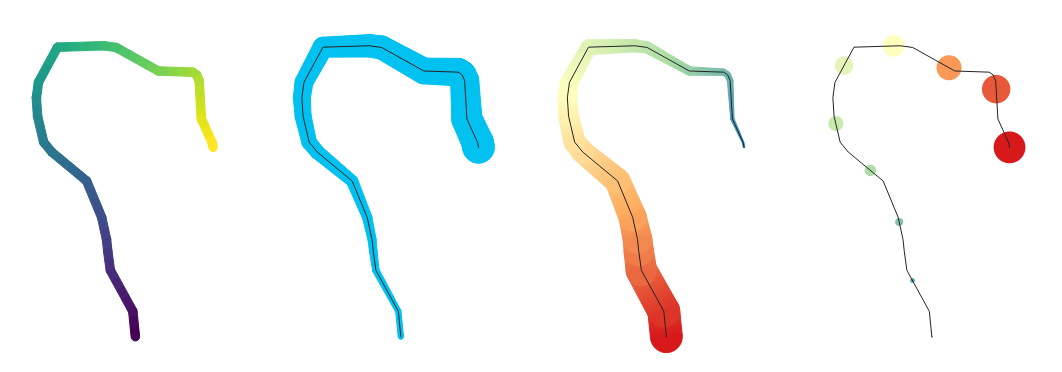
그림 13.13 Examples of interpolated lines
마커 라인: 라인의 길이만큼 마커 심볼 을 반복합니다.
The Marker placement can be at a regular distance or based on the line geometry: first, last or each vertex, on the central point of the line or of each segment, or on every curve point.
Offset along the line: the markers placement can also be given an offset from the start, along the line
- Rotate marker to follow line direction 옵션을 통해 각 마커 심볼의 방향이 라인 방향을 따라야 하는지 아닌지 설정합니다.
라인이 서로 다른 방향의 선분이 연속된 경우가 많기 때문에, 마커의 기울기를 라인을 따라 지정한 거리에서의 평균값으로 계산합니다. 예를 들어 Average angle over 속성을
4mm로 설정하면, 심볼을 배치한 위치에서 앞/뒤2mm거리에 있는 포인트를 해당 마커 심볼의 라인 각도를 계산하는 데 사용한다는 뜻입니다. 이렇게 하면 전체 라인 방향에서 살짝 벗어난 국지적 편차를 평탄하게 만드는 (또는 제거하는) 효과를 볼 수 있습니다. 즉 마커 라인 심볼의 시각적 방향이 매우 보기 좋게 됩니다. Line offset: the marker symbols can also be offset from the line feature.
채우기 심볼
폴리곤 도형 피처에 어울리는 채우기 심볼은 다음과 같은 여러 Symbol layer types 를 가지고 있습니다:
단순 채우기 (기본값): 폴리곤을 단일 색상으로 채웁니다.
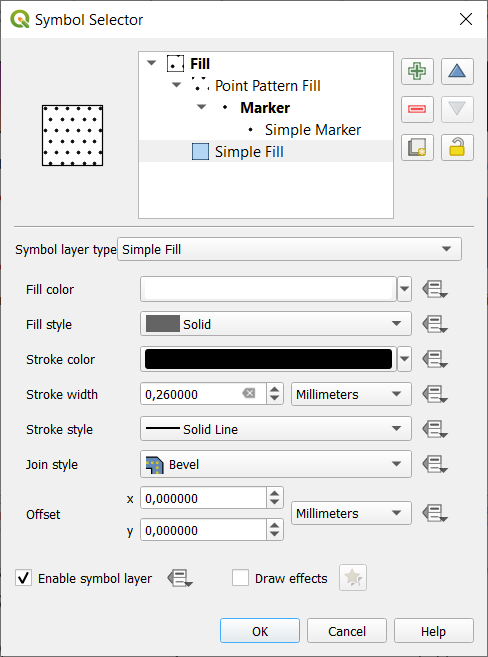
그림 13.15 단순 채우기 심볼 디자인하기
중심 채우기(centroid fill): 가시화된 피처의 중심(centroid)에 마커 심볼 을 배치합니다. 하지만 마커의 위치가 피처의 실제 중심이 아닐 수도 있습니다. 중심 계산 시 맵 캔버스에 보이는 영역으로 폴리곤(들)이 잘려서 렌더링되기도 하고 폴리곤 내부의 구멍을 무시하기도 하기 때문입니다. 정확한 중심에 마커 심볼을 배치하려면 도형 생성기 심볼 을 이용하십시오.
다음 작업을 할 수 있습니다:
Force placement of markers inside polygons
Draw markers on every part of multi-part features or place the point only on its biggest part
현재 피처 도형과 겹치는 부분들을 유지하면서(Clip markers to polygon boundary) 또는 심볼이 속해 있는 도형 부분을 유지하면서(Clip markers to current part boundary only) 마커 심볼 전체 또는 일부를 표시할 수 있습니다.
도형 생성기(geometry generator) (도형 생성기 참조)
그레이디언트 채우기: 단순한 2색상 그레이디언트 또는 사전 정의된 그레이디언트 색상표 를 바탕으로 방사형, 선형 또는 원추형 그레이디언트를 사용해서 폴리곤을 채웁니다. 그레이디언트를 회전시킬 수도 있고, 단일 피처에 한해 또는 전체 맵 범위에 걸쳐 적용할 수도 있습니다. 또 좌표를 통해, 또는 (피처 또는 맵의) 중심을 이용해서 시작점 및 종단점을 설정할 수도 있습니다. 데이터 정의 오프셋도 정의할 수 있습니다.
Line pattern fill: fills the polygon with a hatching pattern of line symbol layer. You can set:
Rotation of the lines, counter-clockwise
Spacing: distance between consecutive lines
Offset distance of the lines from the feature boundary
Point pattern fill: fills the polygon with a grid pattern of marker symbol. You can set:
Distance: Horizontal and Vertical distances between consecutive markers
Displacement: a Horizontal (resp. Vertical) offset of alignment between consecutive markers in a column (resp. in a row)
Offset: Horizontal and Vertical distances from the feature boundary
랜덤 마커 채우기: 폴리곤 경계선 안의 랜덤한 위치에 마커 심볼 을 배치해서 폴리곤을 채웁니다. 다음을 설정할 수 있습니다:
Count method: whether the number of marker symbols to render is considered as an absolute count or density-based
Point count: the number of marker symbols to render,
an optional random number seed, to give consistent placement
Density area: in case of density-based count method, ensures the fill density of markers remains the same on different scale / zoom levels of markers whenever maps are refreshed (also allows random placement to play nice with QGIS server and tile-based rendering)
Clip markers to polygon boundary: whether markers rendered near the edges of polygons should be clipped to the polygon boundary or not
Raster image fill: fills the polygon with tiles from a raster image (
PNGJPG,BMP…). The image can be a file on the disk, a remote URL or an embedded file encoded as a string (more details). Options include (data defined) opacity, image width, coordinate mode (object or viewport), rotation and offset. The image width can be set using any of the common units or as a percentage of the original size.SVG fill: fills the polygon using SVG markers of a given size (Texture width);
부풀리기(shapeburst) 채우기: 이 옵션은 그레이디언트 채우기에 버퍼를 적용하는데, 폴리곤의 경계선에서 중심을 향해 그레이디언트를 그립니다. 경계선에서 음영을 그릴 거리, 색상표 사용 또는 단순한 2색상 그레이디언트 사용, (선택적인) 채우기의 번짐 효과, 그리고 오프셋 파라미터 등을 설정할 수 있습니다.
Outline: Arrow: uses a line arrow symbol layer to represent the polygon boundary. The settings for the outline arrow are the same as for arrow line symbols.
Outline: Hashed line: uses a hash line symbol layer to represent the polygon boundary (Rings) which can be the interior rings only, the exterior ring only or all the rings). The other settings for the outline hashed line are the same as for hashed line symbols.
Outline: Marker line: uses a marker line symbol layer to represent the polygon boundary (Rings) which can be the interior rings only, the exterior ring only or all the rings). The other settings for the outline marker line are same as for marker line symbols.
Outline: simple line: uses a simple line symbol layer to represent the polygon boundary (Rings) which can be the interior rings only, the exterior ring only or all the rings). The Draw line only inside polygon option displays the polygon borders inside the polygon and can be useful to clearly represent adjacent polygon boundaries. The other settings for the outline simple line are the same as for simple line symbols.
참고
도형 유형이 폴리곤인 경우, 라인/폴리곤을 자동적으로 캔버스 범위에 맞춰 자르는 옵션을 비활성화할 수 있습니다. 어떤 경우 이 자르기 옵션이 심볼 스타일에 방해가 되기도 하기 때문입니다. (예를 들어 중심 채우기 유형은 중심이 언제나 실제 피처의 중심이어야만 합니다.)
Parametrizable SVG
You have the possibility to change the colors of a SVG marker.
You have to add the placeholders param(fill) for fill color,
param(outline) for stroke color and param(outline-width) for stroke
width. These placeholders can optionally be followed by a default value, e.g.:
<svg width="100%" height="100%">
<rect fill="param(fill) #ff0000" stroke="param(outline) #00ff00" stroke-width="param(outline-width) 10" width="100" height="100">
</rect>
</svg>
More generally, SVG can be freely parametrized using param(param_name).
This param can either be used as an attribute value or a node text:
<g stroke-width=".265" text-anchor="middle" alignment-baseline="param(align)">
  <text x="98" y="147.5" font-size="6px">param(text1)</text>
  <text x="98" y="156.3" font-size="4.5px">param(text2)</text>
</g>
The parameters can then be defined as expressions in the Dynamic SVG parameters table.
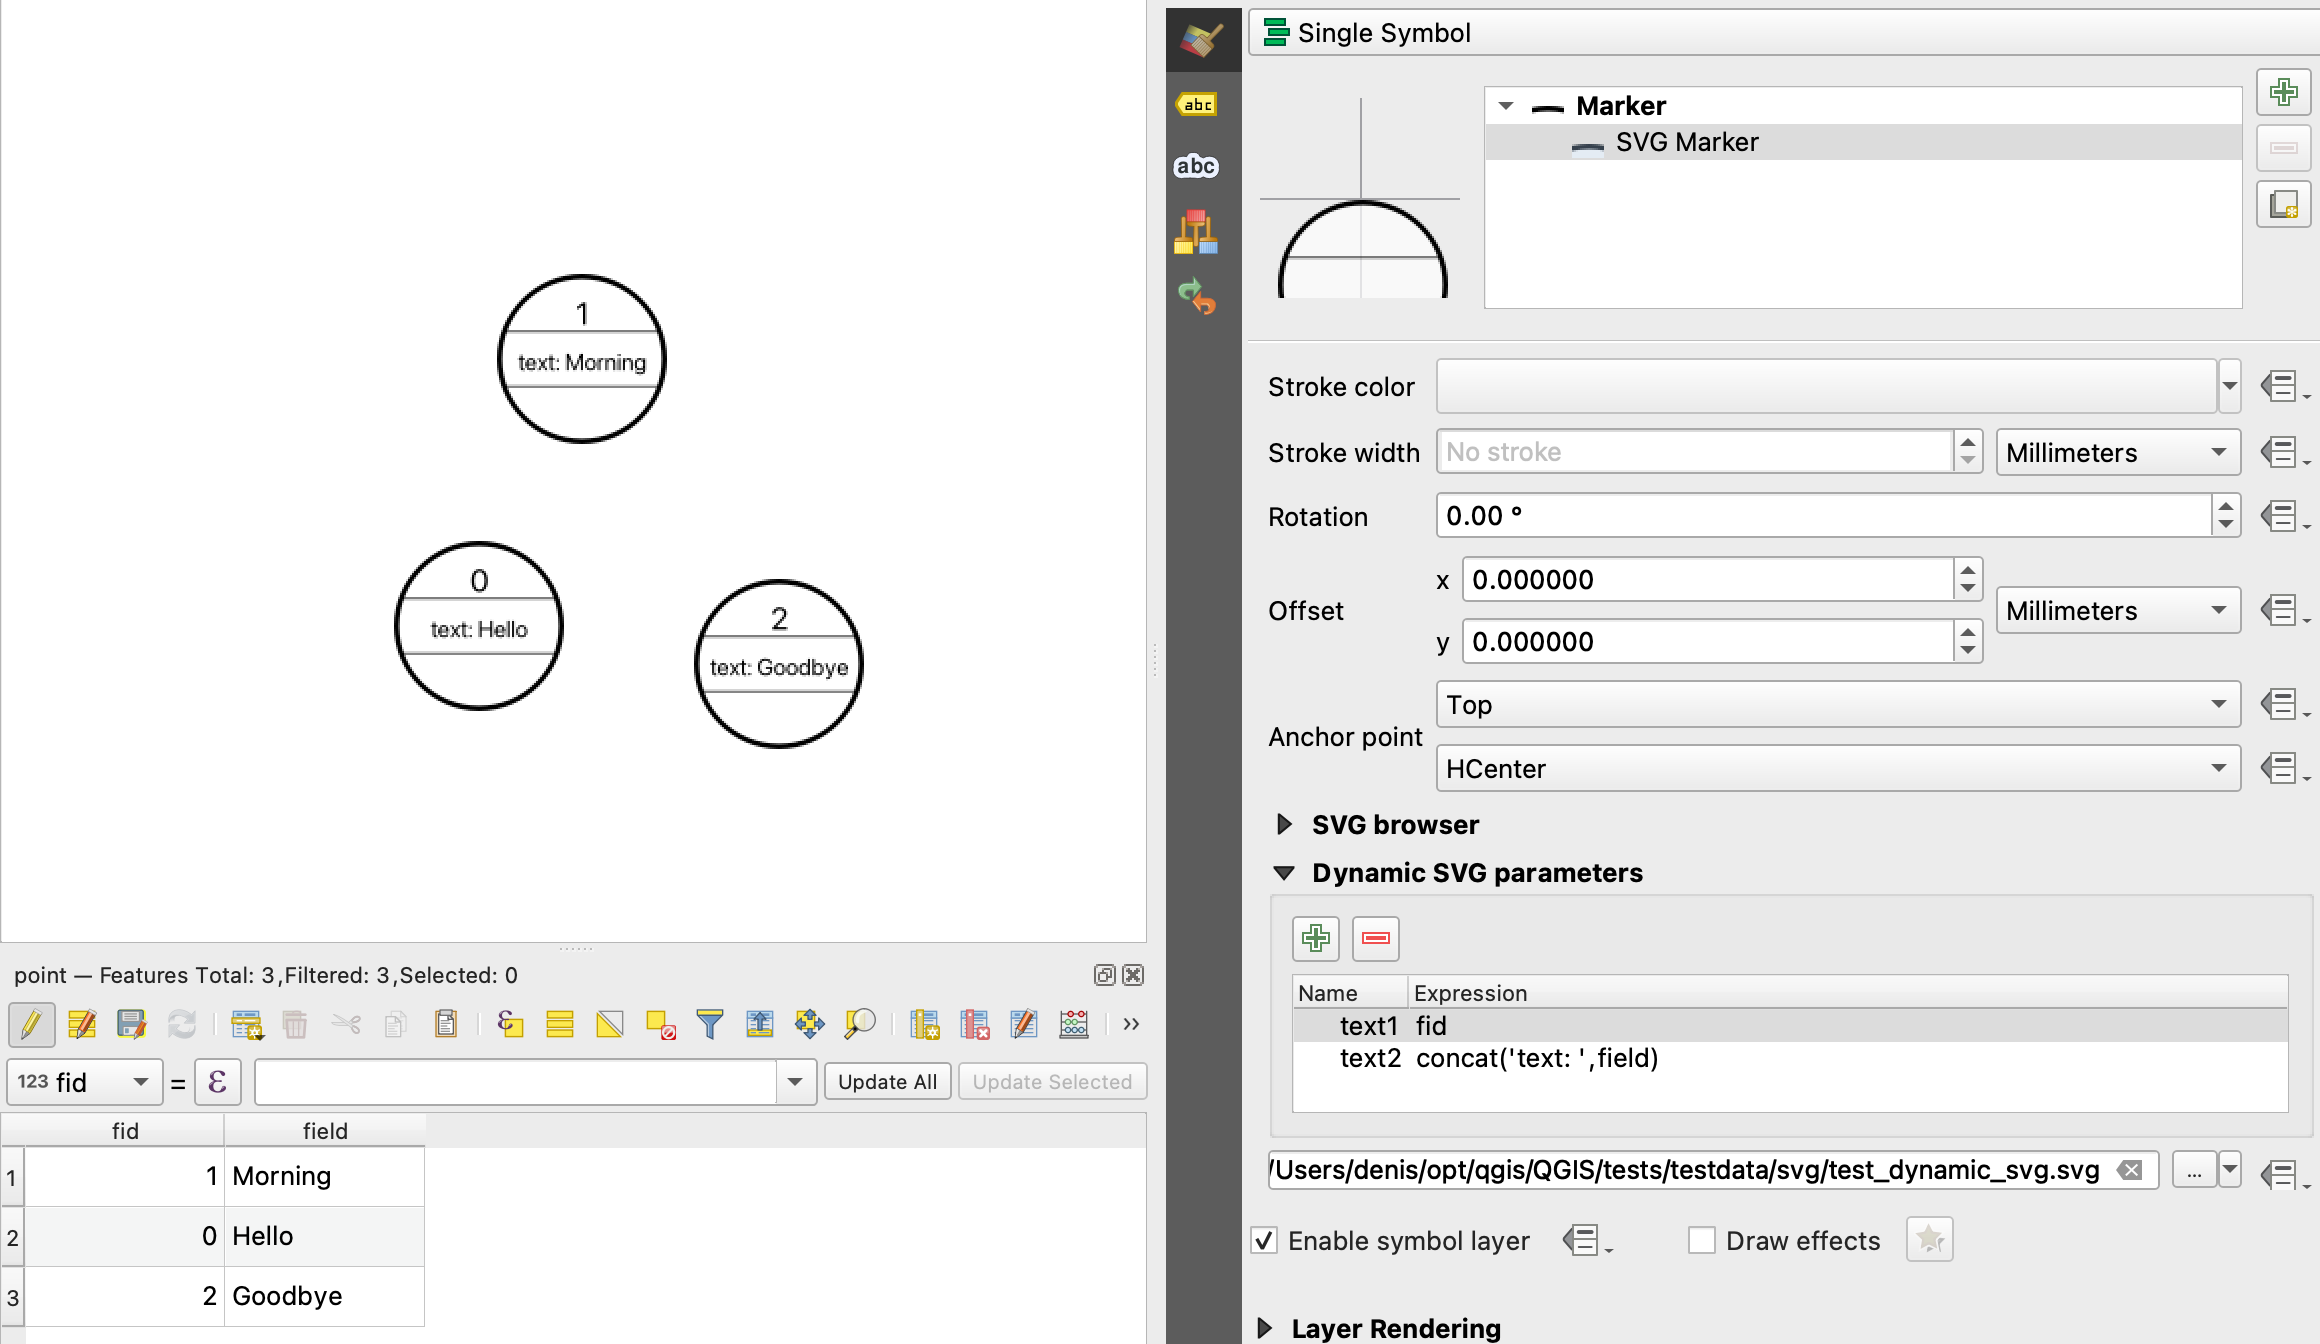
그림 13.16 Dynamic SVG parameters table
도형 생성기
Available with all types of symbols, the geometry generator symbol layer allows to use expression syntax to generate a geometry on the fly during the rendering process. The resulting geometry does not have to match with the original Geometry type and you can add several differently modified symbol layers on top of each other.
A Units property can be set: when the geometry generator symbol is not applied to a layer (e.g., it is used on a layout item), this allows more control over the generated output.
다음은 몇몇 예시입니다:
-- render the centroid of a feature
centroid( $geometry )

-- visually overlap features within a 100 map units distance from a point
-- feature, i.e generate a 100m buffer around the point
buffer( $geometry, 100 )

-- Given polygon layer1( id1, layer2_id, ...) and layer2( id2, fieldn...)
-- render layer1 with a line joining centroids of both where layer2_id = id2
make_line( centroid( $geometry ),
           centroid( geometry( get_feature( 'layer2', 'id2', attribute(
               $currentfeature, 'layer2_id') ) )
         )

-- Create a nice radial effect of points surrounding the central feature
-- point when used as a MultiPoint geometry generator
collect_geometries(
  array_foreach(
    generate_series( 0, 330, 30 ),
      project( $geometry, .2, radians( @element ) )
  )
)
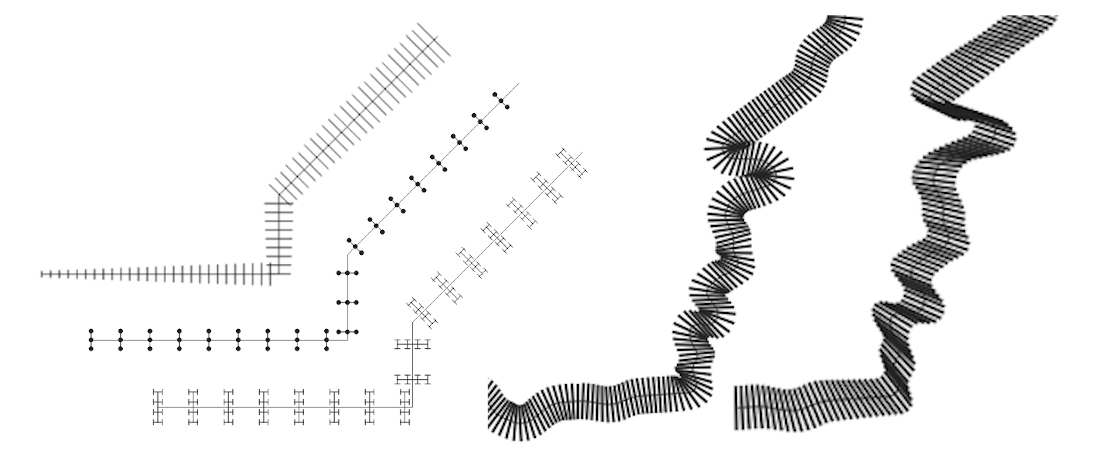
벡터장 마커
지구의 변형, 조류(潮流)의 흐름 등과 같은 벡터장(vector field) 데이터를 표시하는 데 벡터장 마커를 이용합니다. 이 마커는 선택한 데이터 포인트의 속성에 따라 축척 및 방향이 정의된 라인으로 (화살표가 낫습니다) 벡터를 표시합니다. 포인트 데이터를 렌더링하는 데에만 이 마커를 사용할 수 있습니다. 라인 및 폴리곤 레이어를 이 심볼로 그릴 수는 없습니다.
벡터장은 데이터의 속성으로 정의되는데, 다음 방법 가운데 하나로 벡터장을 표현할 수 있습니다:
데카르트 요소 (벡터장의
x및y요소)극(polar) 좌표: 이 경우, 속성이
Length와Angle을 정의합니다. 각도는 북쪽에서 시계 방향으로 또는 동쪽에서 반시계 방향으로 측정될 수도 있고, 도 단위 또는 라디안 단위일 수도 있습니다.높이만 있는(height only) 데이터: 데이터의 속성을 이용해서 척도를 조정한 수직 화살표를 표시합니다. 예를 들어 지구 변형의 수직적 요소를 표시하는 데 적합합니다.
벡터장을 살펴보기 위해 벡터장의 규모(magnitude)를 적절한 크기로 늘리거나 줄일 수 있습니다.