23.5. グラフィカルモデラー
グラフィカルモデラー ではシンプルで使いやすいインターフェースを利用して複雑なモデルを作ることができます. GISで作業をするときにほとんどの解析作業は単独で存在するのではなく一連の操作の一部として存在します. グラフィカルモデラーを使うと一連の操作を単一のプロセスにまとめることができ,後で異なるデータセットを入力として実行するときに便利です. 多くのステップや異なるアルゴリズムを含んでいてもモデルは単一のアルゴリズムとして実行されるので時間と労力を節約できます.
グラフィカルモデラーはプロセシングメニュー () から開けます.
The modeler has a working canvas where the structure of the model and the workflow it represents are shown. The left part of the window is a section with five panels that can be used to add new elements to the model:
Model Properties: you can specify the name of the model and the group that will contain itInputs: all the inputs that will shape your modelAlgorithms: the Processing algorithms availableVariables: you can also define variables that will only be available in the Processing ModelerUndo History: this panel will register everything that happens in the modeler, making it easy to cancel things you did wrong.
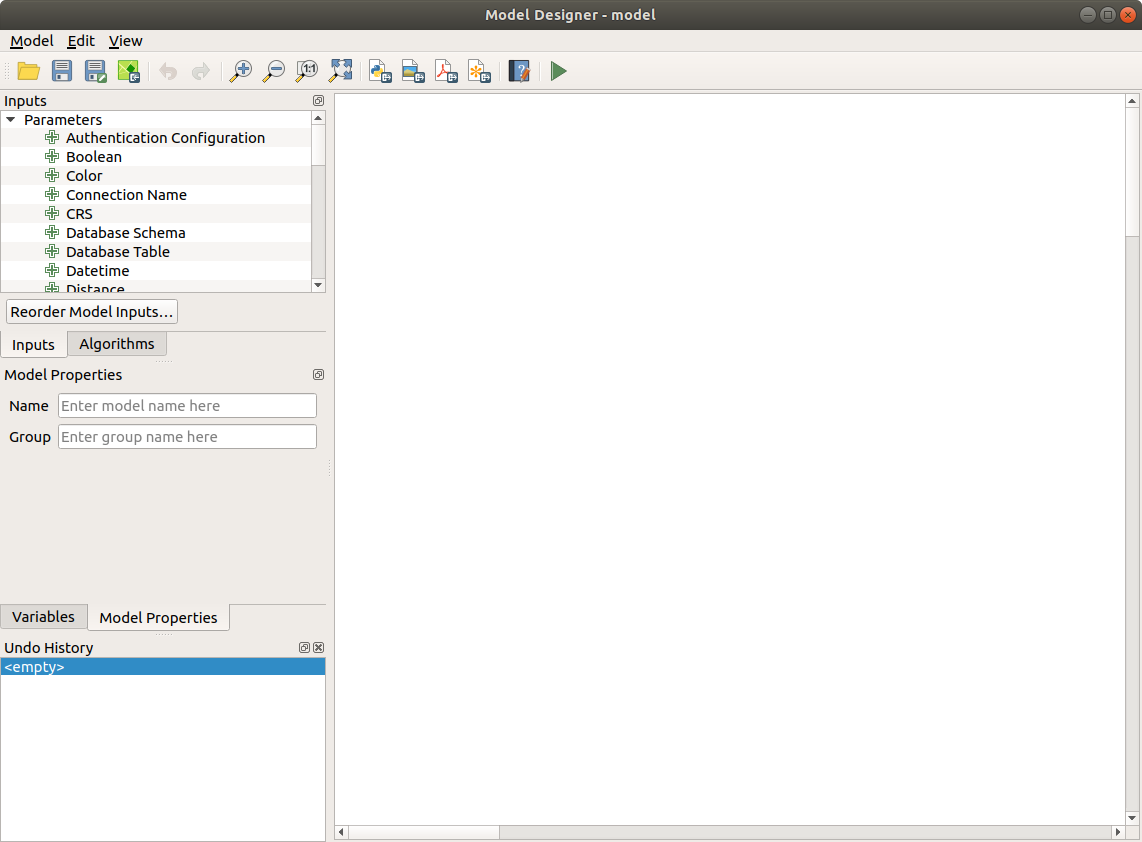
図 23.16 モデラー
Creating a model involves two basic steps:
Definition of necessary inputs. These inputs will be added to the parameters window, so the user can set their values when executing the model. The model itself is an algorithm, so the parameters window is generated automatically as for all algorithms available in the Processing framework.
Definition of the workflow. Using the input data of the model, the workflow is defined by adding algorithms and selecting how they use the defined inputs or the outputs generated by other algorithms in the model.
23.5.1. 入力の定義
The first step is to define the inputs for the model. The following elements are found in the Inputs panel on the left side of the modeler window:
認証の設定
真偽値
Color
Connection Name
Coordinate Operation
CRS
Database Schema
Database Table
Datetime
距離
列挙
式
領域
Field Aggregates
フィールドマッパー
ファイル/フォルダ
Geometry
地図レイヤ
Map Theme
行列
Mesh Layer
複数入力
数値
点
印刷レイアウト
Print Layout Item
範囲
ラスタバンド
ラスタレイヤ
Scale
文字列
TIN Creation Layers
ベクタ地物
ベクタフィールド
ベクタレイヤ
Vector Tile Writer Layers
注釈
Hovering with the mouse over the inputs will show a tooltip with additional information.
When double-clicking on an element, a dialog is shown that lets you define its characteristics. Depending on the parameter, the dialog will contain at least one element (the description, which is what the user will see when executing the model). For example, when adding a numerical value, as can be seen in the next figure, in addition to the description of the parameter, you have to set a default value and the range of valid values.
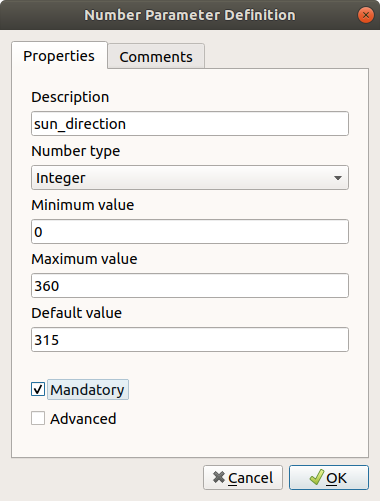
図 23.17 モデルパラメーター定義
You can define your input as mandatory for your model by checking the

Mandatory option and by checking the 
Advanced
checkbox you can set the input to be within the Advanced section. This is
particularly useful when the model has many parameters and some of them are not
trivial, but you still want to choose them.
The Comments tab allows you to tag the input with more information,
to better describe
the parameter. Comments are visible only in the modeler canvas and not in the
final algorithm dialog.
For each added input, a new element is added to the modeler canvas.

図 23.18 モデルパラメータ
You can also add inputs by dragging the input type from the list and dropping it at the position where you want it in the modeler canvas. If you want to change a parameter of an existing input, just double click on it, and the same dialog will pop up.
23.5.2. ワークフローの定義
In the following example we will add two inputs and two algorithms. The aim of
the model is to copy the elevation values from a DEM raster layer to a line layer
using the Drape algorithm, and then calculate the total ascent of the line
layer using the Climb Along Line algorithm.
In the Inputs tab, choose the two inputs as Vector Layer for the line and
Raster Layer for the DEM.
We are now ready to add the algorithms to the workflow.
Algorithms can be found in the Algorithms panel, grouped much in the same way as they are in the Processing toolbox.
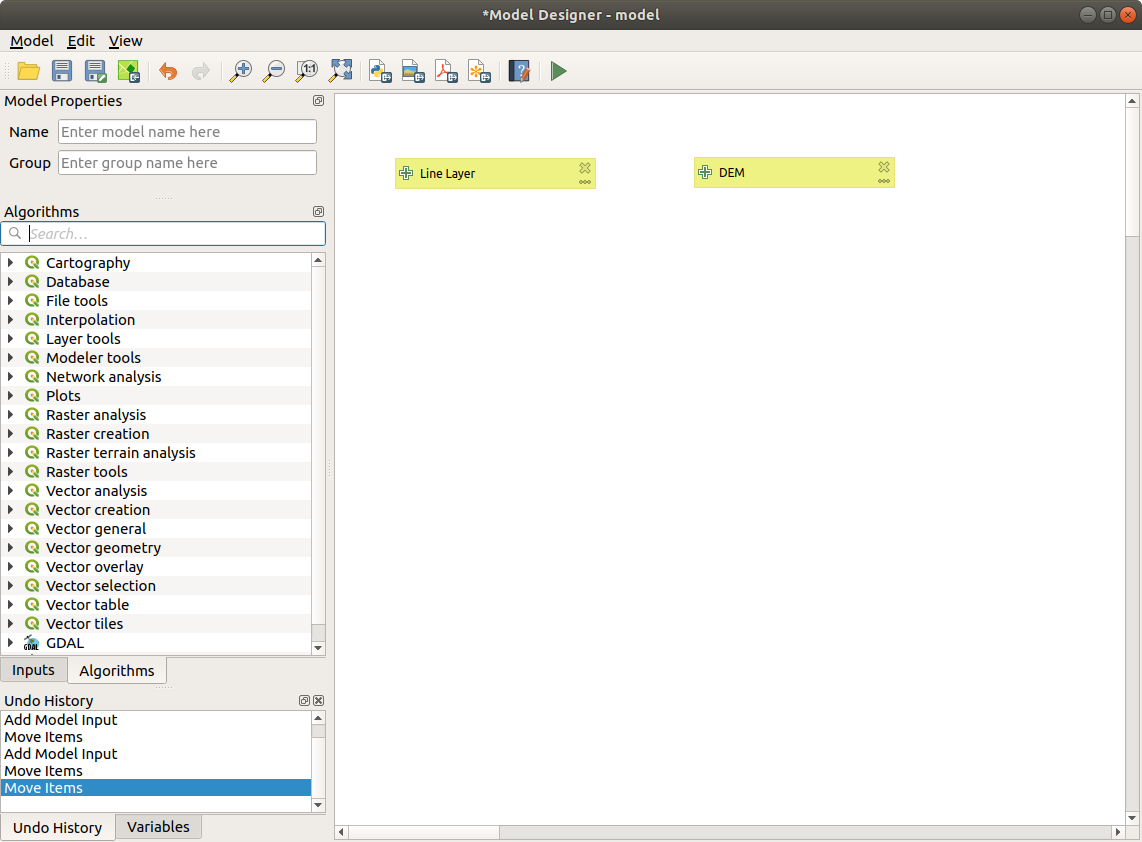
図 23.19 モデル入力
To add an algorithm to a model, double-click on its name or drag and
drop it, just like for inputs. As for the inputs you can change the description
of the algorithm and add a comment.
When adding an algorithm, an execution dialog will appear, with a content similar
to the one found in the execution panel that is shown when executing the
algorithm from the toolbox.
The following picture shows both the Drape (set Z value from raster) and the
Climb along line algorithm dialogs.
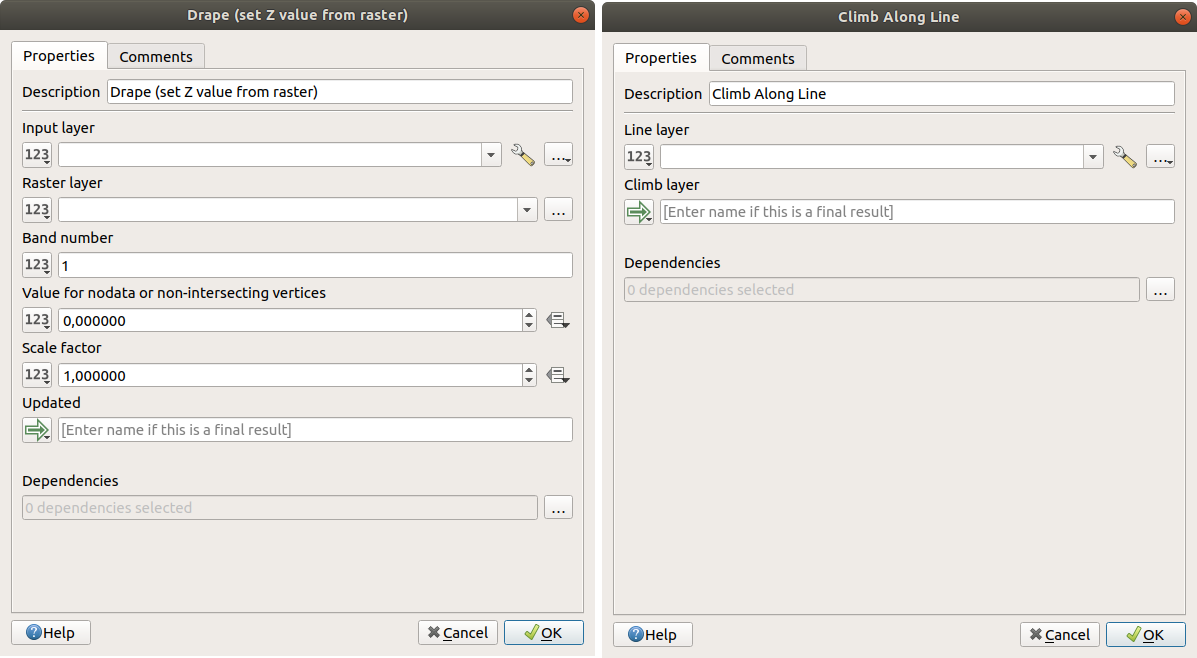
図 23.20 モデルアルゴリズムパラメーター
As you can see there are some differences.
You have four choices to define the algorithm inputs:

Value: allows you to set the parameter from a loaded layer in the QGIS project or to browse a layer from a folder
Pre-calculated Value: with this option you can open the Expression Builder and define your own expression to fill the parameter. Model inputs together with some other layer statistics are available as variables and are listed at the top of the Search dialog of the Expression Builder
Model Input: choose this option if the parameter comes from an input of the model you have defined. Once clicked, this option will list all the suitable inputs for the parameter
Algorithm Output: is useful when the input parameter of an algorithm is an output of another algorithm
Algorithm outputs have the addditional 
Model Output
option that makes the output of the algorithm available in the model.
If a layer generated by the algorithm is only to be used as input to another algorithm, don't edit that text box.
In the following picture you can see the two input parameters defined as
Model Input and the temporary output layer:
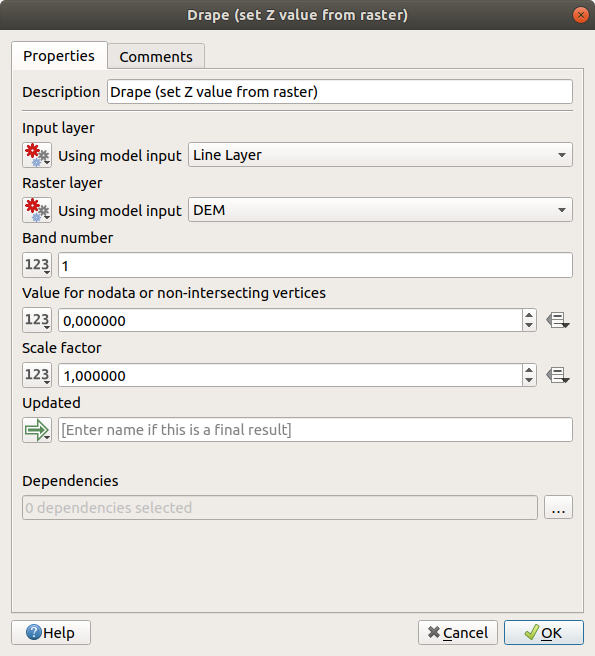
図 23.21 Algorithm Input and Output parameters
In all cases, you will find an additional parameter named Dependencies that is not available when calling the algorithm from the toolbox. This parameter allows you to define the order in which algorithms are executed, by explicitly defining one algorithm as a parent of the current one. This will force the parent algorithm to be executed before the current one.
When you use the output of a previous algorithm as the input of your algorithm, that implicitly sets the previous algorithm as parent of the current one (and places the corresponding arrow in the modeler canvas). However, in some cases an algorithm might depend on another one even if it does not use any output object from it (for instance, an algorithm that executes a SQL sentence on a PostGIS database and another one that imports a layer into that same database). In that case, just select the previous algorithm in the Dependencies parameter and they will be executed in the correct order.
Once all the parameters have been assigned valid values, click on OK and the algorithm will be added to the canvas. It will be linked to the elements in the canvas (algorithms or inputs) that provide objects that are used as inputs for the algorithm.
Elements can be dragged to a different position on the canvas. This is useful to make the structure of the model more clear and intuitive. You can also resize elements. This is particularly useful if the description of the input or algorithm is long.
Links between elements are updated automatically and you can see a plus button at the top and at the bottom of each algorithm. Clicking the button will list all the inputs and outputs of the algorithm so you can have a quick overview.
You can zoom in and out by using the mouse wheel.
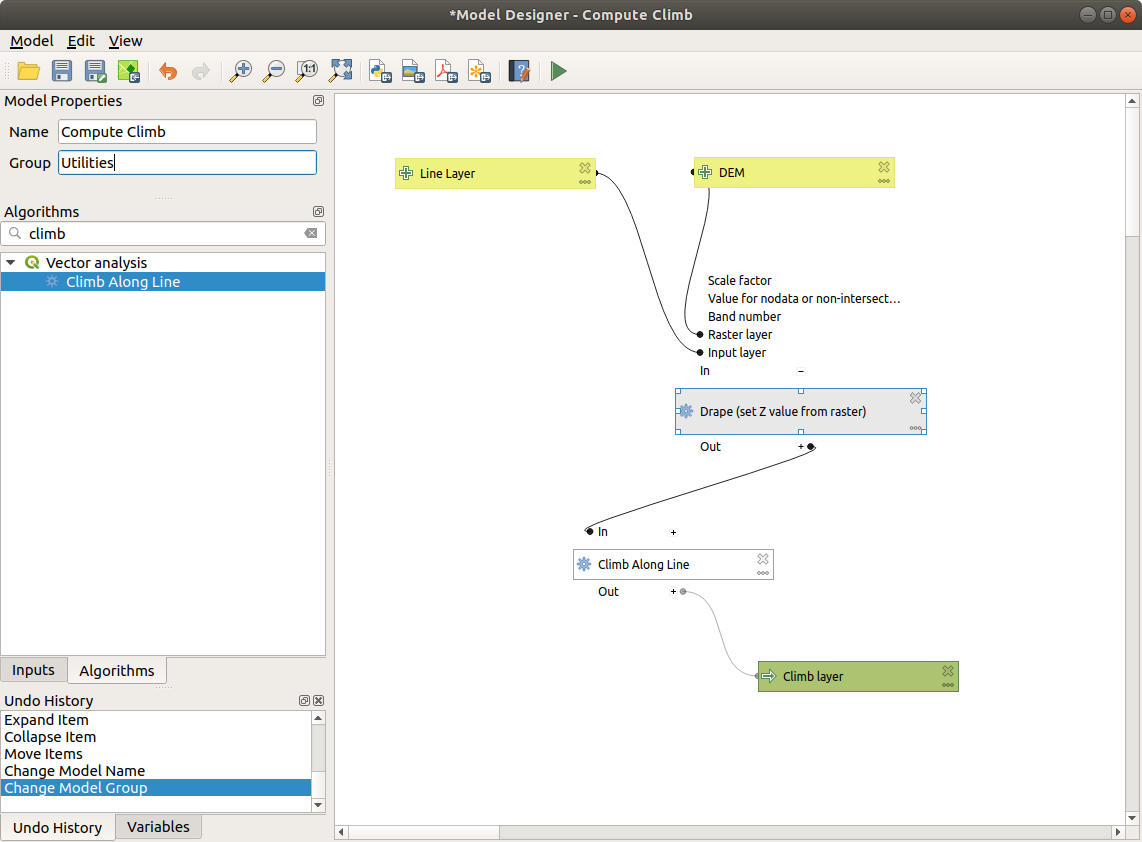
図 23.22 A complete model
You can run your algorithm any time by clicking on the  button.
In order to use the algorithm from the toolbox, it has to be saved
and the modeler dialog closed, to allow the toolbox to refresh its
contents.
button.
In order to use the algorithm from the toolbox, it has to be saved
and the modeler dialog closed, to allow the toolbox to refresh its
contents.
23.5.3. Interacting with the canvas and elements
You can use the  ,
,  ,
,  and
and  buttons
to zoom the modeler canvas. The behavior of the buttons is basically the same
of the main QGIS toolbar.
buttons
to zoom the modeler canvas. The behavior of the buttons is basically the same
of the main QGIS toolbar.
The Undo History panel together with the  and
and  buttons are
extremely useful to quickly rollback to a previous situation. The
buttons are
extremely useful to quickly rollback to a previous situation. The Undo History
panel lists everything you have done when creating the workflow.
You can move or resize many elements at the same time by first selecting them, dragging the mouse.
If you want to snap the elements while moving them in the canvas you can choose .
The menu contains some very useful options to interact with your model elements:
 Select All: select all elements of the model
Snap Selected Components to Grid: snap and align the elements into a grid- Undo: undo the last action
- Redo: redo the last action
 Cut: cut the selected elements
 Copy: copy the selected elements
 Paste: paste the elements
 Delete Selected Components: delete all the selected
elements from the model
Delete Selected Components: delete all the selected
elements from the modelAdd Group Box: add a draggable box to the canvas. This feature is very useful in big models to group elements in the modeler canvas and to keep the workflow clean. For example we might group together all the inputs of the example: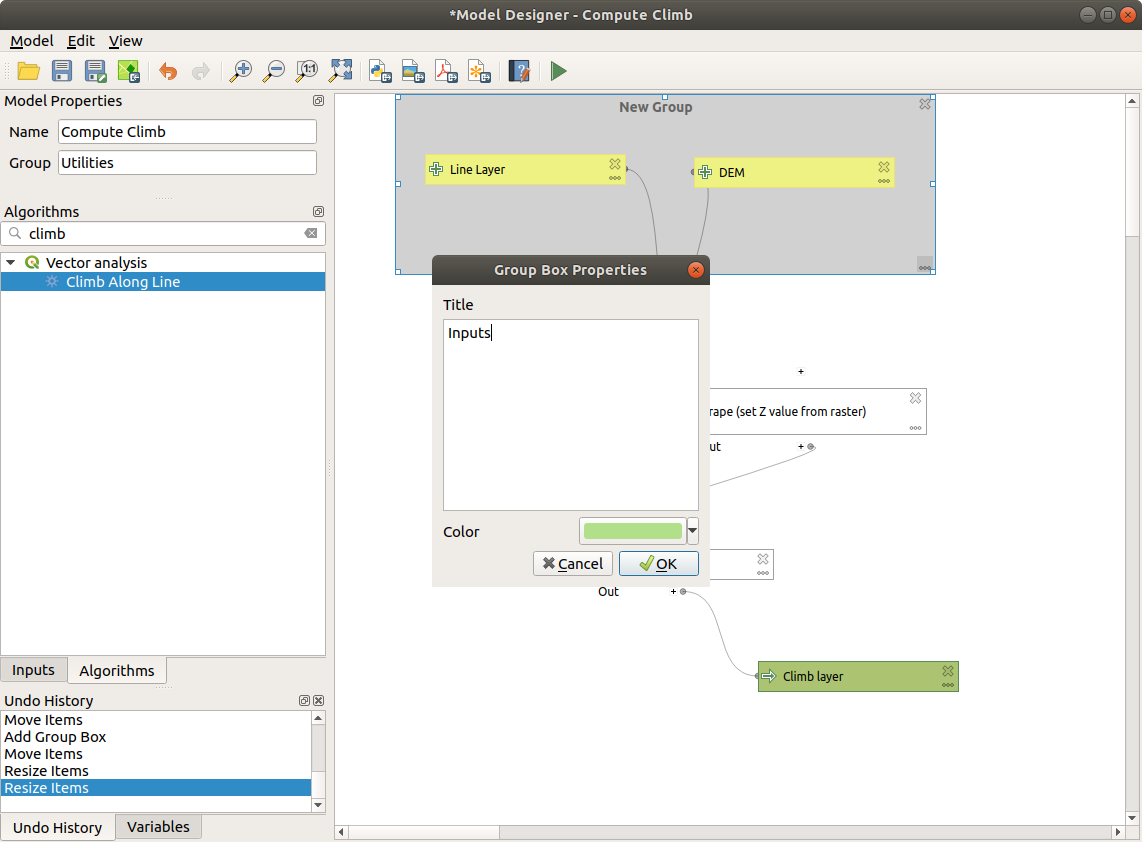
図 23.23 Model Group Box
You can change the name and the color of the boxes. Group boxes are very useful when used together with . This allows you to zoom to a specific part of the model.
You might want to change the order of the inputs and how they are listed in the
main model dialog. At the bottom of the Input panel you will find the
Reorder Model Inputs... button and by clicking on it a new dialog pops up
allowing you to change the order of the inputs:
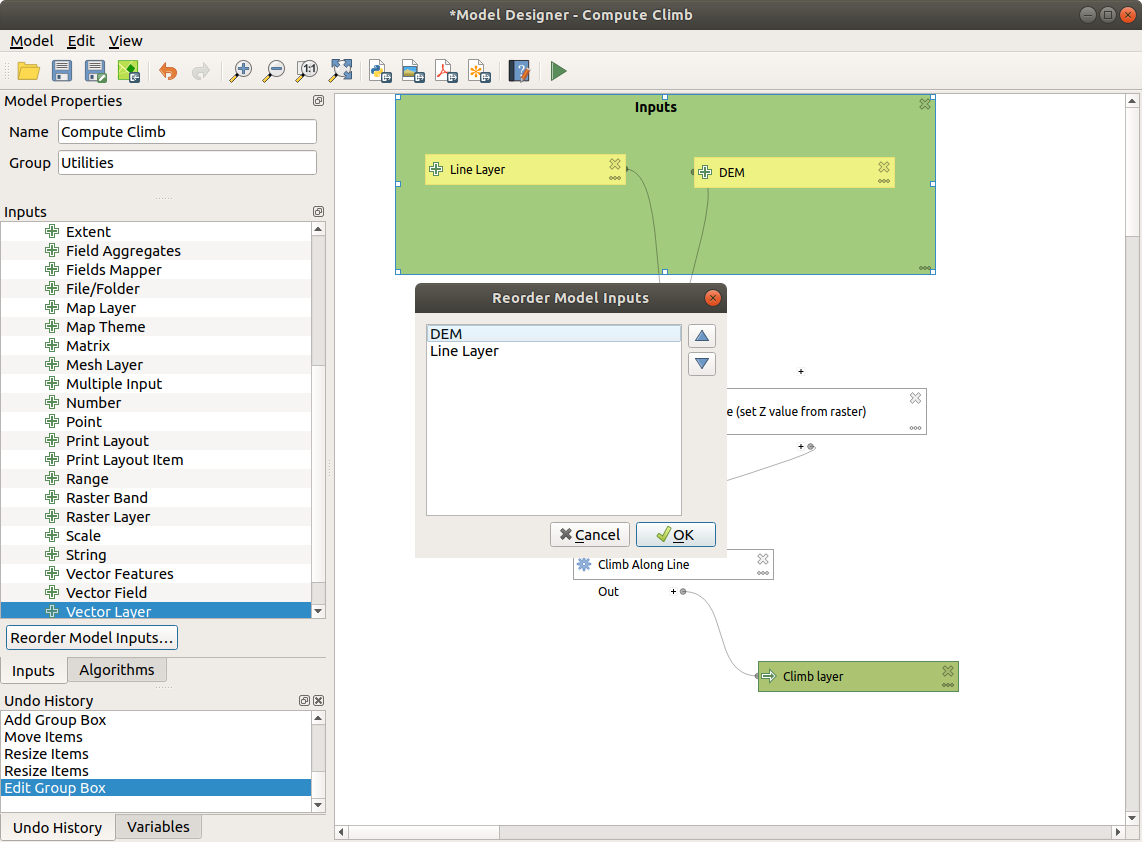
図 23.24 Reorder Model Inputs
23.5.4. モデルを保存したりロードする
Use the  Save model button to save the current model and the
 Open Model button to open a previously saved model.
Models are saved with the
Open Model button to open a previously saved model.
Models are saved with the .model3 extension.
If the model has already been saved from the modeler window,
you will not be prompted for a filename.
Since there is already a file associated with the model, that file
will be used for subsequent saves.
Before saving a model, you have to enter a name and a group for it in the text boxes in the upper part of the window.
Models saved in the models folder (the default folder when you
are prompted for a filename to save the model) will appear in the
toolbox in the corresponding branch.
When the toolbox is invoked, it searches the models folder for
files with the .model3 extension and loads the models they
contain.
Since a model is itself an algorithm, it can be added to the toolbox
just like any other algorithm.
Models can also be saved within the project file using the
 Save model in project button.
Models saved using this method won't be written as
Save model in project button.
Models saved using this method won't be written as .model3 files
on the disk but will be embedded in the project file.
Project models are available in the
 Project models menu of the toolbox.
モデルフォルダは モデラー グループ下、処理設定ダイアログから設定できます。
Models loaded from the models folder appear not only in the
toolbox, but also in the algorithms tree in the Algorithms
tab of the modeler window.
That means that you can incorporate a model as a part of a bigger model,
just like other algorithms.
Models will show up in the Browser panel and can be run from there.
23.5.4.1. Exporting a model as an image, PDF or SVG
A model can also be exported as an image, SVG or PDF (for illustration
purposes) by clicking  Export as image,
 Export as PDF or
  Export as SVG.
23.5.5. モデルを編集する
You can edit the model you are currently creating, redefining the workflow and the relationships between the algorithms and inputs that define the model.
If you right-click on an algorithm in the canvas, you will see a context menu like the one shown next:
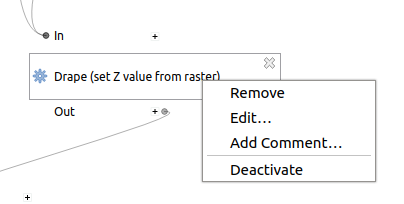
図 23.25 モデラー右ボタンクリック
削除 オプションを選択すると選択されているアルゴリズムを削除できます。アルゴリズムは他のアルゴリズムからの依存がなければ削除できます。つまり、アルゴリズムからの出力が別のアルゴリズムの入力として使用されていない場合。他のアルゴリズムからの依存があるアルゴリズムを削除しようとすると、以下のような警告メッセージが表示されます:
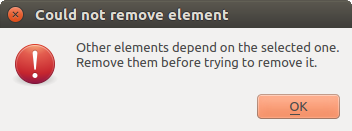
図 23.26 アルゴリズムを削除できない
Selecting the Edit... option will show the parameter dialog of the algorithm, so you can change the inputs and parameter values. Not all input elements available in the model will appear as available inputs. Layers or values generated at a more advanced step in the workflow defined by the model will not be available if they cause circular dependencies.
Select the new values and click on the OK button as usual. The connections between the model elements will change in the modeler canvas accordingly.
The Add comment... allows you to add a comment to the algorithm to better describe the behavior.
A model can be run partially by deactivating some of its algorithms. To do it, select the Deactivate option in the context menu that appears when right-clicking on an algorithm element. The selected algorithm, and all the ones in the model that depend on it will be displayed in grey and will not be executed as part of the model.
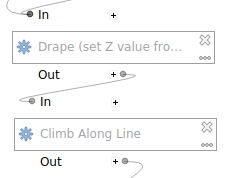
図 23.27 無効化されたアルゴリズムを使用したモデル
When right-clicking on an algorithm that is not active, you will see a Activate menu option that you can use to reactivate it.
23.5.6. モデルヘルプファイルとメタ情報を編集する
You can document your models from the modeler itself.
Click on the  Edit model help button, and a
dialog like the one shown next will appear.
Edit model help button, and a
dialog like the one shown next will appear.
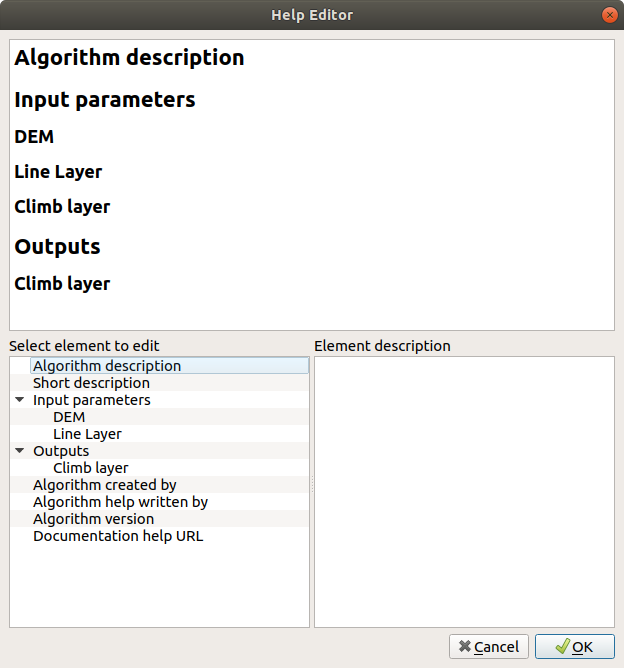
図 23.28 Editing Help
右側には、単純なHTMLページが表示されます、モデルまたはその作者の一般的な説明のようないくつかの追加のアイテムと一緒に、アルゴリズムの入力パラメーターと出力の記述を使用して作成しました。ヘルプエディタを初めて開いたときには、これらすべての記述が空になっているが、ダイアログの左側にある要素を使用して編集できます。上部の要素を選択し、下のテキストボックスにその説明を記述します。
モデルヘルプはモデル自体の一部として保存されます。
23.5.7. Pythonスクリプトとしてモデルを出力する
As we will see in a later chapter, Processing algorithms can be called from the QGIS Python console, and new Processing algorithms can be created using Python. A quick way to create such a Python script is to create a model and then export it as a Python file.
To do so, click on the  Export as Script Algorithm...
in the modeler canvas or right click on the name of the model in the Processing
Toolbox and choose Export Model as Python Algorithm....
Export as Script Algorithm...
in the modeler canvas or right click on the name of the model in the Processing
Toolbox and choose Export Model as Python Algorithm....
23.5.8. 利用可能なアルゴリズムについて
You might notice that some algorithms that can be executed from the toolbox do not appear in the list of available algorithms when you are designing a model. To be included in a model, an algorithm must have the correct semantic. If an algorithm does not have such a well-defined semantic (for instance, if the number of output layers cannot be known in advance), then it is not possible to use it within a model, and it will not appear in the list of algorithms that you can find in the modeler dialog.