Svarbu
Vertimas yra bendruomenės pastangos, prie kurių jūs galite prisijungti. Šis puslapis šiuo metu išverstas 78.16%.
12. Bendri įrankiai
12.1. Kontekstinė pagalba
Kai jums reikia pagalbos konkrečia tema, jūs galite žiūrėti atitinkamą Naudotojo vadovo puslapį per mygtuką Pagalba, kurį rasite daugumoje dialogų — prašome pastebėti, kad trečiųjų šalių priedai gali nukreipti jus į savo svetainių puslapius.
12.2. Skydeliai
Pagal nutylėjimą QGIS darbui teikia daug skydelių. Kai kurie iš jų aprašomi žemiau, o kitus galima rasti kitose dokumentacijos dalyse. Pilną QGIS teikiamų numatytųjų skydelių sąrašą galima rasti meniu ir rasti juos paminėtus skyriuje Skydeliai.
12.2.1. Sluoksnių skydelis
Skydelyje Sluoksniai (dar žinomame kaip žemėlapio legenda) yra visų projekto sluoksnių sąrašas ir jis padeda jums valdyti jų matomumą bei žemėlapio išvaizdą. Jūs galite įjungti ir išjungti šį skydelį spausdami Ctrl+1.
QGIS suteikia daugybę būdų pridėti sluoksnius į projektą:
naudojant mygtuką Pridėti iš konkretaus duomenų tiekėjo kortelės dialoge Duomenų šaltinių tvarkyklė
QGIS skydelyje Naršyklė ar DB tvarkyklė: spauskite du kartus, tempkite ir numeskite failus ir sluoksnius į QGIS arba naudokite kontekstinį meniu
tempkite ir numeskite failus iš operacinės sistemos failų naršyklės į QGIS
Visais šiais atvejais jūs galite atverti vieną ar daugiau sluoksnių vienu metu. Nauji sluoksniai pridedami į skydelį Sluoksniai:
jei numetami virš skydelio Sluoksniai - toje konkrečioje vietoje, kur jie paleidžiami
kitais atvejais vietoje pagal globalų nustatymą Elgsena pridedant naujus sluoksnius
o pridedant kelis sluoksnius jie rikiuojami tokia tvarka, kuri padidina galimybę, kad jų grupavimas logiškas ir geoobjektai kiek galima geriau matomi, naudojant tokią logiką (nuo viršaus žemyn):
vektorinių taškų sluoksniai
vektorinių linijų sluoksniai
vektorinių poligonų sluoksniai
taškų debesų sluoksniai
tinklelio sluoksniai
rastro sluoksniai
Įrankinė Sluoksnių skydelio viršuje leidžia jums:
 Atverti sluoksnių stilių skydelį (F7): įjungti ir išjungti Sluoksnių stiliaus skydelį.
 Pridėti naują grupę: žr. Sąveika su grupėmis ir sluoksniais
 Valdyti žemėlapio temas: valdyti sluoksnių matomumą ir tvarkyti juos skirtingose žemėlapio temose.
 filtruoti sluoksnius legendos medyje:
Filtruoti legendą pagal žemėlapio turinį: sluoksnių skydelyje rodomi tik sluoksniai, kurie yra nurodyti kaip matomi, ir kurių geoobjektai kerta dabartinę žemėlapio drobę. Priešingu atveju sluoksniui taikomas bendras NULL simbolis. Priklausomai nuo sluoksnio simbologijos tai yra patogus būdas identifikuoti, kurio sluoksnio geoobjektai yra jūsų dominančioje zonoje.
Rodyti privačius sluoksnius: patogus būdas rodyti ir sąveikauti su privačiais sluoksniais skydelyje Sluoksniai nekeičiant projekto nustatymų.
 Filtruoti legendą pagal išraišką: pritaikyti išraišką, kad iš pažymėtų sluoksnių medžio būtų išimti stiliai, kurie neturi geoobjektų, tenkinančių sąlygą. Tai galima naudoti paryškinti geoobjektus, kurie yra kito sluoksnio ploto/geoobjekto viduje. Iškrentančiame sąraše jūs galite keisti ar išvalyti šiuo metu taikomą išraišką.
 Išskleisti viską ar
  Sutraukti viską - išskleidžia ar sutraukia sluoksnius ir grupes sluoksnių skydelyje.

Fig. 12.1 Sluoksnių skydelio sluoksnių įrankinė
Pastaba
Įrankiai sluoksnių skydelio valdymui taipogi veikia ir žemėlapiui bei legendos elementams spausdinimo išdėstymuose
12.2.1.1. Žemėlapio temų konfigūravimas
Iškrentantis mygtukas  Tvarkyti žemėlapio temas leidžia greitai ir patogiai valdyti sluoksnių matomumą skydelyje Sluoksniai:
 Perjungti pažymėtus sluoksnius: keičia pirmo skydelyje pažymėto sluoksnio matomumą ir taiko tą būseną visiems kitiems pažymėtiems sluoksniams. Taipogi pasiekiamas naudojant klavišą Tarpas.
Perjungti pažymėtus sluoksnius nepriklausomai: keičia kiekvieno pažymėto sluoksnio matomumo būseną
Be paprasto sluoksnių matomumo valdymo, meniu Tvarkyti žemėlapio temas leidžia jums konfigūruoti Žemėlapio temas legendoje ir persijungti iš vienos žemėlapio temos į kitą. Žemėlapio tema yra dabartinės žemėlapių legendos nuotrauka, kuri atsimena:
sluoksnius, kurie pažymėti kaip matomi skydelyje Sluoksniai
ir kiekvienam matomam sluoksniui:
nuorodą į stilių, kuris pritaikytas kiekvienam sluoksniui
matomos stiliaus klasės, t.y. Sluoksnio skydelyje įjungti elementai. Tai taikoma simbologijoms, kitokioms nei vieno simbolio braižymas
sluoksnio elementų ir vidinių grupių suskleidimo/išskleidimo būsena
Norėdami sukurti žemėlapio temą:
Įjunkite sluoksnį, kurį norite rodyti
Įprastai sukonfigūruokite sluoksnio savybes (simbologiją, diagramas, užrašus…)
Išplėskite meniu apačioje ir spauskite Pridėti…, kad įrašytumėte nustatymus kaip naują projekte įdėtą stilių
Pastaba
Žemėlapio tema neatsimena dabartinių savybių detalių: įrašoma tik nuoroda į stiliaus pavadinimą, taigi kai keičiate įjungtą sluoksnį (pvz. keičiate simbologijos braižymą), informacija atnaujinama žemėlapio temoje.
Kartokite ankstesnius žingsnius tiek kiek reikia kitiems sluoksniams
Jei reikia, išplėskite ar suskleiskite grupes ar matomų sluoksnių elementus skydelyje Sluoksniai
Spauskite mygtuką
 Tvarkyti žemėlapio temas skydelio viršuje ir tada Pridėti temą…
Įveskite žemėlapio temos pavadinimą ir spauskite Gerai
Nauja tema rodoma apatinėje iškrentančio meniu  drop-down dalyje.
Galite kurti tiek žemėlapio temų, kiek reikia: kai tik dabartinė žemėlapio legendos kombinacija (matomi sluoksniai, jų aktyvumo būsena, žemėlapio legendos elementai) neatitinka esamos temos turinio, kaip nurodyta viršuje, spauskite Pridėti temą…, kad sukurtumėte naują žemėlapio temą, arba naudokite , kad pakeistumėte esamą žemėlapio temą. Galite pervadinti aktyvią žemėlapio temą naudodami Pervadinti dabartinę temą… arba naudokite mygtuką Išimti dabartinę temą, jei norite ją ištrinti.
Žemėlapio temos padeda greitai persijungti tarp skirtingų iš anksto sukonfigūruotų kombinacijų: parinkite žemėlapio temą sąraše, kad atstatytumėte jos kombinaciją. Visos sukonfigūruotos temos taipogi prieinamos ir spausdinimo išdėstymuose, kur jūs galite sukurti skirtingus žemėlapio elementus pagal konkrečias temas, nepriklausomai nuo to, kas braižoma dabartinėje pagrindinėje drobėje (žr. Žemėlapio elementų sluoksniai).
12.2.1.3. Sąveika su grupėmis ir sluoksniais
Sluoksnius legendų lange galima organizuoti į grupes. Yra keli būdai, kaip tai galima padaryti:
Spauskite
 piktogramą, kad pridėtumėte naują grupę. Įrašykite grupės pavadinimą ir spauskite Enter. Dabar spauskite esamą sluoksnį ir įtempkite jį į grupę.
Parinkite daugiau nei vieną sluoksnį, spauskite piktogramą
 . Parinkti sluoksniai automatiškai įterpiami į naują grupę.
Parinkite kelis sluoksnius, spauskite dešinį pelės mygtuką legendos lange ir parinkite Grupuoti pažymėtus. Pažymėti sluoksniai bus automatiškai įdėti į naują grupę.
Jei norite iškelti sluoksnį iš grupės, ištempkite jį arba spauskite ant jo dešinį mygtuką ir pasirinkite Iškelti iš grupės: sluoksnis bus iškeltas iš grupės ir padėtas virš jos. Grupes taipogi galima įdėti į kitas grupes. Jei sluoksnis yra tokioje kelių lygmenų grupėje, Iškelti iš grupės iškels sluoksnį iš visų grupių.
Jei norite perkelti grupę ar sluoksnį į sluoksnių skydelio viršų, arba pertempkite jį į viršų, arba pasirinkite Perkelti aukštyn. Jei šią parinktį naudosite sluoksniui grupėje, sluoksnis bus perkeltas į dabartinės grupės viršų. Parinktis Perkelti žemyn turi tą pačią logiką, tik perkelia sluoksnius ir grupes žemyn.
Grupės varnelė vienu paspaudimu parodys arba paslėps grupėje esančius sluoksnius. Laikant Ctrl varnelė taipogi įjungs ar išjungs visus sluoksnius grupėje ir pogrupiuose.
Ctrl-paspaudimas ant įjungto / išjungto sluoksnio išjungs / įjungs sluoksnį ir visus jo tėvus.
Įjungus parinktį Viena kitą išjungianti grupė, jūs grupėje vienu metu galite įjungti tik vieną sluoksnį. Kai tik tokios grupės sluoksnis įjungiamas, visi kiti sluoksniai yra išjungiami.
Galima tuo pačiu metu parinkti daugiau nei vieną sluoksnį ar grupę laikant mygtuką Ctrl ir spaudžiant ant papildomų sluoksnių. Jūs tada galite perkelti visus pažymėtus sluoksnius į naują grupę vienu metu.
Jūs taipogi galite vienu metu ištrinti daugiau nei vieną sluoksnį ar grupę, parenkant kelis elementus su Ctrl klavišu ir tada spaudžiant Ctrl+D: visi parinkti sluoksniai ar grupės bus išimti iš sluoksnių sąrašo.
Daugiau informacijos apie sluoksnius ir grupes naudojant indikatoriaus piktogramą
Kai kuriais atvejais, sluoksnių ar grupių formatavimas ar greta skydelyje Sluoksniai esančios piktogramos duoda daugiau informacijos apie sluoksnį/grupę. Šie elementai yra:
 rodo, kad sluoksnis yra redagavimo režime ir jūs galite keisti duomenis
 rodo, kad sluoksnis yra redaguojamas ir yra neįrašytų pakeitimų
 rodo, kad sluoksniui taikomas filtras. Užveskite pelę virš piktogramos, kad pamatytumėte filtro išraišką, spauskite du kartus, jei norite pakeisti užklausą
 rodo, kad sluoksniai šiame projekte yra privalomi, todėl jų negalima išimti
 identifikuoja įdėtą grupę ar sluoksnį ir kelią iki jų originalaus projekto failo
 identifikuoja sluoksnį, kurio duomenų šaltinis buvo neprieinamas projekto atidarymo metu (žr. Neteisingų kelių iki failų tvarkymas). Spauskite piktogramą, kad atnaujintumėte šaltinio kelią arba sluoksnio kontekstiniame meniu parinkite Taisyti duomenų šaltinį….
 primena jums, kad sluoksnis yra laikinas juodraštinis sluoksnis ir jo turinys bus išmestas, kai jūs uždarysite šį projektą. Kad išvengtumėte duomenų praradimo, paverskite sluoksnį pastoviu paspausdami piktogramą, kad įrašytumėte sluoksnį į bet kokį GDAL vektorinį formatą, palaikomą QGIS.
 identifikuoja sluoksnį, kuris naudojamas redagavimo režime neprisijungus.
 sluoksniai su koordinatėmis, laikomomis koordinačių atskaitos sistemoje, kuri iš principo turi žemą tikslumą (reikia, kad būtų įjungta atitinkama nuostata)
 identifikuoja sluoksnį, kuris turi susijusias pastabas
Pilkas pavadinimas, kai žemėlapio drobės mastelis nepatenka į sluoksnio matomų mastelių diapazoną (nustatoma savybėse). Spauskite kontekstinio meniu parinktį Didinti iki matomo mastelio, kad pakeistumėte žemėlapio mastelį iki artimiausio mastelio, kuriame sluoksnis bus matomas.
Sluoksnių braižymo kontrolė naudojant grupavimą
Grupės - tai būdas struktūrizuoti sluoksnius projekto medyje, bet jos taipogi gali įtakoti kaip braižomas jų turinys - kaip vienas objektas braižymo metu.
Tokio braižymo parinktis galima skydelyje Sluoksnio stilius, kai parinkta grupė. Kortelėje  Simbologija įjunkite
  Braižyti sluoksnius kaip grupę, kad įjungtumėte keletą parinkčių, kurios valdo bendrą vaikinių sluoksnių išvaizdą, vietoj atskirų sluoksnių:
Nepermatomumas: Vaikinių sluoksnių geoobjektai, kuriuos dengia kitas vaikinis sluoksnis liks uždengti, nepermatomumas taikomas tik „visai grupei“.

Fig. 12.2 Nepermatomumas nurodytas sluoksniams ir grupei
Piešinukas kairėje rodo du sluoksnius, kurie braižomi su 50% nepermatomumu (matomi ir žemiau esantys geoobjektai, bet pusiau uždengti 50% raudono geoobjekto viršuje). Antrame paveiksliuke matomas rezultatas, kai nepermatomumas nurodytas grupei (žemiau esančio mėlyno geoobjekto dalys yra pilnai uždengtos virš jo esančio raudono sluoksnio, o gautas rezultatas braižomas su 50% nepermatomumu).
Suliejimo režimai: Kaip ir nepermatomumas, suliejimo režimo nustatymas (pvz. daugybos, perdengimo, …) visai grupei reiškia, kad iš pradžių paruošiami vaikiniai sluoksniai, kur aukščiau esantys uždengia žemesniuosius. Braižymas tada gaunamas suliejant plokščią grupę su sluoksniais, esančiais žemiau grupės.
Kai vaikiniams sluoksniams priskirti suliejimo režimai, jis taikomas prieš išplokštinimą, bet apimtis ribojama tik tos grupės vaikiniams sluoksniams, o ne kitiems sluoksniams, esantiems žemiau visos grupės.
Grupių vaikiniams sluoksniams pateikiama daugiau suliejimo režimų jų kortelėje Simbologija, kurie atlieka stiliaus „apkarpymo“ veiksmus kitiems vaikiniams sluoksniams braižymo metu. Pavyzdžiui jūs galite apkarpyti vieno sluoksnio turinio braižymą turiniu iš kito „uždengiančio“ sluoksnio.
Sluoksnio efektai: efektai taikomi tik suplokštintam vaikinių sluoksnių vaizdui, taigi pavyzdžiui metamo šešėlio efektas bus taikomas uždengtiems vaikiniams sluoksniams.
Kai grupei nurodoma Braižyti sluoksnius kaip grupę, tada tik grupė bus rodoma skydelyje Sluoksnių rikiuotė. Grupių vaikai nebus matomi šiame rikiuotės sąraše, nes jų rikiuotę nustato grupės sluoksnio vieta.
12.2.1.4. Sluoksnio stiliaus keitimas
Skydelyje Sluoksniai jūs turite kelis variantus, kaip greitai ir paprastai pakeisti sluoksnio braižymą.
Spauskite ant sluoksnio dešinį pelės mygtuką ir parinkite , kad:
pamatytumėte šiuo metu sluoksniui galimus stilius. Jei apibrėžėte daug stilių, galite perjungti iš vieno į kitą ir jūsų sluoksnio braižymas bus automatiškai atnaujintas žemėlapio drobėje.
kopijuotumėte dalį ar visą dabartinį stilių, o, kai galima, įkeltumėte nukopijuotą stilių iš kito sluoksnio
Pervadinti dabartinį… stilių
Pridėti naują stilių (kuris yra dabartinio sluoksnio kopija)
arba Pašalinti dabartinį stilių (tik kai jau yra keli stiliai).
Patarimas
Greitai dalinkitės sluoksnio stiliumi
Kontekstiniame meniu nukopijuokite sluoksnio stilių ir įkelkite jį į grupę ar sluoksnių pažymėjimą: stilius taikomas visiems to paties tipo (vektoriniams, rastro, tinklelio, taškų debesies, …) sluoksniams, kaip pradinis sluoksnis ir, vektoriniams sluoksniams, turi tą patį geometrijos tipą (taškas, linija ar poligonas).
Kai naudojama simbologija, kuri remiasi geoobjekto klasifikacija (pvz. kategorizuota, graduota ar pagal taisykles vektoriniams sluoksniams ar klasifikuota taškų debesims), paspaudus dešinį pelės mygtuką ant klasės įrašo skydelyje Sluoksniai galima pakeisti klasių (ir jų geoobjektų) matomumą ir išvengti jų (ne)pažymėjimo po vieną:
Vektoriniams sluoksniams, klasės šakos įrašo kontekstinis meniu taipogi leidžia:
 Pažymėti geoobjektus: pažymi visus klasę atitinkančius sluoksnio geoobjektus
 Rodyti atributų lentelėje: atidaro atributų lentelę, kurioje filtruoti tik atitinkančios klasės geoobjektai
keisti simbolio spalvą naudojant Spalvos ratą. Patogumui, spalvų rato apačioje taipogi galima pasirinkti ir iš paskutinių naudotų spalvų.
Keisti simbolį…: atveria dialogą Simbolio parinkimas, leidžiantį keisti geoobjekto simbolį (simbolį, dydį, spalvą…).
Kopijuoti simbolį
Įkelti simbolį
Patarimas
Du kartus paspaudus klasės lapo įrašą taipogi atveriamas dialogas Simbolio parinkimas.
12.2.2. Sluoksnio stiliaus skydelis
Skydelis Sluoksnio stilius (dar įjungiamas su Ctrl+3) yra greitas kelias iki to paties funkcionalumo, kaip ir randamam dialoge Sluoksnio savybės. Jis suteikia greitą ir paprastą būdą apibrėžti sluoksnio braižymą ir elgseną bei vizualizuoti rezultatus neatidarant sluoksnio savybių dialogo.
Be to, kad vengia sluoksnio savybių dialogo blokavimo (arba „modalizavimo“), sluoksnio stiliaus skydelis taip pat išvengia ekrano užgriozdinimo dialogais ir turi tik daugumą stiliaus funkcijų (spalvų parinkiklį, efektų savybes, taisyklių keitimą, užrašų pakeitimą…): pvz., paspaudus spalvų mygtukus sluoksnio stiliaus skydelių viduje, spalvos parinkimo dialogas atidaromas sluoksnio stiliaus skydelio viduje, o ne kaip atskiras dialogas.
Sluoksnio skydelyje esančiame iškrentančiame dabartinių sluoksnių sąraše parinkite elementą ir:
Priklausomai nuo aktyvaus elemento nustatykite:
 Grupių simbologiją (žr. Sluoksnių braižymo kontrolė naudojant grupavimą)
 Rastro sluoksnio simbologijos,
  permatomumo ir
  histogramos savybes. Šios parinktys tokios pačios kaip ir Raster Properties Dialog.
 Vektorinių sluoksnių simbologijos,
  užrašų,
  slėpimo ir
  3D vaizdo savybes. Šios parinktys yra tokios pačios kaip ir Vektorių savybių dialogas ir gali būti išplėsto savo savybėmis, kurias prideda trečiųjų šalių priedai.
 Tinklelio sluoksnio simbologijos ir
  3D vaizdo savybes. Šios parinktys yra tokios pačios kaip Mesh Dataset Properties.
 Taškų debesies sluoksnio simbologijos,
  3D vaizdo ir
  aukščio savybes. Šios parinktys yra tokios pačios kaip Point Clouds Properties.
Įjunkite ir konfigūruokite globalias žemėlapio šešėliavimo savybes
Tvarkykite susijusius stilius
 Stilių tvarkyklėje (daugiau informacijos Savo stilių tvarkymas).
Žiūrėkite jūsų padarytų dabartinio projekto sluoksnio pakeitimų
 Istoriją, kur galite ir atšaukti ar atstatyti bet kokią būseną parinkdami ją ir spausdami Taikyti.
Kita galinga šio skydelio savybė yra varnelė  Gyvas atnaujinimas. Įjunkite ją, jei norite, kad jūsų pakeitimai nedelsiant būtų atspindėti žemėlapio drobėje: jums daugiau nebereikės spaudyti mygtuko Taikyti.
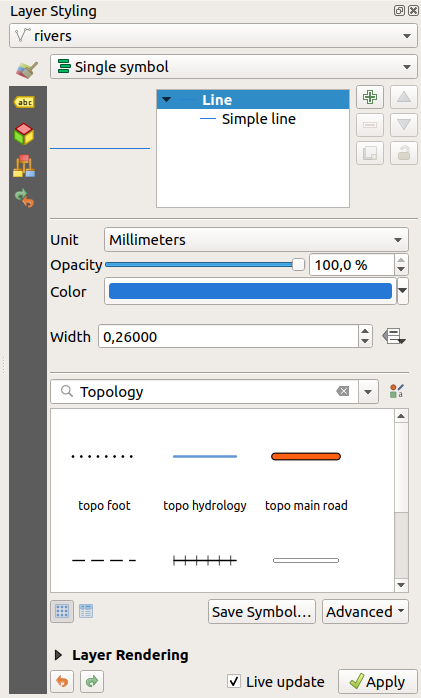
Fig. 12.3 Sluoksnio simbologijos nustatymas stilių skydelyje
12.2.3. Sluoksnių rikiuotės skydelis
Pagal nutylėjimą QGIS žemėlapio drobėje sluoksniai rodomi pagal skydelyje Sluoksniai matomą seką: kuo aukščiau šiame skydelyje yra sluoksnis, tuo aukščiau (taigi matomiau) sluoksnis bus ir žemėlapio vaizde.
Galite nustatyti sluoksnių braižymo tvarką, kuri nepriklausytų nuo sluoksnių skydelio, naudodami skydelį Sluoksnių eiliškumas, kurį galite įjungti meniu arba kombinacija Ctrl+9. Įjunkite varnelę  Valdyti braižymo eiliškumą, esančia sąrašo apačioje, kad surikiuotumėte sluoksnius taip, kaip jums reikia. Ši rikiuotė taikoma žemėlapio drobei. Pavyzdžiui Fig. 12.4, jūs matote, kaip geoobjektai
 oro uostai yra rodomi virš alaska poligono, nepriklausomai nuo to, kaip tie sluoksniai išdėstyti sluoksnių skydelyje.
Išjungus varnelę  Valdyti braižymo eiliškumą bus atstatyta numatytoji elgsena.
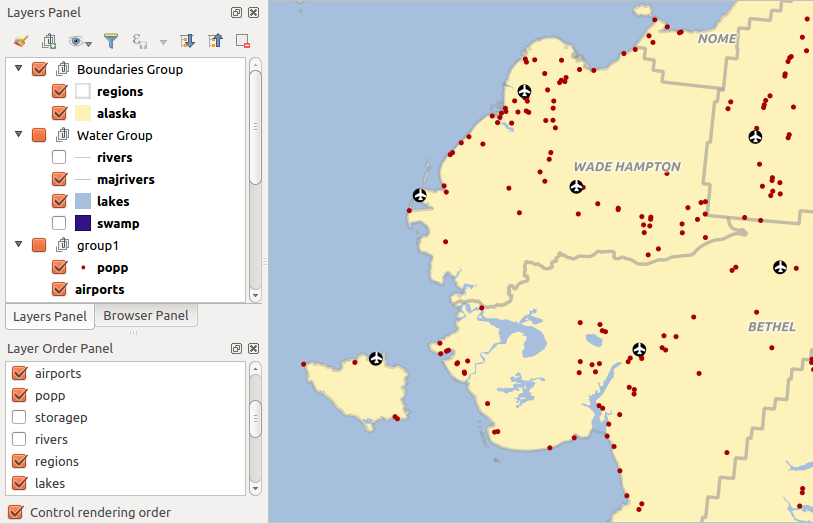
Fig. 12.4 Nuo legendos nepriklausančio sluoksnių eiliškumo nustatymas
12.2.4. Apžvalgos skydelis
Skydelis Peržiūra (Ctrl+8) rodo žemėlapį su kai kurių sluoksnių pilna apimtimi. Peržiūros žemėlapis užpildomas sluoksniais naudojant meniu ar sluoksnių kontekstiniame meniu esančią parinktį Rodyti peržiūroje. Šiame vaizde raudonas stačiakampis rodo dabartinės žemėlapio drobės apimtį, taip padedant jums greitai susiorientuoti, kurią žemėlapio vietą šiuo metu žiūrite. Jei paspausite ir tempsite raudoną stačiakampį peržiūros ribose, atitinkamai keisis ir pagrindinio žemėlapio vaizdo apimtis.
Pastebėtina, kad peržiūros žemėlapyje nebraižomi užrašai, net jei žemėlapyje sluoksniams yra sukonfigūruotas užrašų rodymas.
12.2.5. Pranešimų žurnalo skydelis
Įkeliant ar vykdant kai kuriuos apdorojimo veiksmus jūs galite sekti pranešimus, kurie pasirodo skirtingose  Pranešimų žurnalo skydelio kortelėse. Jį galima įjungti naudojant patį dešiniausią būsenos juostos mygtuką.
12.2.6. Atšaukimo/pakartojimo skydelis
Kiekvienam keičiamam sluoksniui skydelis Atšaukimas/pakartojimas (Ctrl+5) rodo visų įvykdytų veiksmų sąrašą, leidžia jums greitai atšaukti kelis veiksmus parenkant aukščiau esantį veiksmą. Daugiau informacijos rasite skyriuje apie pakeitimų atšaukimą ir pakartojimą.
12.2.7. Statistinės suvestinės skydelis
Skydelis Statistika (Ctrl+6) teikia apibendrintą bet kokio vektorinio sluoksnio informaciją. Šiame skydelyje jūs galite parinkti:
vektorinį sluoksnį, kuriam reikia skaičiuoti statistiką: jį galima parinkti iš viršutinio iškrentančio meniu arba susieta su aktyviu sluoksniu skydelyje Sluoksniai, naudojant varnelę Sekti pažymėtą sluoksnį, statistikos apačioje esančiame iškrentančiame meniu
lauką ar
 išraišką, kurią reikia naudoti kiekvienam sluoksniui, paskutinis parinkimas atsimenamas ir automatiškai skaičiuojamas vėl pažymėjus sluoksnį.
grąžinamą statistiką naudojant iškrentantį mygtuką dialogo apatiniame dešiniame kampe. Priklausomai nuo laukų (ar išraiškos reikšmių) tipo, galimos statistikos yra:
Statistika |
Tekstas |
Sveikas skaičius |
Realus skaičius |
Data |
|---|---|---|---|---|
Skaičius |
||||
Unikalių reikšmių skaičius |
||||
Trūkstamų reikšmių skaičius |
||||
Suma |
||||
Vidurkis |
||||
Standartinis nuokrypis |
||||
Standartinis nuokrypis pagal mėginį |
||||
Minimali reikšmė |
||||
Maksimali reikšmė |
||||
Diapazonas |
||||
Mažuma |
||||
Dauguma |
||||
Variacija |
||||
Pirmas kvartilis |
||||
Trečias kvartilis |
||||
Tarpkvartilinis diapazonas |
||||
Minimalus ilgis |
||||
Maksimalus ilgis |
||||
Vidutinis ilgis |
Statistikos sumos gali būti:
grąžinamos visam sluoksniui arba
 Tik parinktiems geoobjektams
 nukopijuotos į iškarpinę ir įkeltos į lentelę kitoje aplikacijoje
perskaičiuotos naudojant mygtuką
 kai pasikeičia duomenys (pvz. sukurti nauji ar pašalinti esami geoobjektai, pakeisti atributai)
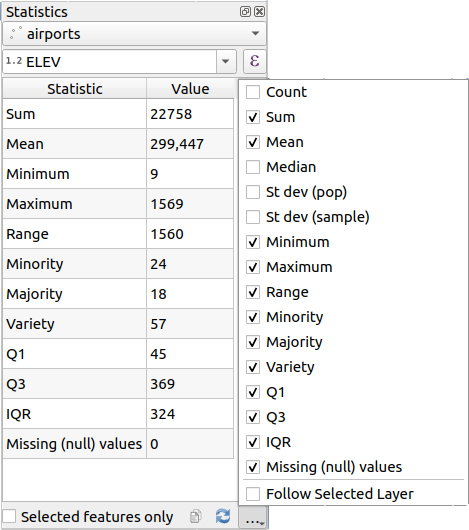
Fig. 12.5 Rodyti lauko statistiką
12.2.8. Tinkinimo/kūrimo įrankių skydelis
Skydelis Tinkinimo/kūrimo įrankiai (F12) vienoje vietoje suteikia galimybę valdyti QGIS tinkinimo veiksmus. Teikiami įrankiai organizuojami tokiose kortelėse:
 Profiliuotojas - šioje kortelėje galite pasirinkti vieną iš šių kategorijų:
Pradžia padeda diagnozuoti (ir pataisyti) pasitaikančius ilgus QGIS paleidimo laikus.
Projekto įkėlimas leidžia gauti detalią informaciją apie įvairius projekto įkėlimo etapus, kad galėtumėte identifikuoti lėto projekto įkėlimo priežastis.
Žemėlapio braižymo įrankis leidžia identifikuoti skaudančius žemėlapio braižymo taškus ir atsekti, kurie konkrečiai sluoksniai yra lėtų žemėlapio perbraižymų priežastis.
Pastaba
Priedų autoriai gali praplėsti šį skydelį savo kortelėmis, skirtomis jų pačių priedų tinkinimui ar kūrimui. Tai daroma naudojant metodą registerDevToolWidgetFactory.
12.2.8.1. Tinklo žurnalas
Kortelė  Tinklo žurnalizavimas leidžia jums įrašyti ir rodyti tinklo užklausas kartu su krūva kitos naudingos informacijos, tokios kaip užklausos ir atsakymo būsena, antraštės, klaidos, SSL konfigūracija, laikai, podėlio būsena ir t.t.
Iš viršutinės įrankinės jūs galite:
 Įrašyti žurnalą…: iš pradžių parodys didelį įspėjimą, kad žurnalas yra jautrus ir turi būti laikomas konfidencialiu, o tada leis jums įrašyti žurnalą.
Spauskite iškrentantį meniu
 Nustatymai, kad parinktumėte ar norite Rodyti sėkmingas užklausas, Rodyti laikus ir Rodyti atsakymus, paimtus iš podėlio.
 Išjungti podėlį: išjungs podėlį, kad kiekviena užklausa būtų vykdoma.
 Filtruoti užklausas pagal URL eilučių iškarpas arba užklausos būseną
Paspaudę dešinį pelės mygtuką ant užklausos jūs galite:
Atverti URL, kuris atvers URL jūsų numatytoje naršyklėje.
Kopijuoti URL
Kopijuoti kaip cURL, kad galėtumėte tai panaudoti terminale.
Kopijuoti kaip JSON: kopijuoja medžio reikšmes kaip json eilutę į iškarpinę, lengvam įkėlimui į rinktų pranešimus ar nutolusiai pagalbai.
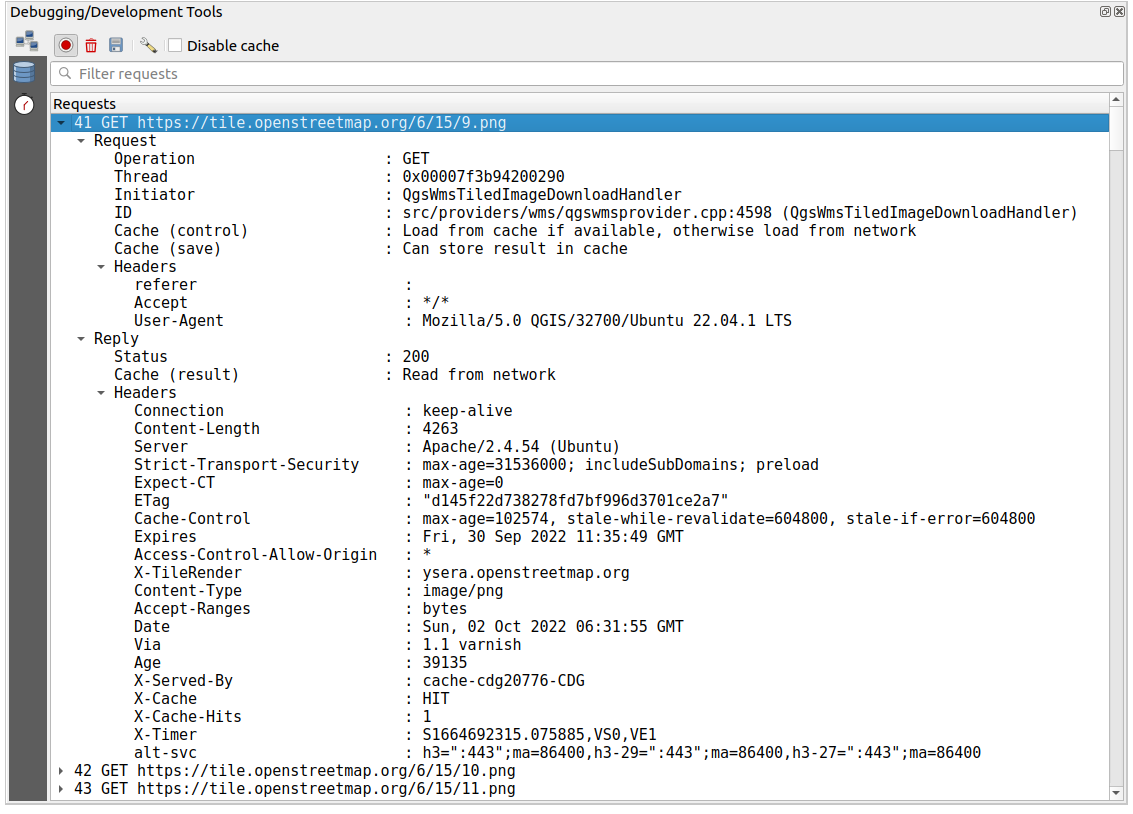
Fig. 12.6 GET užklausos tinklo žurnalo išvestis
12.2.8.2. Užklausų žurnalas
 Užklausų žurnalas yra vieta, kur surašomos visos duomenų tiekėjų ir jungčių API į duomenų bazę siunčiamos SQL komandos ir jų vykdymo laikai, pamatuoti QGIS (t.y. kliento, kuris siunčia komandas). Tai gali būti naudinga tiriant greitaveiką ar konkretų sluoksnį QGIS algoritmo ar priedo tinkinimo metu.
Iš viršutinės įrankinės jūs galite:
 Įrašyti žurnalą…: iš pradžių parodys didelį įspėjimą, kad žurnalas yra jautrus ir turi būti laikomas konfidencialiu, o tada leis jums įrašyti žurnalą.
 Filtruoti užklausas pagal užklausos teksto poaibius ar detales, tokias kaip tiekėjo tipas, pradžios laikas, iniciatorius, …
Spauskite praneštą užklausą ir jūs galėsite:
Kopijuoti SQL komandą, išsiųsta iš QGIS į duomenų bazę
Kopijuoti kaip JSON: kopijuoja medžio reikšmes kaip json eilutę į iškarpinę, lengvam įkėlimui į rinktų pranešimus ar nutolusiai pagalbai.
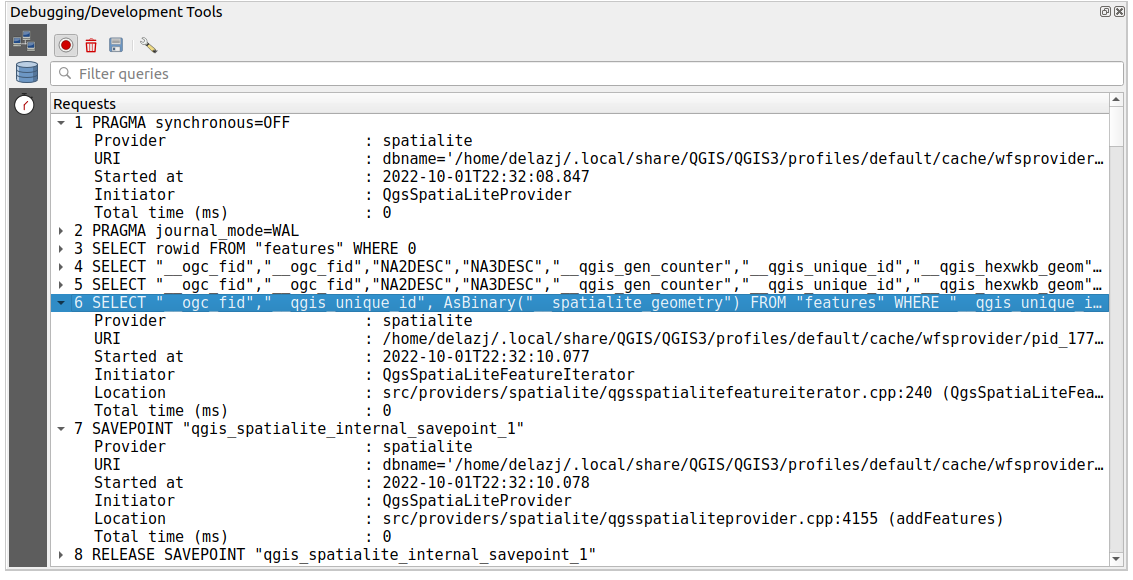
Fig. 12.7 Užklausų žurnalo išvestis
12.2.8.3. Profiliuotojas
Kortelė ![]() Profiliuotojas leidžia gauti informaciją, per kiek laiko atliekama kiekviena operacija naudotojo iškviestame veiksme. Priklausomai nuo konteksto, šios operacijos gali būti nustatymų ar meniu skaitymas, žemėlapio drobės ar 3D vaizdo kūrimas, sluoksnių priklausomybių sprendimas, žymelių ar išdėstymų įkėlimas, … Tai padeda identifikuoti lėto įkėlimo laiko priežastis.
Profiliuotojas leidžia gauti informaciją, per kiek laiko atliekama kiekviena operacija naudotojo iškviestame veiksme. Priklausomai nuo konteksto, šios operacijos gali būti nustatymų ar meniu skaitymas, žemėlapio drobės ar 3D vaizdo kūrimas, sluoksnių priklausomybių sprendimas, žymelių ar išdėstymų įkėlimas, … Tai padeda identifikuoti lėto įkėlimo laiko priežastis.
Numatytieji palaikomi veiksmai gali būti parinkti iškrentančiame meniu Kategorijos:
QGIS Pradžia
Projekto įkėlimas
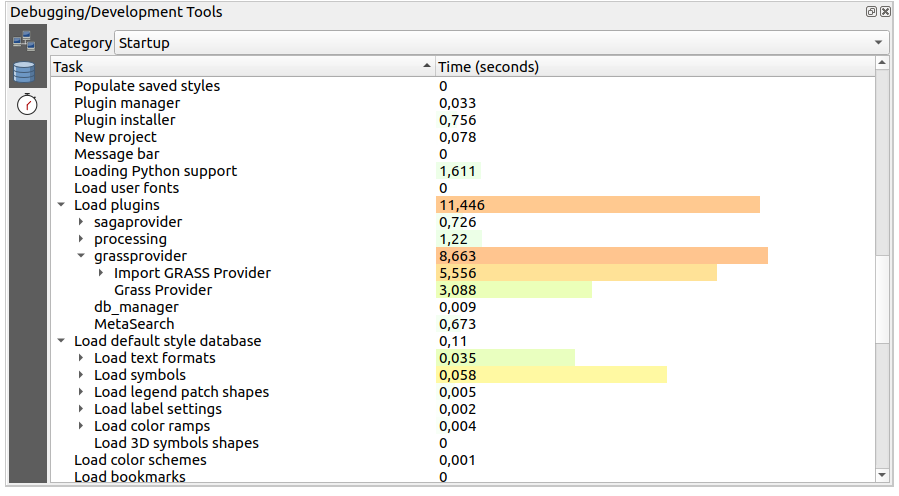
Fig. 12.8 QGIS pradžios profilis
12.3. Išorinių projektų sluoksnių įtraukimas
Kartais prireikia kai kuriuos sluoksnius laikyti skirtinguose projektuose, bet su tuo pačiu stiliumi. Jūs galite arba šiems sluoksniams sukurti numatytąjį stilių, arba įtraukti juos iš kito projekto ir taip sutaupyti laiką ir pastangas.
Esamo projekto sluoksnių įtraukimas turi kai kurių pranašumų lyginant su stiliaus naudojimu:
Gali būti pridėti visų tipų sluoksniai (vektoriniai ir rastro, vietiniai ar internetiniai…)
Ištraukiant grupes ir sluoksnius jūs galite išlaikyti tą pačią „fono“ sluoksnių medžio struktūrą skirtinguose projektuose
Nors įtraukti sluoksniai gali būti redaguojami, jūs negalite pakeisti jų savybių, tokių kaip simbologijos, etikečių, formų, numatytųjų reikšmių ir veiksmų, taip užtikrinant nuoseklumą tarp projektų
Pakeiskite elementus pradiniame projekte ir visi pakeitimai bus išplatinti į visus kitus projektus
Jei norite įtraukti turinį iš kitų projektų failų į jūsų projektą, parinkite :
Spauskite mygtuką …, kad rastumėte projektą: jūs galite matyti projekto turinį (žr. Fig. 12.9)
Laikykite Ctrl (ar
 Cmd) ir spauskite ant sluoksnių ar grupių, kuriuos norite ištraukti
Sauskite Gerai
Pažymėti sluoksniai ir grupės įtraukiami į skydelį Sluoksniai ir rodomi žemėlapio drobėje. Prie jų pavadinimo pridedama piktograma  , kad būtų galima atskirti, o užvedus virš jų pelę bus rodomas kelias iki originalaus projekto.
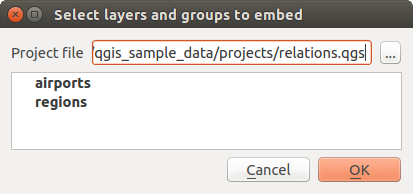
Fig. 12.9 Parinkite įtraukiamus sluoksnius ir grupes
Kaip bet kurį kitą sluoksnį, įtrauktą sluoksnį galima išimti iš projekto paspaudus ant sluoksnio dešinį pelės mygtuką ir parinkus  Išimti.
Patarimas
Įtraukto sluoksnio braižymo pakeitimas
Įtraukto sluoksnio braižymo keisti negalima, nebent jūs pakeitimus darysite pradiniame projekte. Bet jūs galite spausti ant sluoksnio dešinį pelės mygtuką ir parinkti Kurti sluoksnio dublį bei taip sukurti sluoksnį, kuris yra pilnavertis ir nebepriklauso nuo pradinio projekto. O tada jau galite saugiai išimti susietą sluoksnį.
12.4. Sąveika su geoobjektais
12.4.1. Geoobjektų pažymėjimas
QGIS teikia kelis įrankius geoobjektų žymėjimui žemėlapio drobėje. Žymėjimo įrankius rasite meniu arba Pažymėjimo įrankinėje.
Pastaba
Pažymėjimo įrankiai veikia su šiuo metu aktyviu sluoksniu.
12.4.1.1. Rankinis žymėjimas žemėlapio drobėje
Kad pažymėtumėte vieną ar daugiau geoobjektų pele, galite naudoti vieną iš šių įrankių:
Pastaba
Visi įrankiai, išskyrus  Parinkti geoobjektus poligonu, leidžia jums parinkti geoobjektą(us) žemėlapio drobėje vienu paspaudimu.
Pastaba
Naudokite įrankį  Parinkti geoobjektus poligonu, jei norite naudoti esamą poligono geoobjektą (iš bet kokio sluoksniu) aktyvaus sluoksnio persidengiančių geoobjektų pažymėjimui. Spauskite dešiniu pelės mygtuku poligoną ir parinkite jį iš kontekstinio meniu, kuriame rodoma sąrašas visų poligonų, esančių paspaudimo taške. Bus pažymėti visi persidengiantys aktyvaus sluoksnio objektai.
Patarimas
Naudokite meniu , kad pakartotumėte jūsų paskutinį parinkimą. Labai naudinga, kai jūs sunkiai dirbote, kad pažymėtumėte daug geoobjektų, o tada netyčia paspaudėte kitur ir išvalėte jūsų pažymėjimą.
Kai naudojate įrankį  Parinkti geoobjektą(us), laikykite Shift ar Ctrl, kad perjungtumėte, ar geoobjektas parinktas (t.y. arba prideda, arba išima jį iš dabartinio parinkimo).
Kitiems įrankiams galimos skirtingos elgsenos, laikant:
Shift: pridėti geoobjektus į dabartinį parinkimą
Ctrl: išimti geoobjektus iš dabartinio parinkimo
Ctrl+Shift: sukirsti su dabartiniu parinkimu, t.y. palikti tik persidengiančius dabartinio parinkimo geoobjektus
Alt: parinkti visus geoobjektus, kurie yra pilnai parinkimo formoje. Naudojant kartu su mygtukais Shift ar Ctrl jūs galite pridėti ar išimti geoobjektos į/iš dabartinį parinkimą.
12.4.1.2. Automatinis parinkimas
Kiti pažymėjimo įrankiai, dauguma iš kurių pasiekiami iš Atributų lentelės, vykdo parinkimą pagal geoobjekto atributų arba jo pažymėjimo būseną (pastebėtina, kad atributų lentelė ir žemėlapio drobė rodo tą pačią informaciją, taigi jei jūs parenkate geoobjektą atributų lentelėje, tai ji bus parinkta ir žemėlapio drobėje):
 Parinkti pagal išraišką… parinkti geoobjektus naudojant išraiškų dialogą
 Nužymėti geoobjektus visuose sluoksniuose arba spauskite Ctrl+Alt+A, kad nužymėtumėte visus parinktis geoobjektus visuose sluoksniuose
 Nužymėti geoobjektus dabartiniame aktyviame sluoksnyje arba spauskite Ctrl+Shift+A
 Parinkti visus geoobjektus arba spauskite Ctrl+A, kad parinktumėte visus dabartinio sluoksnio geoobjektus
 Invertuoti geoobjektų parinkimą, kad invertuotumėte dabartinio sluoksnio parinkimą
 Parinkti pagal vietą, kad parinktumėte geoobjektus pagal jų erdvinę sąsają su kitais geoobjektais (tame pačiame arba kitame sluoksnyje - žr. Select by location)
 Parinkti pagal atstumą, kad parinktumėte geoobjektus, kurie yra nurodytu atstumu nuo atskaitos geoobjekto - žr. Select within distance)
Pavyzdžiui, jei norite rasti regionus, kurių tipas yra „boroughs“ iš QGIS pavyzdinio failo regions.shp, jūs galite:
Išplėsti grupę Laukai ir reikšmės
Du kartus spausti lauką, pagal kurį norite filtruoti („TYPE_2“)
Spausti viršutiniame dešiniame skydelyje Visos unikalios
Sąraše spausti „Borough“. Redaktoriaus lauke Išraiška įrašyti tokią užklausą:
"TYPE_2" = 'Borough'
Spausti Parinkti geoobjektus
Išraiškų kūrimo dialoge jūs taipogi galite naudoti , kad parinktumėte tai, ką naudojote anksčiau. Dialogas atsimena 20 paskutinių naudotų išraiškų. Daugiau informacijos ir pavyzdžių rasite Expressions.
Patarimas
Įrašykite jūsų parinkimą į naują failą
Naudotojai gali įrašyti parinktus geoobjektus į Naują laikiną juodraštinį sluoksnį arba Naują vektorinį sluoksnį naujant ir tada nurodant norimą formatą.
12.4.1.3. Parinkti geoobjektus pagal reikšmę
Šis parinkimo įrankis atveria sluoksnio geoobjekto formą ir leidžia naudotojui pasirinkti, kokios reikšmės ieškoti kuriame lauke, ar paiešką atlikti atsižvelgiant į raidžių dydį ir koks turėtų būti naudojamas veiksmas. Įrankis turi automatinį užbaigimą, automatiškai užbaigiantį paieškos laukus esamomis reikšmėmis.
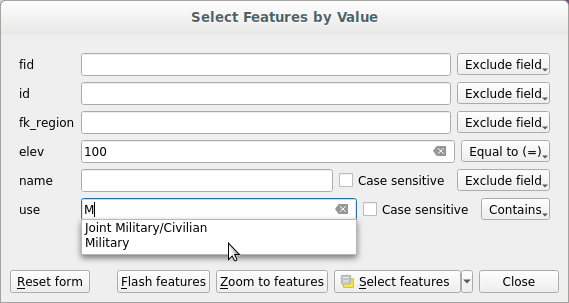
Fig. 12.10 Geoobjektų filtravimas/parinkimas naudojant formos dialogą
Greta kiekvieno lauko yra iškrentantis sąrašas su parinktimis, valdančiomis paieškos elgseną:
Lauko paieškos variantas |
Tekstas |
Numeric |
Data |
|---|---|---|---|
Išimti lauką iš paieškos |
|||
Lygu (=) |
|||
Nelygu (≠) |
|||
Daugiau už (>) |
|||
Mažiau už (<) |
|||
Daugiau arba lygu (≥) |
|||
Mažiau arba lygu (≤) |
|||
Tarp (imtinai) |
|||
Ne tarp (imtinai) |
|||
Įtraukia |
|||
Neįtraukia |
|||
Nėra (null) |
|||
Yra (not null) |
|||
Prasideda |
|||
Baigiasi |
Teksto lyginimams taipogi galima naudoti parinktį  Atsižvelgti į raidžių dydį.
Nustačius visas paieškos parinktis, spauskite Ieškoti geoobjektų, kad parinktumėte atitinkančius geoobjektus. Iškrentančios parinktys yra:
Parinkti geoobjektus
Pridėti į dabartinį parinkimą
Išimti iš dabartinio parinkimo
Filtruoti dabartinį parinkimą
Taipogi galite išvalyti visas paieškos parinktys naudodami mygtuką Atstatyti formą.
Nustačius sąlygas jūs galite:
Priartinti geoobjektus žemėlapio drobėje be poreikio iš naujo parinkti
Mirksėti geoobjektus, paryškinant atitinkančius geoobjektus. Tai patogus būdas identifikuoti objektą jo nerenkant ir naudojant identifikavimo įrankio. Pastebėtina, kad mirksėjimas nekeičia žemėlapio drobės apimties, todėl geoobjektai bus matomi tik jei jie yra dabartinėje žemėlapio drobėje.
12.4.2. Geoobjektų identifikavimas
Įrankis  Identifikuoti geoobjektus leidžia jums sąveikauti su žemėlapio drobe ir gauti informaciją iššokančiame lange apie geoobjektus ar pikselius. Jį galima naudoti gaunant informaciją apie daugumą QGIS palaikomų sluoksnių tipų (vektoriai, rastras, tinklelis, taškų debesis, wms, wfs, …). Norint identifikuoti elementą, naudokite vieną iš:
Tada spauskite aktyvaus sluoksnio geoobjektą ar pikselį. Identifikuojamas elementas paryškinamas žemėlapio drobėje, kol atveriamas dialogas Identifikavimo rezultatai su detalia informacija. Dialogas taipogi rodo kelis mygtukus išmanesnei konfigūracijai.
12.4.2.1. Identifikavimo rezultatų dialogas
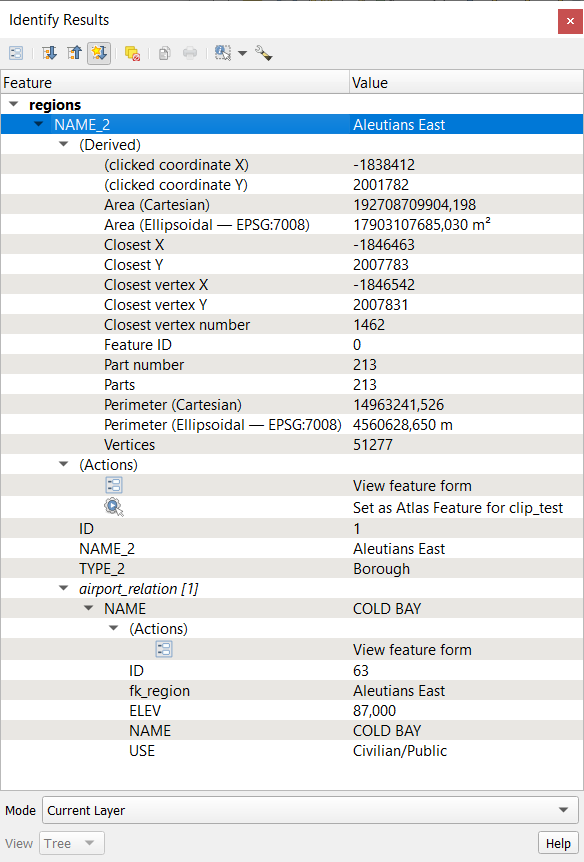
Fig. 12.11 Identifikavimo rezultatų dialogas
Nuo apačios į viršų
Vaizdas valdo bendrą dialogo išvaizdą ir rezultatų formatą, galimi variantai:
Medis: tai numatytasis vaizdas, grąžinantis rezultatus medžio struktūroje
Lentelė: galimas tik rastro sluoksniams, jis leidžia rodyti rezultatus kaip lentelę, kurios stulpeliai yra
Sluoksnis,FID,AtributasirReikšmėarba Grafikas: galimas tik rastro sluoksniams
Režimas leidžia jums pasirinkti sluoksnius, iš kurių bus grąžinami rezultatai. Šie sluoksniai turi būti matomi, jie turi rodyti duomenis žemėlapio drobėje, ir turi turėti nustatytą požymį identifikuojami per meniu . Galimi režimai yra:
Dabartinis sluoksnis: rezultatus grąžins tik sluoksnis(iai), parinktas skydelyje Sluoksniai. Jei parinkta grupė, rezultatai bus išrenkami iš visų jos vaikinių sluoksnių.
Nuo viršaus žemyn, sustoti ties pirmu: rezultatai yra iš aukščiausio geoobjekto ar pikselio po pele.
Iš viršaus žemyn: rezultatai yra iš sluoksnių su geoobjektu ar pikseliu po pele.
Sluoksnio parinkimas: atveria kontekstinį meniu, kur naudotojas parenka sluoksnį, kurio geoobjektus reikia identifikuoti. Jei po pele yra tik vienas geoobjektas, rezultatai rodomi automatiškai.
Viršutinėje Identifikavimo rezultatų dialogo dalyje rodoma informacija, kurią grąžino geoobjektai kaip lentelė, grafikas arba medis, priklausomai nuo parinkto vaizdo. Naudojant medžio vaizdą jūs turite keletą įrankių virš rezultatų:
 Pagal nutylėjimą išskleisti naujus rezultatus, kad nurodytumėte, ar kito geoobjekto identifikavimo informacija turėtų būti suskleista ar išskleista
 Kopijuoti identifikuotą geoobjektą į iškarpinę, tinka perkėlimui į skaičiuoklę.
 Spausdinti parinktą HTML atsakymą: tekstinis rezultatų formatavimas spausdinimui ant popieriaus arba įrašymui kaip
 .PDFfailuthe interaktyvūs identifikavimo įrankiai: iškrentantis meniu su įrankiais, skirtais parinkti identifikuojamus geoobjektus ar taškus žemėlapio drobėje
 Identifikavimo nustatymai leidžia jums aktyvuoti, ar norite:
 Automatiškai atverti formą vieno geoobjekto rezultatams: Įjungus, kiekvieną kartą, kai identifikuojamas vienas geoobjektas, atidaroma forma, kurioje rodomi jo atributai. Tai patogus būdas greitai keisti geoobjekto atributus.
 Slėpti rezultatuose išvestinius rezultatus jei norite rodyti tik tuos laukus, kurie realiai apibrėžti sluoksnyje
12.4.2.2. Geoobjektų identifikavimo įrankio naudojimas
Numatytasme vaizde (Vaizdas: Medis), skydelis Identifikavimo rezultatai teikia kelis įrankius, leidžiančius sąveikauti su užklausiamais sluoksniais. Teisinga šių įrankių kombinacija su paskirties sluoksnių parinkimu gali stipriai pagerinti identifikavimo veiksmus:
 Identifikuoti geoobjektą(us) vienu paspaudimu arba paspaudimu ir tempimu
vienas paspaudimas arba paspaudimas ir tempimas: grąžinami dengiami geoobjektai iš paskirties sluoksnių
dešinys paspaudimas: dengiami geoobjektai iš paskirties sluoksnių surašomi į kontekstinį meniu, sugrupavus pagal sluoksnius. Jūs tada galite pasirinkti:
rodyti konkretaus geoobjekto rezultatą,
rodyti visų konkretaus sluoksnių geoobjektų rezultatus,
vektoriniams sluoksniams taipogi galima atverti jų atributų lentelę atfiltravus pagal grąžintus geoobjektus
arba rodyti visus grąžintus geoobjektus.
 Identifikuoti geoobjektus užvedus pelę: judinant pelę žemėlapio drobėje virš paskirties sluoksnio elementų, jie paryškinami ir grąžinami rezultatų skydelyje.
 Identifikuoti geoobjektus poligonu: grąžina elementus, persidengiančius su nubrėžtu arba parinktu poligonu.
Nubrėžkite poligoną (spauskite kairį mygtuką, kad padėtumėte tašką, dešinį mygtuką, kad uždarytumėte poligono braižymą) ir visi dengiami geoobjektai iš paskirties sluoksnių bus paryškinti ir grąžinti rezultatų skydelyje.
Spauskite dešinį mygtuką ir gausite visų projekte paspaudimo vietoje matomų poligono geoobjektų sąrašą. Parinkite įrašą ir QGIS grąžins visus geoobjektus iš paskirties sluoksnio, kuriuos dengia parinktas poligonas.
 Identifikuoti geoobjektus laisvu apibrėžimu: grąžina elementus, kuriuos dengia laisva ranka nubraižytas poligonas. Nubrėžkite poligoną (kairys paspaudimas pradžiai, tada tempkite žymeklį, kad sukurtumėte plotą, dešiniu mygtuku baikite poligono braižymą). Visi dengiami paskirties sluoksnių geoobjektai paryškinami ir grąžinami rezultatų skydelyje.
 Identifikuoti geoobjektus spinduliu grąžina elementus, kuriuos dengia nubraižytas apskritimas. Nubrėžkite apskritimą (kairiu mygtuku nurodykite centro tašką ir judindami pelės žymeklį suformuokite aplink jį apskritimą arba teksto įvedimo laukelyje įveskite spindulį, tada spauskite dešinį pelės mygtuką arba Enter, kad patvirtintumėte apskritimą). Visi padengti paskirties sluoksniu geoobjektai bus paryškinti ir grąžinti rezultatų skydelyje.
12.4.2.3. Geoobjekto informacija
Kai jūs identifikuojate duomenis žemėlapio drobėje, dialogas Identifikavimo rezultatai rodo informaciją apie paspaustus elementus (arba tuos, virš kurių užvesta pelė, priklausomai nuo naudojamo įrankio). Numatytasis vaizdas yra medžio, kurio pirmas elementas yra sluoksnio pavadinimas, o jo vaikai yra jo identifikuotas geoobjektas(ai). Kiekvienas geoobjektas aprašomas pavadinimo lauke esančia reikšme. Šis laukas nustatomas per . Žemiau pateikiama likusi geoobjekto informacija.
Geoobjekto informacija, kurią rodo identifikavimo įrankis, priklauso nuo pažymėto sluoksnio tipo - ar tai vektorinis sluoksnis (įskaitant vektorines kaladėles ar taškų debesį) ar rastro sluoksnis. Jei jūsų sluoksnis rastro, paspaudus vietą žemėlapio drobėje, identifikavimo įrankis paryškins identifikuotą pikselį. Identifikavimo rezultatų dialogą galima tinkinti, kad būtų rodomi savo laukai, bet pagal nutylėjimą rodys šią informaciją:
Geoobjekto rodomas pavadinimas;
Veiksmai: Į identifikuojamo geoobjekto langą galima pridėti veiksmus. Veiksmas vykdomas paspaudus veiksmo užrašą. Pagal nutylėjimą pridedamas tik vienas veiksmas geoobjekto redagavimui, pavadintas
Rodyti geoobjekto formą. Jūs galite apibrėžti daugiau veiksmų sluoksnio savybių dialoge (žr Actions Properties).Išvestiniai: Ši informacija paskaičiuojama arba išvedama iš kitos informacijos. Čia rasite:
bendrą informaciją apie geoobjekto geometriją:
priklausomai nuo geometrijos tipo, dekarto erdvės matavimai ilgiui, perimetrui ar plotui sluoksnio CRS vienetais. 3D linijų vektoriams galimas dekarto erdvės linijos ilgis.
priklausomai nuo geometrijos tipo, ir ar elipsoidas yra nurodytas projekto savybių dialoge Matavimai, elipsoido reikšmės ilgiui, perimetrui ar plotui naudoja nurodytus vienetus
geoobjekto geometrijos dalių skaičius ir paspaustos dalies numeris
geoobjekto viršūnių skaičius
koordinačių informacija naudojant projekto savybės Koordinačių rodymas nustatymus
XirYkoordinačių reikšmės paspaustame taškepaspaudimo taškui artimiausios viršūnės numeris
artimiausios viršūnės
XirYkoordinačių reikšmės (irZ/M, jei taikoma)jei paspaudžiate kreivinį segmentą, taipogi rodomas tos dalies spindulys.
Duomenų atributai: Tai sąrašas paspausto geoobjekto atributų laukų ir jų reikšmių.
informacija apie susijusį vaikinį geoobjektą, jei jūs apibrėžėte ryšį:
ryšio pavadinimas
atskaitos lauko įrašas, pvz. susijusio vaikinio geoobjekto pavadinimas
Veiksmai: sąrašas veiksmų, kurie apibrėžti sluoksnio savybių dialoge (žr. Actions Properties), numatytasis veiksmas yra
Žiūrėti geoobjekto formą.Duomenų atributai: Susijusio vaikinio geoobjekto atributų laukų ir jų reikšmių sąrašas.
Pastaba
Geoobjektų atributų nuorodas galima spausti skydelyje Identifikavimo rezultatai ir jos bus atvertos numatytoje naršyklėje.
12.6. Documenting your data
In addition to displaying and symbolizing the data in the layers, QGIS allows you to fill:
metadata: information to help people find and understand the dataset, how they can access and use it… these are properties of the datasource and can live out of the QGIS project.
notes: instructions and comments regarding the layer in the current project
12.6.1. Metadata
In the layer properties dialog, the  Metadata tab
provides you with options to create and edit a metadata report on your layer.
Information to fill concern:
the data Identification: basic attribution of the dataset (parent, identifier, title, abstract, language…);
the Categories the data belongs to. Alongside the ISO categories, you can add custom ones;
the Keywords to retrieve the data and associated concepts following a standard based vocabulary;
the Access to the dataset (licenses, rights, fees, and constraints);
the Extent of the dataset, either spatial one (CRS, map extent, altitudes) or temporal;
the Contact of the owner(s) of the dataset;
the Links to ancillary resources and related information;
the History of the dataset.
A summary of the filled information is provided in the Validation tab and helps you identify potential issues related to the form. You can then either fix them or ignore them.
Metadata are saved in the project file by default, the Metadata drop-down
offers options for loading/saving metadata from .qmd file
and for loading/saving metadata in the „Default“ location.
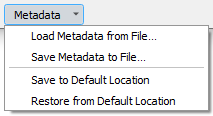
Fig. 12.14 Metadata load/save options
The „Default“ location used by Save to Default Location and Restore from Default Location changes depending on the underlying data source and on its configuration:
For PostgreSQL data sources if the configuration option Allow saving/loading QGIS layer metadata in the database is checked the metadata are stored inside a dedicated table in the database.
For GeoPackage data sources Save to Default Location always saves the metadata in the internal metadata tables of the GeoPackage.
When metadata are saved into the internal tables of PostgreSQL or GeoPackage they become available for search and filtering in the browser and in the layer metadata search panel.
For all other file based data sources Save to Default Location saves the metadata in a
.qmdfile alongside the file.In all other cases Save to Default Location saves the metadata in a local
.sqlitedatabase.
12.6.2. Sluoksnio pastabos
Layer notes allow you to document the layer within the current project. They can be place to store important messages for users of the project like to do lists, instructions, warnings, …
From the layer’s contextual menu in Layers panel, select Add layer notes… and fill the open dialog with necessary texts.
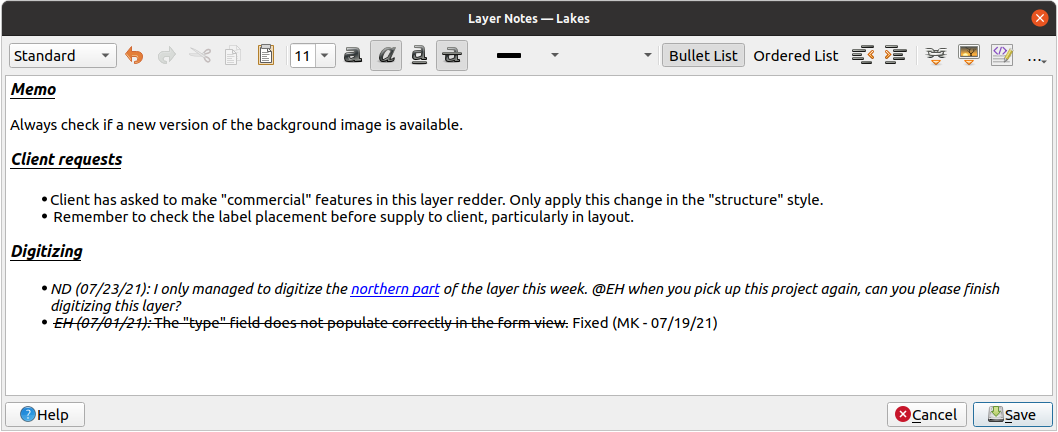
Fig. 12.15 Adding notes to a layer
The Add layer notes dialog provides a html-based multiline text box with a complete set of tools for:
text manipulation: cut, copy, paste, undo, redo
characters formatting, applied to all or parts of the contents: font size and color, bold, italic, underline, strikethrough, background color, URL highlighting
paragraph structuring: bullet and numbered lists, indentation, predefined headings
file insertion, even with drag-and-drop
editing with HTML coding
From the … drop-down at the far right of the toolbar, you can:
Remove all formatting
Remove character formatting
Clear all content
In the Layers panel, a layer with a note is assigned
the  icon which, upon hover, displays the note.
Click the icon to edit the note. You can as well right-click the layer and
Edit layer note… or Remove layer note.
Pastaba
Notes are part of the layer style and
can be saved in the .qml or .qlr file. They can also be
transferred from one layer to another while copy-pasting the layer style.
12.7. Storing values in Variables
In QGIS, you can use variables to store useful recurrent values (e.g. the
project’s title, or the user’s full name) that can be used in expressions.
Variables can be defined at the application’s global level, project level,
layer level, processing modeler level, layout level, and layout item’s level.
Just like CSS cascading rules, variables can be overwritten - e.g., a project level
variable will overwrite any application global level variables set with
the same name. You can use these variables to build text strings or other
custom expressions using the @ character before the variable name. For
example in print layout creating a label with this content:
This map was made using QGIS [% @qgis_version %]. The project file for this
map is: [% @project_path %]
Will render the label like this:
This map was made using QGIS 3.4.4-Madeira. The project file for this map is:
/gis/qgis-user-conference-2019.qgs
Besides the preset read-only variables, you can define your own custom variables for any of the levels mentioned above. You can manage:
global variables from the menu
project variables from the Project Properties dialog (see Projekto savybės)
vector layer variables from the Layer Properties dialog (see Vektorių savybių dialogas);
modeler variables from the Model Designer dialog (see Modelių dizaineris);
layout variables from the Layout panel in the Print layout (see The Layout Panel);
and layout item variables from the Item Properties panel in the Print layout (see Layout Items Common Options).
To differentiate from editable variables, read-only variable names and values are displayed in italic. On the other hand, higher level variables overwritten by lower level ones are strike through.
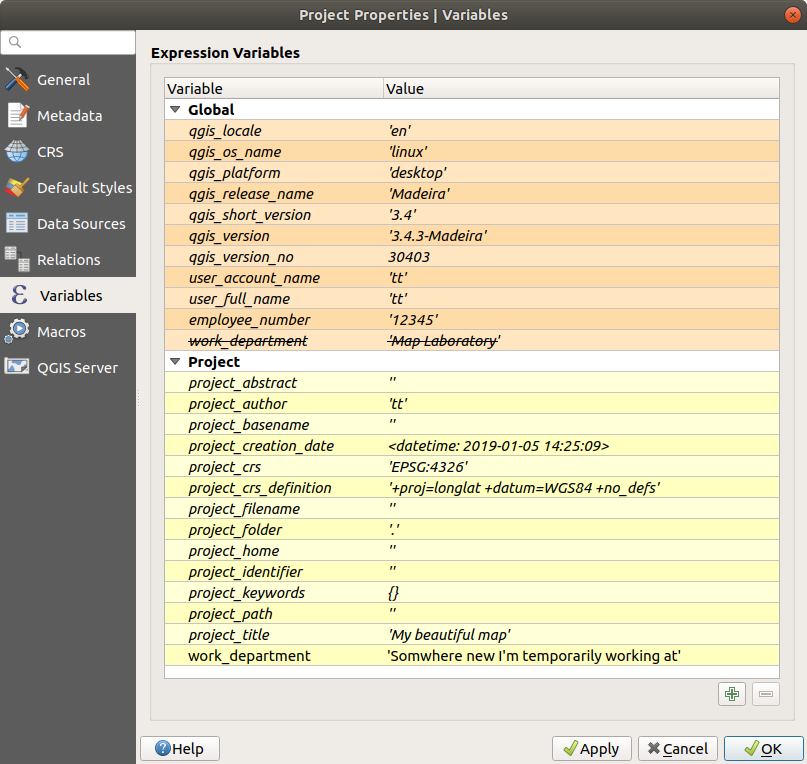
Fig. 12.16 Variables editor at the project level
Pastaba
You can read more about variables and find some examples in Nyall Dawson’s Exploring variables in QGIS 2.12, part 1, part 2 and part 3 blog posts.
12.8. Authentication
QGIS has the facility to store/retrieve authentication credentials in a secure manner. Users can securely save credentials into authentication configurations, which are stored in a portable database, can be applied to server or database connections, and are safely referenced by their ID tokens in project or settings files. For more information see Autentifikacijos sistema.
A master password needs to be set up when initializing the authentication system and its portable database.
12.9. Common widgets
In QGIS, there are some options you’ll often have to work with. For convenience, QGIS provides you with special widgets that are presented below.
12.9.1. Color Selector
12.9.1.1. The color dialog
The Select Color dialog will appear whenever you click
the  icon to choose a color. The features of this dialog
depend on the state of the Use native color chooser dialogs
parameter checkbox in .
When checked, the color dialog used is the native one of the OS on which
QGIS is running. Otherwise, the QGIS custom color chooser is used.
The custom color chooser dialog has four different tabs which allow you to
select colors by ![]() Color ramp,
Color ramp, ![]() Color wheel,
Color wheel,
![]() Color swatches or
Color swatches or ![]() Color picker.
With the first two tabs, you can browse to all possible color combinations and
apply your choice to the item.
Color picker.
With the first two tabs, you can browse to all possible color combinations and
apply your choice to the item.
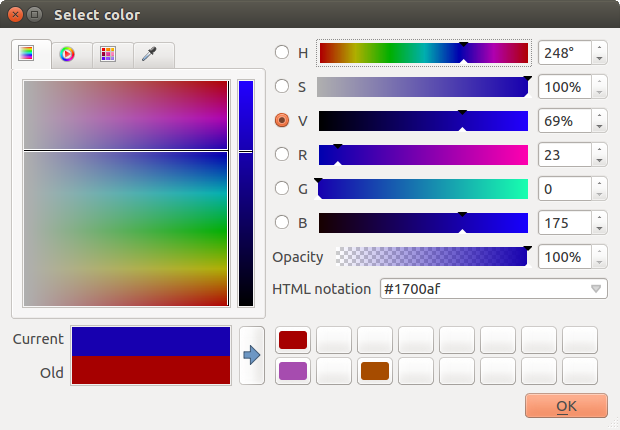
Fig. 12.17 Color selector ramp tab
In the ![]() Color swatches tab, you can choose from a
list of color palettes (see Spalvų nustatymai for details).
All but the Recent colors palette can be modified with the
Color swatches tab, you can choose from a
list of color palettes (see Spalvų nustatymai for details).
All but the Recent colors palette can be modified with the
 Add current color and
  Remove selected color
buttons at the bottom of the frame.
The … button next to the palette combo box also offers several options to:
copy, paste, import or export colors
create, import or remove color palettes
add the custom palette to the color selector widget with the Show in Color Buttons item (see Fig. 12.19)
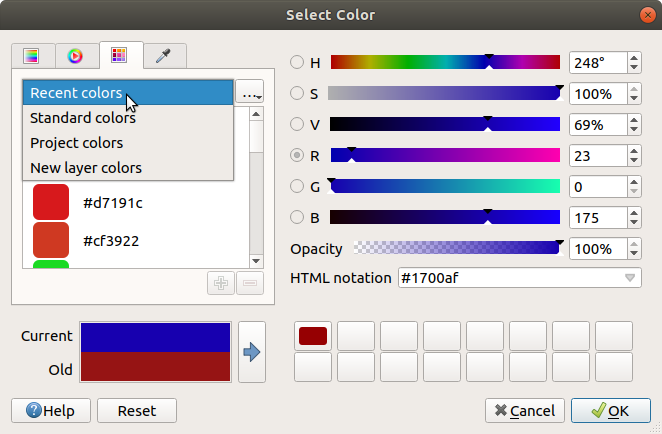
Fig. 12.18 Color selector swatches tab
Another option is to use the ![]() Color picker which allows
you to sample a color from under your mouse cursor at any part of the QGIS UI or even
from another application: press the space bar while the tab is active, move the
mouse over the desired color and click on it or press the space bar again. You
can also click the Sample Color button to activate the picker.
Color picker which allows
you to sample a color from under your mouse cursor at any part of the QGIS UI or even
from another application: press the space bar while the tab is active, move the
mouse over the desired color and click on it or press the space bar again. You
can also click the Sample Color button to activate the picker.
Whatever method you use, the selected color is always described through color
sliders for HSV (Hue, Saturation, Value) and RGB (Red, Green, Blue)
values. The color is also identifiable in HTML notation.
Modifying a color is as simple as clicking on the color wheel or ramp or on any of the color parameters sliders. You can adjust such parameters with the spinbox beside or by scrolling the mouse wheel over the corresponding slider. You can also type the color in HTML notation. Finally, there is an Opacity slider to set transparency level.
The dialog also provides a visual comparison between the
Old color (applied to object) and the Current one (being selected).
Using drag-and-drop or pressing the  Add color to
swatch button, any of these colors can be saved in a slot for easy access.
Patarimas
Quick color modification
Drag-and-drop a color selector widget onto another one to apply its color.
12.9.1.2. The color drop-down shortcut
Click the drop-down arrow to the right of the  color button
to display a widget for quick color selection. This shortcut provides access
to:
a color wheel to pick a color from
an alpha slider to change color opacity
the color palettes previously set to Show in Color Buttons
copy the current color and paste it into another widget
pick a color from anywhere on your computer display
choose a color from the color selector dialog
drag-and-drop the color from one widget to another for quick modification
Patarimas
Scroll the mouse wheel over a color selector widget to quickly modify the opacity of the associated color.
Pastaba
When the color widget is set to a project color through the data-defined override properties, the above functions for changing the color are unavailable. You’d first need to Unlink color or Clear the definition.
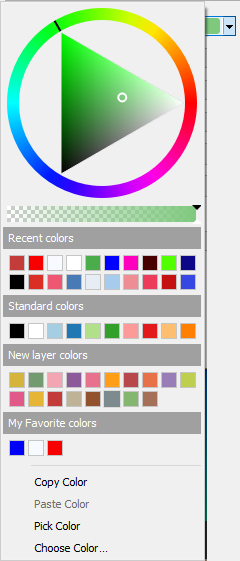
Fig. 12.19 Quick color selector menu
12.9.1.3. The color ramp drop-down shortcut
Color ramps are a practical way to apply a set of colors to one or many features.
Their creation is described in the Setting a Color Ramp section. As for the colors,
pressing the  color ramp button opens the corresponding color
ramp type dialog allowing you to change its properties.
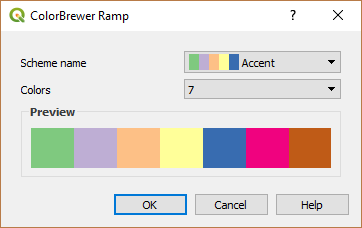
Fig. 12.20 Customizing a colorbrewer ramp
The drop-down menu to the right of the button gives quick access to a wider set of color ramps and options:
Invert Color Ramp
Clear Current Ramp to unset any assigned color ramp to the widget (available only in some contexts)
 Random Colors: available only in some contexts
(e.g., when a color ramp is being used for a layer symbology),
checking this entry creates and applies a color ramp with random colors.
It also enables a Shuffle random colors entry to regenerate
a new random color ramp if the current one is not satisfactory.
Random Colors: available only in some contexts
(e.g., when a color ramp is being used for a layer symbology),
checking this entry creates and applies a color ramp with random colors.
It also enables a Shuffle random colors entry to regenerate
a new random color ramp if the current one is not satisfactory.a preview of the
gradientorcatalog: cpt-citycolor ramps flagged as Favorites in the Style Manager dialogAll Color Ramps to access the compatible color ramps database
Create New Color Ramp… of any supported type that could be used in the current widget (note that this color ramp will not be available elsewhere unless you save it in the library)
Edit Color Ramp…, the same as clicking the whole color ramp button
Save Color Ramp…, to save the current color ramp with its customizations in the style library
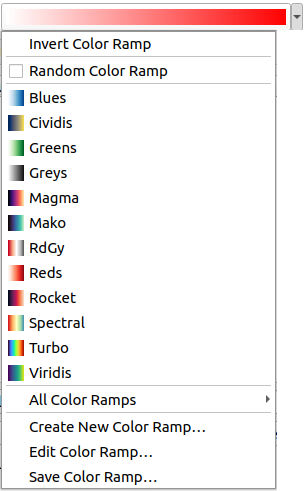
Fig. 12.21 Quick color ramp selection widget
12.9.2. Symbol Widget
The Symbol selector widget is a convenient shortcut when you want to set symbol properties of a feature. Clicking the drop-down arrow shows the following symbol options, together with the features of the color drop-down widget:
Configure Symbol…: the same as pressing the symbol selector widget. It opens a dialog to set the symbol parameters.
Copy Symbol from the current item
Paste Symbol to the current item, speeding configuration
Clear Current Symbol to unset any assigned symbol to the widget (available only in some contexts)
Patarimas
Scroll the mouse wheel over a marker or line symbol widget to quickly modify the size of the associated symbol.
12.9.3. Remote or embedded file selector
Along with the file selector widget, the … button will sometimes show a drop-down arrow. This is usually available when using:
an SVG file in a symbol or a label
a raster image to customize symbols, labels, textures or decorations
Pressing the arrow will provide you with a menu to:
Select File…, to load the file from the file system. The file is identified through the file path and QGIS needs to resolve the path in order to display the corresponding image
From URL…, to load the file from a remote URL. As above, the image will only be loaded on successful retrieval of the remote resource
Embed File…, to embed the file inside the current project, style database, or print layout template. The file is then always rendered as part of the item. This is a convenient way to create self-contained projects with custom symbols which can be easily shared amongst different users and installations of QGIS.
Extract Embedded File…, to extract the embedded file from the widget and save it on disk.
12.9.4. Visibility Scale Selector
The visibility scale selector provides options to control the scales at which an element will be made visible in the map canvas. Out of the specified range of scales, the elements are not displayed. It can be applied e.g. to layers, labels or diagrams, from their Rendering properties tab.
Fill the Minimum (exclusive) box with the most zoomed out desired scale, typing the value or selecting it from the predefined scales
and/or fill the Maximum (inclusive) box with the most zoomed in desired scale
The
 Set to current canvas scale button next to
the scale boxes sets the current map canvas scale as boundary of the range visibility.
Press the arrow next to the button to access scales from layouts‘ maps
and reuse them to fill the box.

Fig. 12.22 Visibility scale selector widget
12.9.5. Spatial Extent Selector
The Extent selector widget is a convenient shortcut when you want to select a spatial extent to assign to a layer or to limit the actions to run on. Depending on the context, it offers selection between:
Current Layer Extent: e.g. when exporting a layer
: uses extent of a layer loaded in the current project
Use current Map Canvas Extent
Draw on Canvas: a rectangle whose coordinates are then used
Calculate from Bookmark: uses extent of a saved bookmark
Calculate from Layout Map: uses extent of a layout map
Enter or edit the coordinates as
xmin, xmax, ymin, ymax
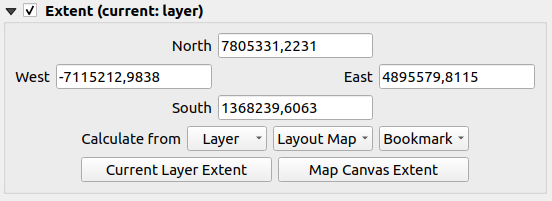
Fig. 12.23 Extent selector widget
12.9.6. Font Selector
The Font selector widget is a convenient shortcut when you want to set font properties for textual information (feature labels, decoration labels, map legend text, …). Clicking the drop-down arrow shows some or all of the following options:
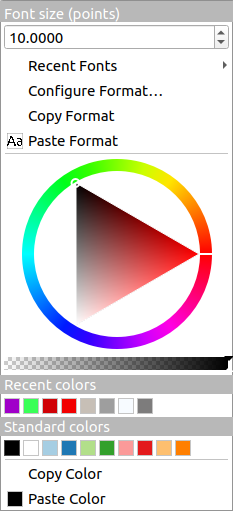
Fig. 12.24 Font selector drop-down menu
Clear Current Text Format to unset any assigned text format to the widget (available only in some contexts)
Font Size in the associated unit
menu with the active font checked (at the top)
Configure Format…: same as pressing the font selector widget. It opens the Text format dialog, providing advanced formatting options such as color, opacity, orientation, HTML notation, buffer, background, shadow, …
Copy Format of the text
Paste Format to the text, speeding configuration
the color widget for quick color setting
Patarimas
Scroll the mouse wheel over a font selector widget to quickly modify the font size of the associated text.
12.9.7. Unit Selector
Size properties of the items (labels, symbols, layout elements, …) in QGIS are not necessarily bound to either the project units or the units of a particular layer. For a large set of properties, the Unit selector drop-down menu allows you to tweak their values according to the rendering you want (based on screen resolution, paper size, or the terrain). Available units are:
Millimeters
Points
Pixels
Inches
Percentage: allows you to set some properties as a percent of another one. For example, this is useful for creation of text formats where the components (buffer size, shadow radius…) nicely scale as the text size is changed, instead of having constant buffer/shadow sizes. So you don’t need to adjust those sizes, when the text size changes.
Meters at Scale: This allows you to always set the size in meters, regardless of what the underlying map units are (e.g. they can be in inches, feet, geographic degrees, …). The size in meters is calculated based on the current project ellipsoid setting and a projection of the distances in meters at the center of the current map extent. For maps in a projected coordinate system this is calculated using projected units. For maps in a geographic (latitude/longitude) based system the size is approximated by calculating meter sizes using ellipsoidal calculations for the vertical scale of the map.
and Map Units: The size is scaled according to the map view scale. Because this can lead to too big or too small values, use the
 button
next to the entry to constrain the size to a range of values based on:
button
next to the entry to constrain the size to a range of values based on:The Minimum scale and the Maximum scale: The value is scaled based on the map view scale until you reach any of these scale limits. Out of the range of scale, the value at the nearest scale limit is kept.
and/or The Minimum size and the Maximum size in
mm: The value is scaled based on the map view scale until it reaches any of these limits; Then the limit size is kept.
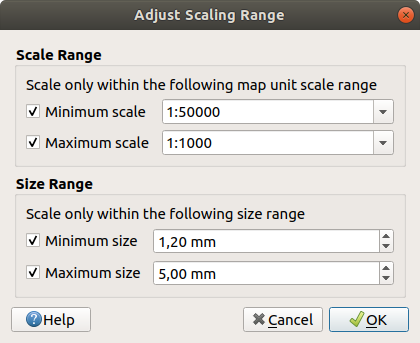
Fig. 12.25 Adjust scaling range dialog
12.9.8. Number Formatting
Numeric formatters allow formatting of numeric values for display, using a variety of different formatting techniques (for instance scientific notation, currency values, percentage values, etc). One use of this is to set text in a layout scale bar or fixed table.
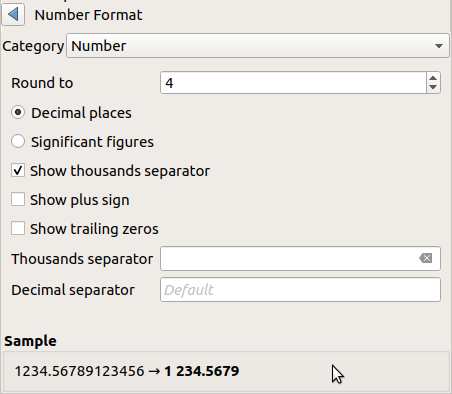
Fig. 12.26 Formatting numeric value
Different categories of formats are supported. For most of them, you can set part or all of the following numeric options:
But they can also have their custom settings. Provided categories are:
General, the default category: has no setting and displays values as set in the parent widget properties or using the global settings.
Number
The value can be Round to a self defined number of Decimal places or their Significant figures
customize the Thousands separator and Decimal separator
Bearing for a text representation of a direction/bearing using:
Format: possible ranges of values are
0 to 180°, with E/W suffix,-180 to +180°and0 to 360°number of Decimal places
Currency for a text representation of a currency value.
Prefix
Suffix
number of Decimal places
Fraction for a vulgar fractional representation of a decimal value (e.g. 1/2 instead of 0.5)
Percentage - appends
%to the values, with setting of:number of Decimal places
Scaling to indicate whether the actual values already represent percentages (then they will be kept as is) or fractions (then they are converted)
Scientific notation in the form
2.56e+03. The number of Decimal places can be set.
A live preview of the settings is displayed under the Sample section.
12.9.9. Blending Modes
QGIS offers different options for special rendering effects with these tools that you may previously only know from graphics programs. Blending modes can be applied on layers and features, and also on print layout items:
Normal: This is the standard blend mode, which uses the alpha channel of the top pixel to blend with the pixel beneath it. The colors aren’t mixed.
Lighten: This selects the maximum of each component from the foreground and background pixels. Be aware that the results tend to be jagged and harsh.
Screen: Light pixels from the source are painted over the destination, while dark pixels are not. This mode is most useful for mixing the texture of one item with another item (such as using a hillshade to texture another layer).
Dodge: Brighten and saturate underlying pixels based on the lightness of the top pixel. Brighter top pixels cause the saturation and brightness of the underlying pixels to increase. This works best if the top pixels aren’t too bright. Otherwise the effect is too extreme.
Addition: Adds pixel values of one item to the other. In case of values above the maximum value (in the case of RGB), white is displayed. This mode is suitable for highlighting features.
Darken: Retains the lowest values of each component of the foreground and background pixels. Like lighten, the results tend to be jagged and harsh.
Multiply: Pixel values of the top item are multiplied with the corresponding values for the bottom item. The results are darker.
Burn: Darker colors in the top item cause the underlying items to darken. Burn can be used to tweak and colorize underlying layers.
Overlay: Combines multiply and screen blending modes. Light parts become lighter and dark parts become darker.
Soft light: Very similar to overlay, but instead of using multiply/screen it uses color burn/dodge. This is supposed to emulate shining a soft light onto an image.
Hard light: Hard light is also very similar to the overlay mode. It’s supposed to emulate projecting a very intense light onto an image.
Difference: Subtracts the top pixel from the bottom pixel, or the other way around, in order always to get a positive value. Blending with black produces no change, as the difference with all colors is zero.
Subtract: Subtracts pixel values of one item from the other. In the case of negative values, black is displayed.
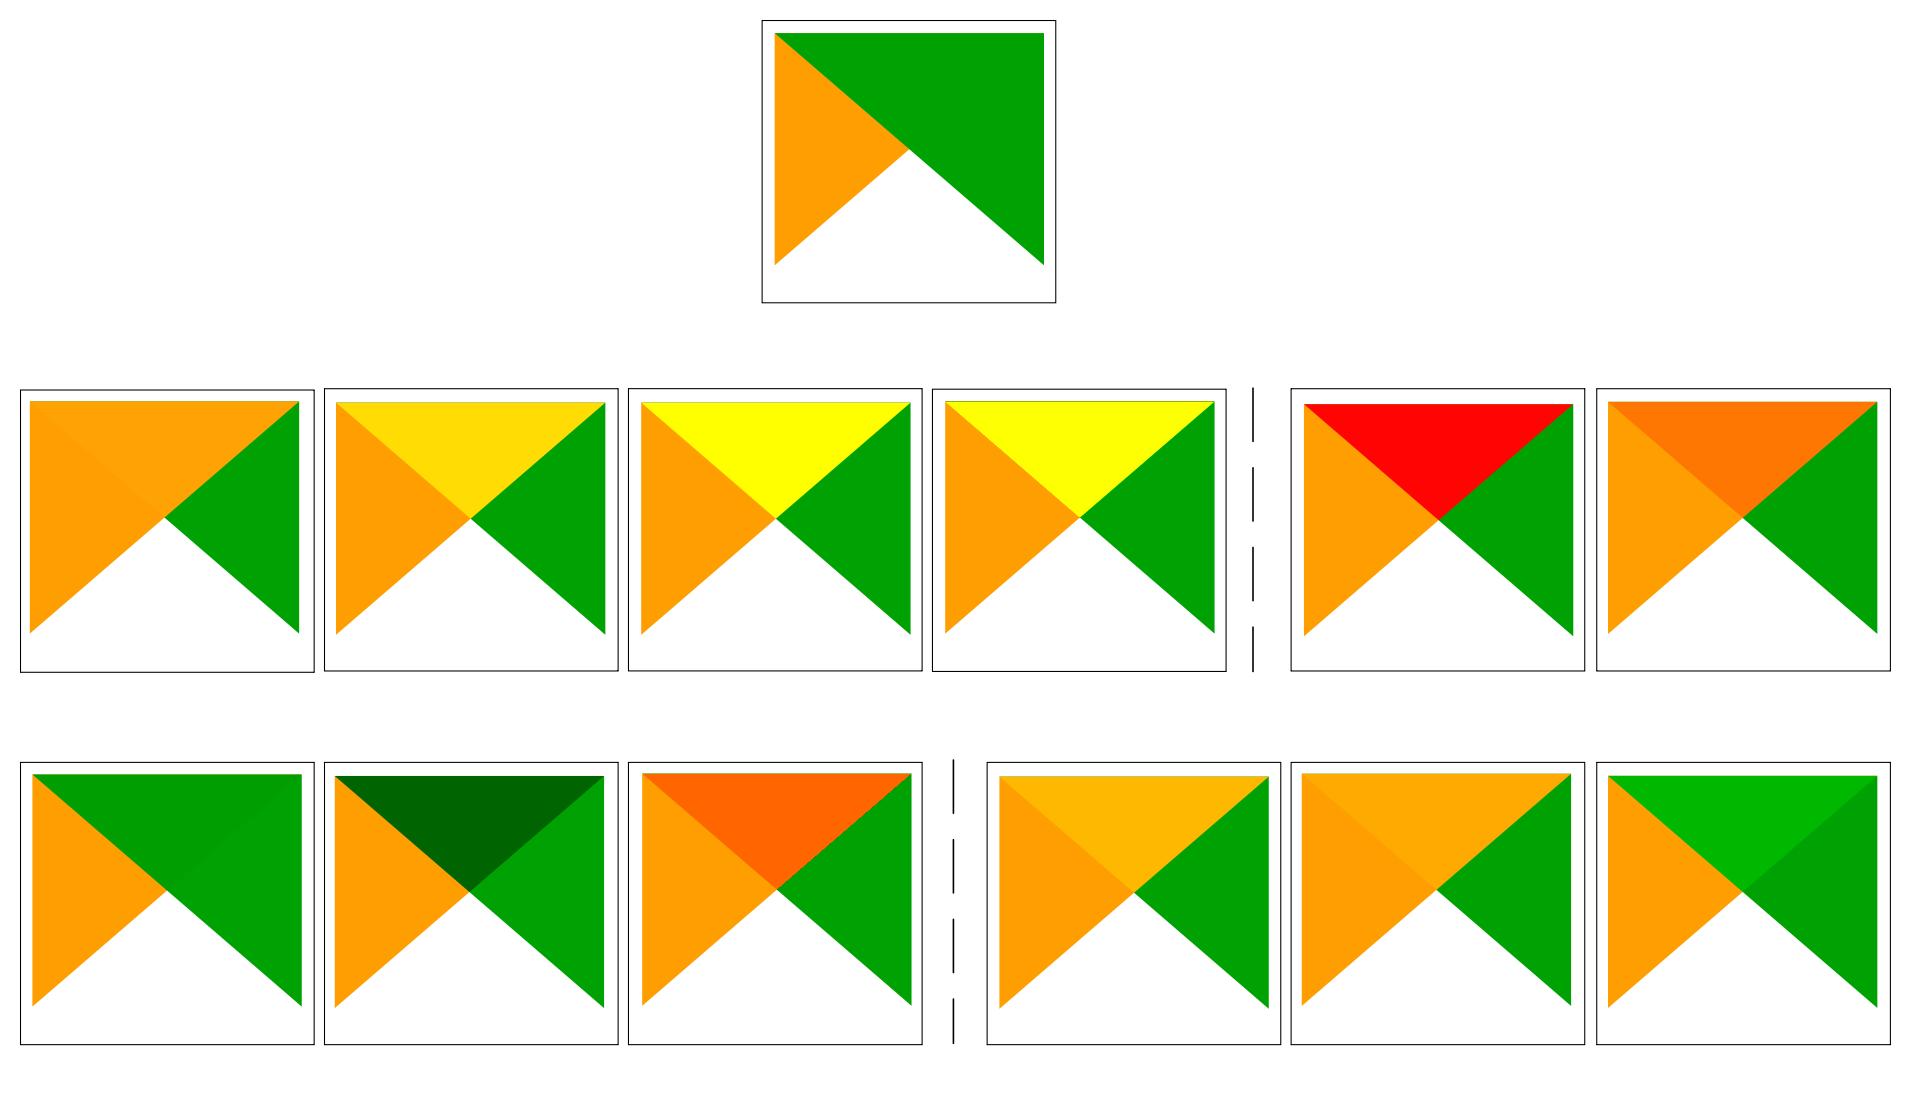
Fig. 12.27 Examples of blend modes applied to a green feature over an orange
From top to bottom, left to right: Normal – Lighten, Screen, Dodge, Addition – Difference, Subtract – Darken, Multiply, Burn – Overlay, Soft light, Hard light
When a layer is part of a group that renders layers as a group, additional blending modes are available for the rendering. They provide methods to clip the render of one layer’s content by the content in a second „mask“ layer.
Masked By Below: The output is the top pixel, where the opacity is reduced by that of the bottom pixel.
Mask Below: The output is the bottom pixel, where the opacity is reduced by that of the top pixel.
Inverse Masked By Below: The output is the top pixel, where the opacity is reduced by the inverse of the bottom pixel.
Inverse Mask Below: The output is the bottom pixel, where the opacity is reduced by the inverse of the top pixel.
Paint Inside Below: The top pixel is blended on top of the bottom pixel, with the opacity of the top pixel reduced by the opacity of the bottom pixel.
Paint Below Inside: The bottom pixel is blended on top of the top pixel, with the opacity of the bottom pixel reduced by the opacity of the top pixel.
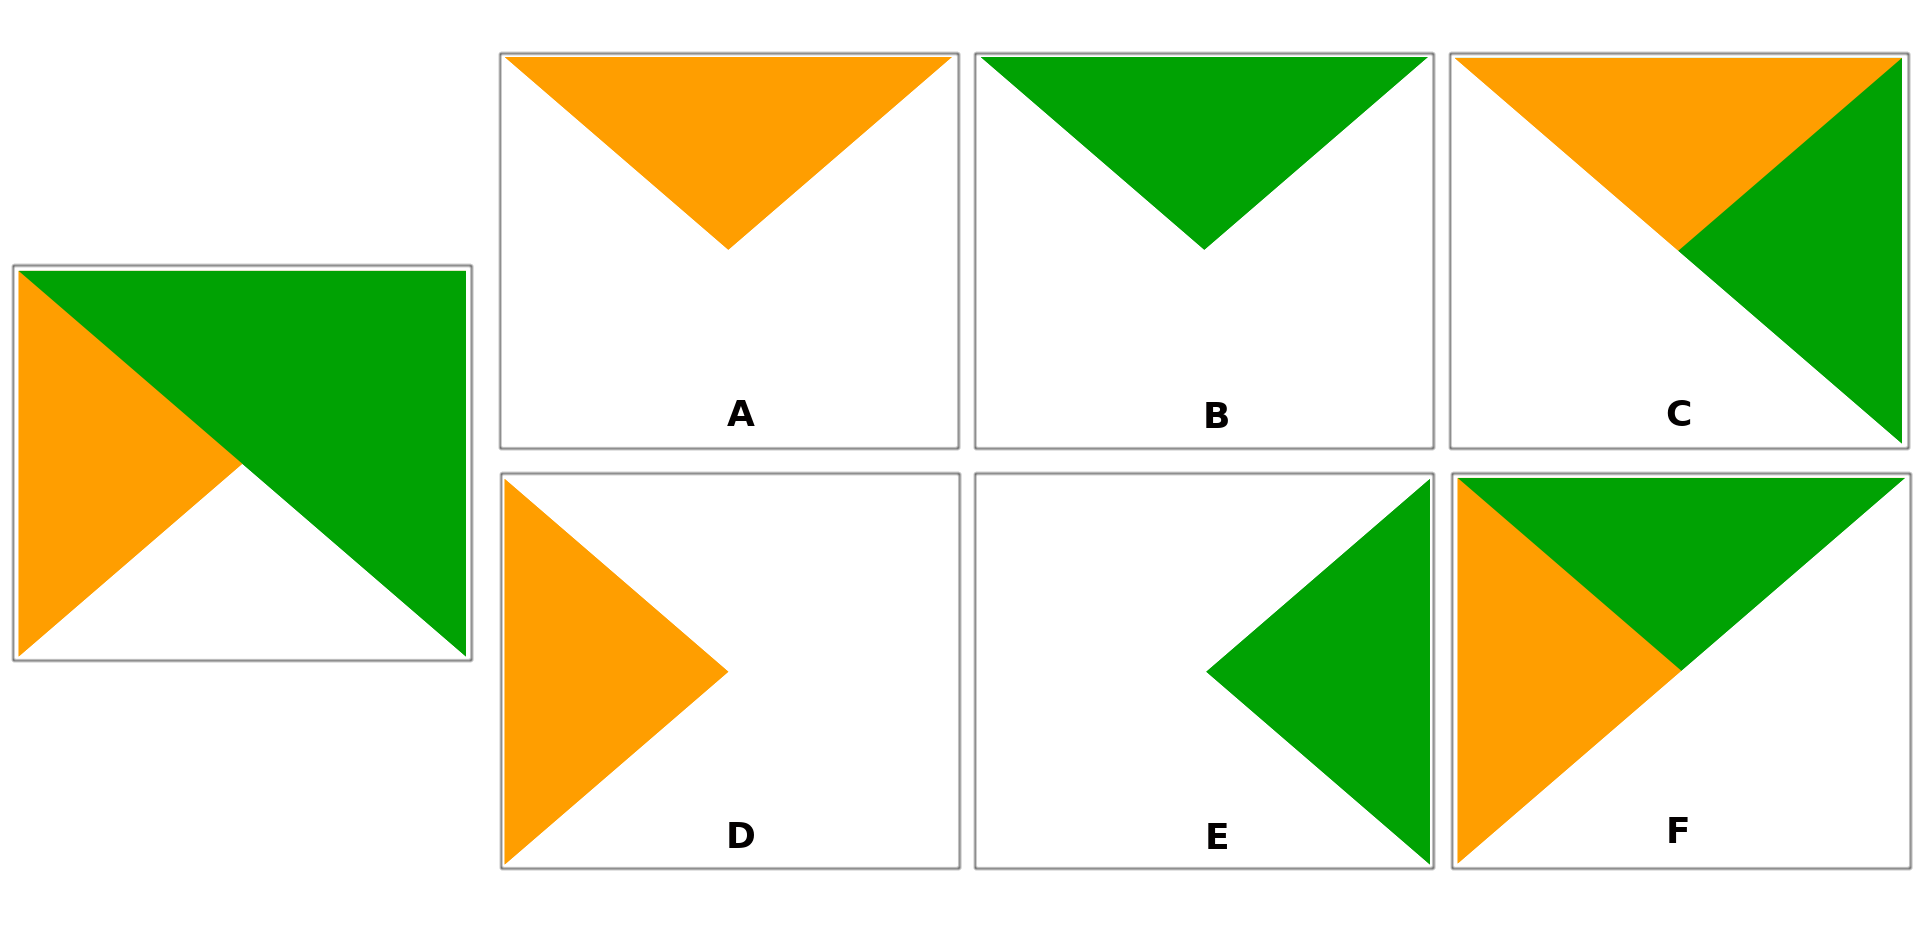
Fig. 12.28 Examples of blend clipping mode applied to top green layer in a group
A: Mask Below B: Masked By Below C: Paint Below Inside D: Inverse Mask Below E: Inverse Masked By Below F: Paint Inside Below
12.9.10. Data defined override setup
Next to many options in the vector layer properties dialog or settings in the print
layout, you will find a ![]() Data defined override icon.
Using expressions based on layer attributes or item
settings, prebuilt or custom functions and variables,
this tool allows you to set dynamic values for parameters. When enabled,
the value returned by this widget is applied to the parameter regardless of its normal
value (checkbox, textbox, slider…).
Data defined override icon.
Using expressions based on layer attributes or item
settings, prebuilt or custom functions and variables,
this tool allows you to set dynamic values for parameters. When enabled,
the value returned by this widget is applied to the parameter regardless of its normal
value (checkbox, textbox, slider…).
12.9.10.1. The data defined override widget
Clicking the ![]() Data defined override icon shows the following entries:
Data defined override icon shows the following entries:
Description… that indicates if the option is enabled, which input is expected, the valid input type and the current definition. Hovering over the widget also pops up this information.
Store data in the project: a button allowing the property to be stored using the Auxiliary Storage Properties mechanism.
Field type: an entry to select from the layer’s fields that match the valid input type.
Color: when the widget is linked to a color property, this menu gives access to the colors defined as part of the current project’s colors scheme.
Variable: a menu to access the available user-defined variables
Edit… button to create or edit the expression to apply, using the Expression String Builder dialog. To help you correctly fill in the expression, a reminder of the expected output’s format is provided in the dialog.
Paste and Copy buttons.
Clear button to remove the setup.
For numeric and color properties, Assistant… to rescale how the feature data is applied to the property (more details below)
Patarimas
Use right-click to (de)activate the data override
When the data-defined override option is set up correctly the
icon is yellow ![]() or
or ![]() . If it is broken,
the icon is red
. If it is broken,
the icon is red ![]() or
or ![]() .
.
You can enable or disable a configured ![]() Data-defined
override button by simply clicking the widget with the right mouse button.
Data-defined
override button by simply clicking the widget with the right mouse button.
12.9.10.2. Using the data-defined assistant interface
When the ![]() Data-defined override button is associated with a
size, a rotation, an opacity or a color property, it has an Assistant…
option that helps you change how the data is applied to the parameter for each
feature. The assistant allows you to:
Data-defined override button is associated with a
size, a rotation, an opacity or a color property, it has an Assistant…
option that helps you change how the data is applied to the parameter for each
feature. The assistant allows you to:
Define the Input data, ie:
Source: the attribute to represent, using a field or an
 expression
the range of values to represent: you can manually enter the values or use the
 Fetch value range from layer button to fill
these fields automatically with the minimum and maximum values returned by
the Source expression applied to your data
 Apply transform curve: by default, output values (see
below for setting) are applied to input features following a linear scale.
You can override this logic: enable the transform option, click on the
graphic to add break point(s) and drag the point(s) to apply a custom
distribution.
Apply transform curve: by default, output values (see
below for setting) are applied to input features following a linear scale.
You can override this logic: enable the transform option, click on the
graphic to add break point(s) and drag the point(s) to apply a custom
distribution.Define the Output values: the options vary according to the parameter to define. You can globally set:
for a color setting, the color ramp to apply to values and the single color to use for NULL values
for the others, the minimum and maximum values to apply to the selected property as well as the size/angle/opacity value for ignored or NULL source features
for size properties, the Scale method of representation which can be Flannery, Exponential, Surface, Radius or Linear
the Exponent to use for data scaling when the Scale method is of exponential type or when tweaking the opacity
When compatible with the property, a live-update preview is displayed in the right-hand side of the dialog to help you control the value scaling.
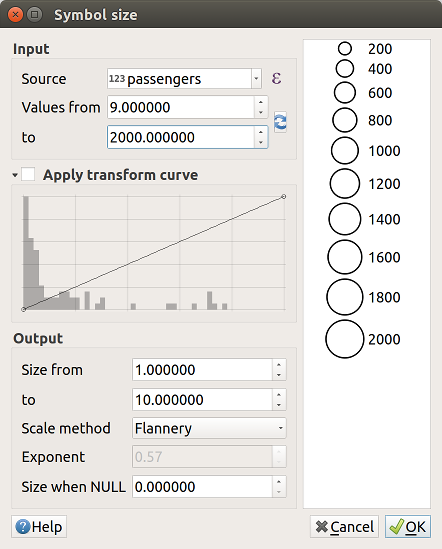
Fig. 12.29 Scaling feature size based on passengers field’s value
The values presented in the varying size assistant above will set the size ‚Data-defined override‘ with:
coalesce(scale_exp("passengers", 9, 2000, 1, 10, 0.57), 0)


