17.2. Rasteranalyse
17.2.1. Rasterrechner
The in the menu allows you to perform calculations on the basis of existing raster pixel values (see Abb. 17.21). The results are written to a new raster layer in a GDAL-supported format.
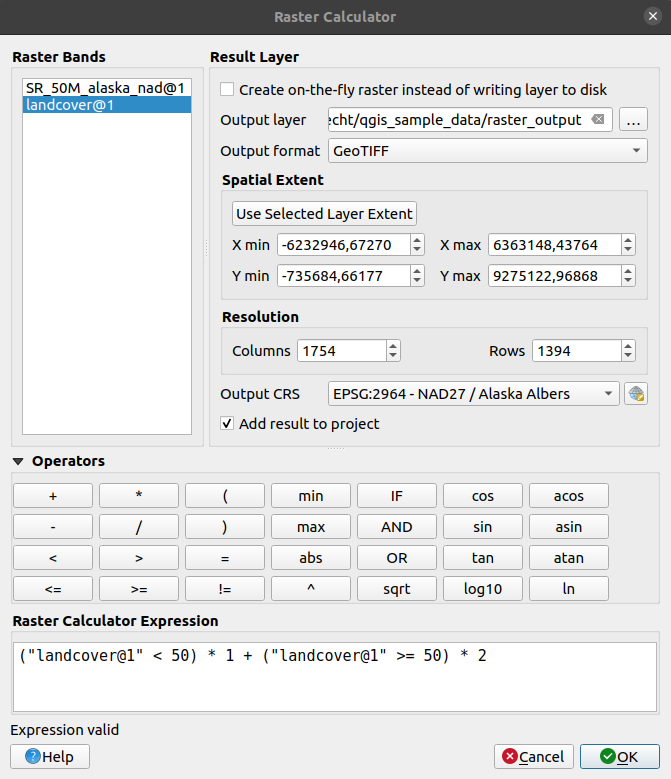
Abb. 17.21 Rasterrechner
The Raster bands list contains all loaded raster layers that can be used. To add a raster to the raster calculator expression field, double click its name in the Fields list. You can then use the operators to construct calculation expressions, or you can just type them into the box.
In the Result layer section, you will need to define an output layer. You can:
 Create on-the-fly raster instead of writing layer to disk:
If unchecked, the output is stored on the disk as a new plain file. An Output layer path and an Output format are required.
If checked, a virtual raster layer, i.e. a raster layer defined by its URI and whose pixels are calculated on-the-fly, is created. It’s not a new file on disk; the virtual layer is still connected to the rasters used in the calculation meaning that deleting or moving these rasters would break it. A Layer name can be provided, otherwise the calculation expression is used as such. Removing the virtual layer from the project deletes it, and it can be made persistent in file using the layer contextual menu.
Define the Spatial extent of the calculation based on an input raster layer extent, or on custom X,Y coordinates
Set the Resolution of the layer using columns and rows number. If the input layer has a different resolution, the values will be resampled with the nearest neighbor algorithm.
With the
Add result to project checkbox, the result layer
will automatically be added to the legend area and can be visualized.
Checked by default for virtual rasters.
The Operators section contains all available operators. To add an operator
to the raster calculator expression box, click the appropriate button. Mathematical
calculations (+, -, *, … ) and trigonometric functions (sin,
cos, tan, … ) are available. Conditional expressions (=, !=,
<, >=, … ) return either 0 for false or 1 for true, and therefore can be
used with other operators and functions.
Hinweis
See also the Raster calculator algorithm.
17.2.1.1. Beispiele
Höhenwerte von Meter zu Fuß konvertieren
Für das Erstellen eines Rasterlayers in Fuß aus einem Rasterlayer in Metern müssen Sie den Konvertierungsfaktor von Metern zu Fuß benutzen: 3.28. Der Ausdruck lautet:
"elevation@1" * 3.28
Eine Maske verwenden
Wenn Sie Teile des Rasterlayers ausmaskieren wollen, weil Sie nur an Höhenwerten über 0 Metern interessiert sind, können Sie den folgenden Ausdruck zum Erstellen einer Maske und zum gleichzeitigen Anwenden auf den Rasterlayer verwenden.
("elevation@1" >= 0) * "elevation@1"
Mit anderen Worten, für jede Zelle größer oder gleich 0 wird der bedingte Ausdruck mit 1 ausgewertet, was den ursprünglichen Wert durch Multiplikation mit 1 beibehält, ansonsten wird der bedingte Ausdruck zu 0 ausgewertet, was den Rasterwert auf 0 setzt und die Maske im laufenden Betrieb erzeugt.
Classify a Raster
Wenn Sie ein Raster klassifizieren wollen, sagen wir beispielsweise in zwei Höhenklassen, können Sie die folgenden Ausdrücke verwenden um ein Raster mit zwei Werten 1 und 2 in einem Schritt erstellen.
("elevation@1" < 50) * 1 + ("elevation@1" >= 50) * 2
In anderen Worten stelle den Wert für jede Zelle mit einem Wert kleiner 50 auf 1 ein. Für jede Zelle mit einem Wert größer als oder gleich 50 stelle den Wert 2 ein.
Or you can use the IF operator.
if ( elevation@1 < 50 , 1 , 2 )
17.2.2. Raster Ausrichtung
Dieses Tool ist in der Lage mehrere Raster als Eingabe zu nehmen und sie perfekt auszurichten, das heißt:
auf gleichem KBS reprojizieren,
zu derselben Zellengröße resamplen und in dem Gitter versetzen,
auf ein Interessengebiet schneiden,
wenn erforderlich, Werte neu skalieren.
Alle Raster werden in anderen Dateien gespeichert.
First, open the tools from and click
on the  Add new raster button to choose one existing raster in
QGIS. Select an output file to save the raster after the alignment, the
resampling method and if the tools need to Rescale values according
to the cell size. The resampling method can be (see Abb. 17.22):
Add new raster button to choose one existing raster in
QGIS. Select an output file to save the raster after the alignment, the
resampling method and if the tools need to Rescale values according
to the cell size. The resampling method can be (see Abb. 17.22):
Nächster Nachbar
Bilinear (2x2 Kern)
Kubisch (4x4 kernel): Cubic Convolution Approximation
Kubisch B-Spline (4x4 kernel): Kubische B-Spline Annäherung
Lanczos (6x6 kernel): Lanczos windowed sinc interpolation
Average: computes the average of all non-NODATA contributing pixels
Mode: selects the value which appears most often of all the sampled points
Maximum, Minimum, Mediane, First Quartile (Q1) or Third Quartile (Q3) of all non-NODATA contributing pixels
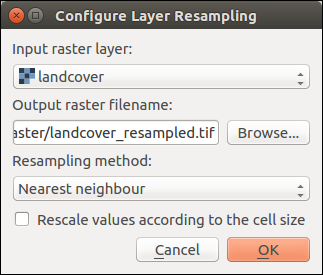
Abb. 17.22 Select Raster Resampling Options
In the main Align raster dialog, you can still  Edit
file settings or
Edit
file settings or  Remove an existing file from the list of raster
layers. You can also choose one or more other options (see Abb. 17.23):
Remove an existing file from the list of raster
layers. You can also choose one or more other options (see Abb. 17.23):
Select the Reference Layer,
Transform into a new CRS,
Setup a different Cell size,
Setup a different Grid Offset,
Clip to Extent: it can be user-defined, bound to a layer or to the map canvas
Output Size,
Add aligned raster to the map canvas.
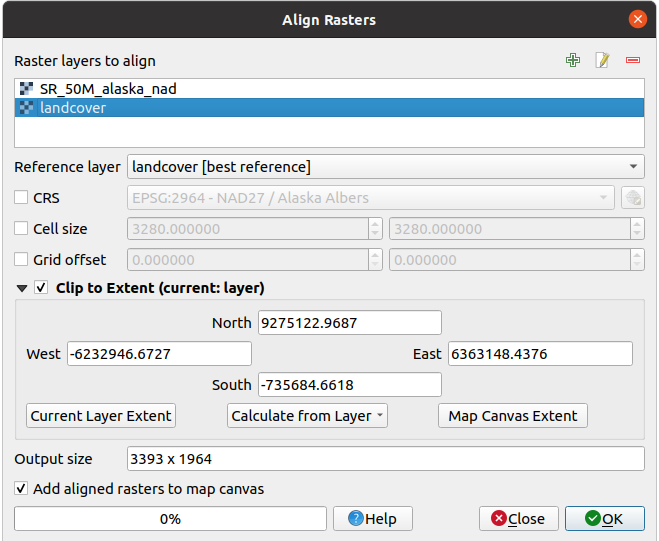
Abb. 17.23 Raster Ausrichtung