Importante
Translation is a community effort you can join. This page is currently translated at 19.20%.
11.3. Elevation Profile View
The Elevation Profile panel is a plotting tool for side view, for visualizing elevation data along a line. It supports vector, raster, mesh and point cloud layers. Data can be of 2D or 3D type.
To add an elevation profile view, go to  menu.
You can add as many profile views as you want, and they can be docked, piled on top of each other, or floating.
menu.
You can add as many profile views as you want, and they can be docked, piled on top of each other, or floating.
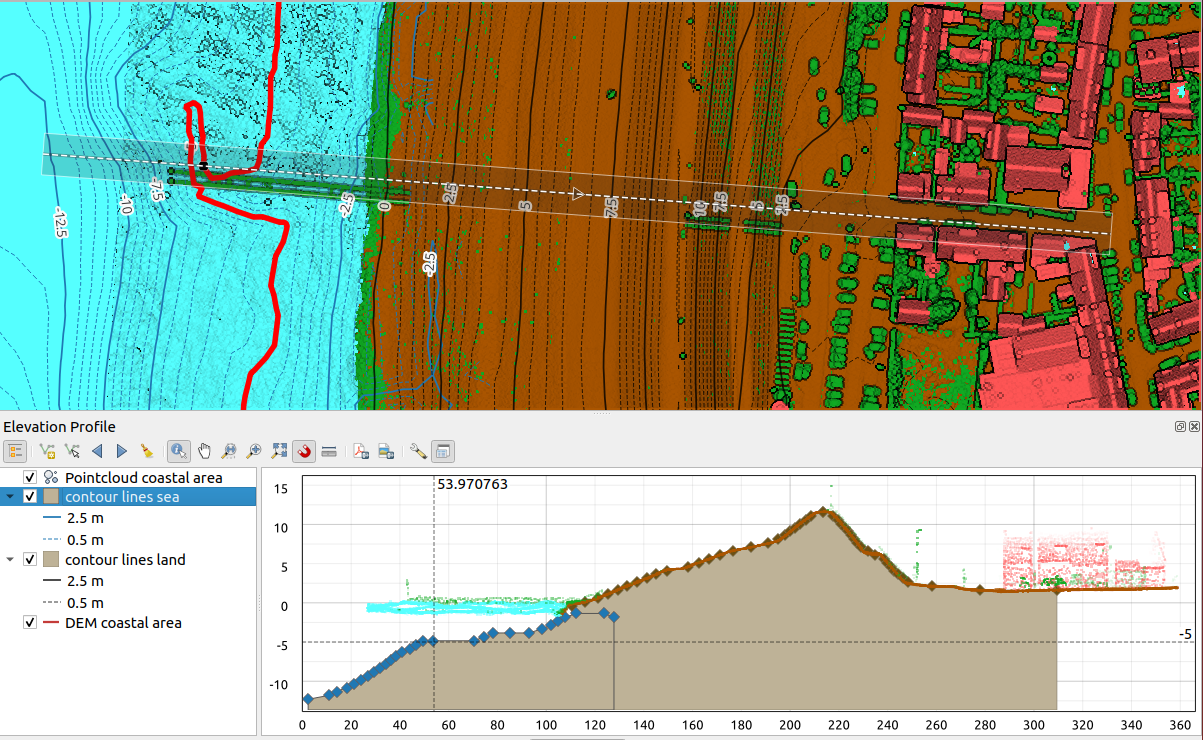
Fig. 11.30 Elevation Profile dialog embedded below main map canvas
Figure shows a coastline with a town behind a sea-dike. A larger tolerance applied to the elevation profile line returns more point cloud features.
11.3.1. The interface
At the top of the Elevation Profile panel, a toolbar provides you with the following tools:
Ferramenta |
Shorcut |
Descrição |
|---|---|---|
|
hold Ctrl while drag-and-drop |
Allows you to add new layers to a plot. |
|
Shows or hides a list of project layers to configure rendering in the profile view. |
|
|
Draws interactively a line over the map canvas to represent the profile curve. |
|
|
Picks an existing line feature on the map canvas and generate a profile curve along that line. |
|
|
Ctrl+Alt+, |
Allows you to slowly move the capture line across the map to the left (e.g. to find the optimal profile line based on the elevation). |
|
Ctrl+Alt+. |
Allows you to slowly move the capture line across the map to the right (e.g. to find the optimal profile line based on the elevation). |
|
Removes the profile line and any plot displayed in the Elevation Profile view |
|
|
Identifies features in the plot canvas via either a single click, or click-and-drag rectangle. Results are shown in the standard Identify Results dock. |
|
|
Space |
Click and drag to pan the plot canvas. Can also be done with the middle mouse button. |
|
Zooms in/out along the horizontal axis, keeping the vertical ratio |
|
|
Ctrl+Space |
Click or click-and-drag a rectangle over the plot to zoom in. Press Alt and click to instead zoom out. |
|
Zooms the Elevation Profile view to the extent of the capture line |
|
|
Allows to snap to the edge or vertex of the plot features in the profile view. Convenient for accurate retrieval of coordinates or distance measurements. |
|
|
Measures horizontal and vertical distances |
|
|
Exports plots to PDF (as high quality vector objects) |
|
|
Exports plots to several image formats |
|
|
Exports plots as 3D features, 2D Profile and Distance/Elevation Table. (The results can be saved as DXF files, CSV files or any of the standard writable vector spatial formats) |
|
|
Provides access to configuration settings of the profile elevation line. |
|
|
Ensures that the horizontal and vertical scales are always kept equal (so that e.g. a 45° slope will appear as a 45° slope in the profile view). |
|
Allows to render distances in the profile chart with units other than the map canvas units. |
||
Sets how far from the actual profile line a point can reside within to be included in the results. Uses the map units and is ignored by other layer or geometry types. |
||
|
Switch between docked and floating status of the view |


In the bottom left, a copy of the Layers panel can be displayed
pushing the  Show Layer Tree button.
This is however an independent widget, with its own set of visible layers, in a custom stack order.
It allows you to control layers rendering and behavior within the plot canvas:
Show Layer Tree button.
This is however an independent widget, with its own set of visible layers, in a custom stack order.
It allows you to control layers rendering and behavior within the plot canvas:
Tick the box next to the layer name to set whether it should be rendered in the plot canvas
Drag-and-drop layers up or down to change the order of the layers
style rendering of layers in the profile view: double-click a layer or right-click and select Properties… to open the layer’s Elevation properties tab for configuration. A summary of elevation settings is displayed as tooltip when hovering over the layer.
On the right of the layer tree, the plot canvas is the main place you can preview the elevation profile of the enabled layers. It is based on a graduated grid in which the horizontal axis displays the length of the profile line and the vertical axis displays the Z elevation of the observed features. It also allows a set of interactions such as zooming, panning, measuring, identifying features, … using the tools at the top.
11.3.2. Creating an elevation profile
To create a profile view, you can:
Go to
 menu.
The Elevation profile panel opens.
menu.
The Elevation profile panel opens.Create the profile line along which the terrain and the features will be rendered. Select a drawing tool:
 Capture Curve: click left over the main map canvas to add vertices
and click right to finalize a line that will be used as profile line
Capture Curve: click left over the main map canvas to add vertices
and click right to finalize a line that will be used as profile lineor
 Capture Curve From Feature:
click a line feature on the map canvas to select it as the profile line.
If multiple features are present at the clicked point then a popup menu will appear
allowing you to select among them.
Capture Curve From Feature:
click a line feature on the map canvas to select it as the profile line.
If multiple features are present at the clicked point then a popup menu will appear
allowing you to select among them.
All the line digitizing capabilities such as the snapping options, tracing, digitizing techniques or the advanced digitizing panel are available for use.
The plot canvas may start rendering some features.
The next step is to configure the elevation properties of the layers you want to visualize.
Push on the
Show Layer Tree button to display the list of layers.
By default, not all the layers of the project are loaded and referenced in the profile tool;
e.g., raster layers which are not marked as having elevation data in their properties are ignored.
Clicking the  Add layers button will show a filtered list of possible layers
which can be added to the plot, but which currently aren’t in the plot.
Applying the dialog with selected layers will automatically mark them as having elevation data
and immediately add them to the plot.
Add layers button will show a filtered list of possible layers
which can be added to the plot, but which currently aren’t in the plot.
Applying the dialog with selected layers will automatically mark them as having elevation data
and immediately add them to the plot.Dica
Holding Ctrl key, it is possible to drag and drop additional layers from the main layer tree to one in the elevation profile tool.
Toggle visibility of the layers you are interested in. These are the only ones rendered in the profile view and selected layers can be different from the main Layers panel’s.
Double-click a layer name or right-click and select Properties. The Elevation properties tab of the layer opens. This is the place you configure how each feature or terrain should render on the profile view. Available properties depend on the layer type:
The profile view starts rendering terrain or features of active layers crossing the given profile curve, as soon as they have elevation properties configured.
Under
 Options drop-down menu, you can set the Tolerance value.
This value is used to create a flat buffer around the elevation profile line, visible in the main map canvas.
Any visible point feature overlapping that buffer will be captured in the plot canvas.
Options drop-down menu, you can set the Tolerance value.
This value is used to create a flat buffer around the elevation profile line, visible in the main map canvas.
Any visible point feature overlapping that buffer will be captured in the plot canvas.
11.3.3. Interacting with the profile Views
When an elevation profile line is created, the plot canvas zooms to its full extent. On the X-axis you can see the length of the profile and, on the Y-axis the height range between minimum and maximum height captured, both in map units.
When you move the mouse pointer in the elevation profile view, you will see two crossing dot lines:
the vertical line shows the height information
the horizontal line shows the distance from the beginning of the elevation profile Line
When you move the mouse pointer in the elevation profile canvas, you can also see a black dot move along the elevation profile line on the main map canvas. At the middle of the profile line, an arrow indicates its direction.
As for the main map canvas, QGIS provides means to navigate on the plot canvas:
 Pan is used to move the elevation profile extent in any direction you want.
Holding Space key while moving the mouse also shifts the plot canvas extent.
Pan is used to move the elevation profile extent in any direction you want.
Holding Space key while moving the mouse also shifts the plot canvas extent. Zoom X Axis is used to zoom in along the horizontal axis,
keeping the ratio of the vertical axis (the elevation) the same.
Left click to stretch out the plot along the X axis, with the clicked point at the center of the axis,
or drag a rectangle to stretch out the plot along the X axis to the rectangle width.
Hold Alt while using Zoom X Axis to zoom out along that axis.
Zoom X Axis is used to zoom in along the horizontal axis,
keeping the ratio of the vertical axis (the elevation) the same.
Left click to stretch out the plot along the X axis, with the clicked point at the center of the axis,
or drag a rectangle to stretch out the plot along the X axis to the rectangle width.
Hold Alt while using Zoom X Axis to zoom out along that axis. Zoom is used to zoom in on a certain point (using left click),
or to a certain extent (dragging a rectangle on the area).
Hold Alt while using Zoom to instead zoom out.
In combination with the Ctrl key you can zoom in or out more smoothly.
Zoom is used to zoom in on a certain point (using left click),
or to a certain extent (dragging a rectangle on the area).
Hold Alt while using Zoom to instead zoom out.
In combination with the Ctrl key you can zoom in or out more smoothly. Zoom Full is the default zoom level used at the beginning
and shows the full extent of the profile line, with all returned features.
Use it to reset the zoom level.
Zoom Full is the default zoom level used at the beginning
and shows the full extent of the profile line, with all returned features.
Use it to reset the zoom level.
It is also possible to interact with the elements displayed in the plot canvas:
Press
 Enable snapping button to accurately catch points, vertices or edges of the features,
for an accurate measurement or coordinates report.
Enable snapping button to accurately catch points, vertices or edges of the features,
for an accurate measurement or coordinates report. Identify Features is used to identify features of the visible layers in the layer tree.
You can drag a rectangle across several features in the profile view to query all of them.
When compatible with the format (e.g. vector, point cloud), these features will be highlighted in the main map canvas.
Identify Features is used to identify features of the visible layers in the layer tree.
You can drag a rectangle across several features in the profile view to query all of them.
When compatible with the format (e.g. vector, point cloud), these features will be highlighted in the main map canvas. Measurement Distances: click or select two points in the plot canvas
to report the horizontal Distance, the Elevation
and the Total distance between them, in map units.
Measurement Distances: click or select two points in the plot canvas
to report the horizontal Distance, the Elevation
and the Total distance between them, in map units. Nudge Left and
  Nudge right are used to shift
the position of the elevation profile line in the map canvas to its left or right.
The plot canvas will be redrawn, showing features and terrain overlapping the profile line buffer.
The line is moved sideways using the Tolerance value in Options menu.
Nudge right are used to shift
the position of the elevation profile line in the map canvas to its left or right.
The plot canvas will be redrawn, showing features and terrain overlapping the profile line buffer.
The line is moved sideways using the Tolerance value in Options menu.
Aviso
Closing an elevation profile view or the project currently removes the view from the project.
For more details, give a look to QGIS elevation profile/cross section tool – a deep dive!, a presentation done by Nyall Dawson.