14.3. 课: 林分数字化
除非打算将配准地图用作简单的背景图像,否则下一步自然是将其元素数字化。当您对学校场地数字化时,已经在 课: 创建新的矢量数据集 的有关创建矢量数据的练习中完成了此操作。在本课,您将对地图中显示为绿线的林分边界进行数字化,此地图不是使用航拍图像,而是使用配准地图。
本课目标: 学习一种帮助完成数字化任务的技术,将林分数字化,并最终将清查数据添加到其中。
14.3.1.  跟我做: 提取林分边界
Open your map_digitizing.qgs project in QGIS, that you saved from the
previous lesson.
扫描和配准地图后,可以通过查看图像作为辅助直接开始数字化。例如,如果要数字化的图像是航拍照片,那么这很可能是一种方法。
如果您用来数字化的是一张不错的地图,就像我们的示例一样,很可能会清晰地显示每种元素类型不同颜色的线条信息。使用类似 GIMP 这样的图像处理软件,可以相对容易地提取用来辅助数字化的单独图像,如下所示。
第一步是使用GIMP获取仅包含林分的图像,即可以在原始扫描地图中看到的所有绿色线条:
打开GIMP (如果您还未安装,可以从网上下载或咨询您的老师)。
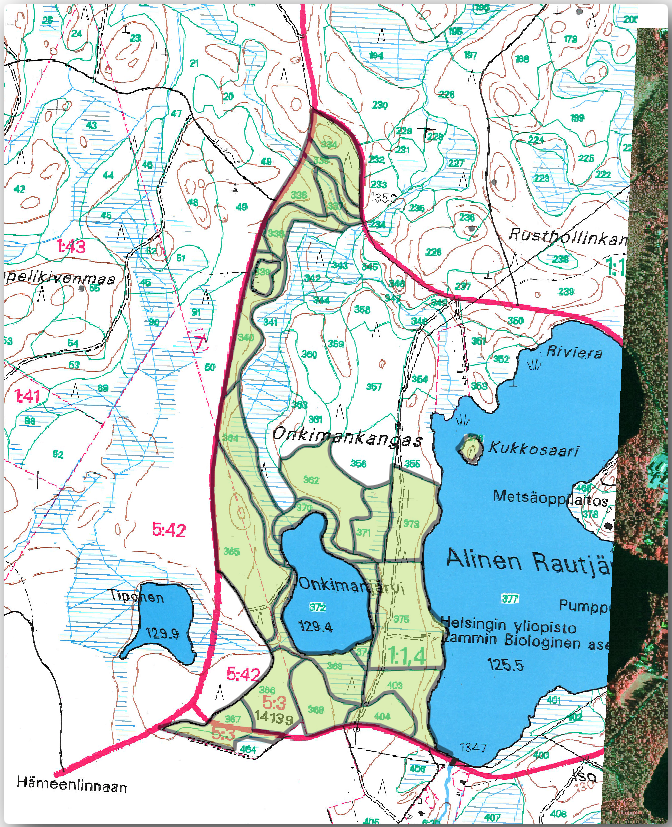
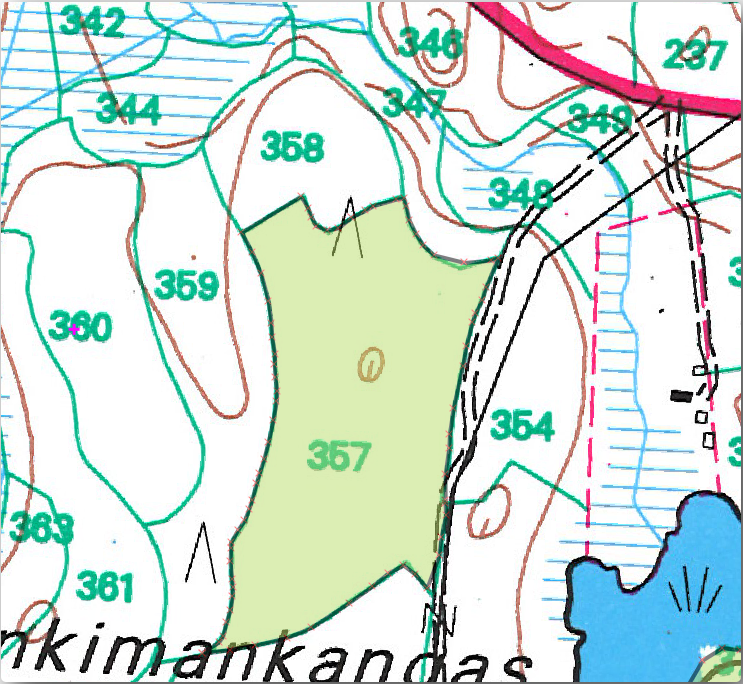
Open the original map image, ,
rautjarvi_map.tifin theexercise_data/forestryfolder. Note that the forest stands are represented as green lines (with the number of the stand also in green inside each polygon).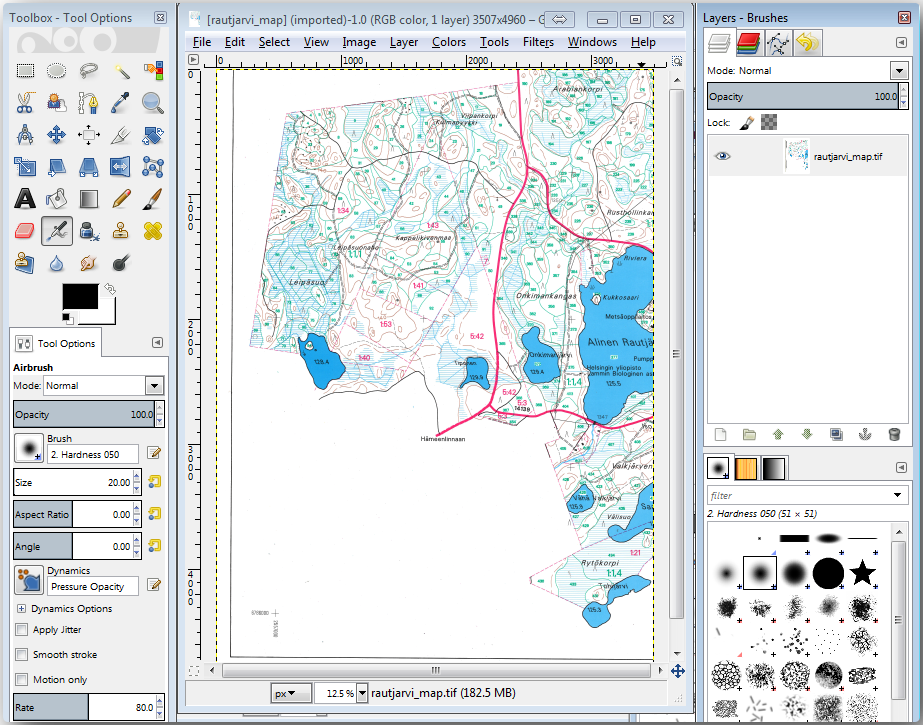
现在,您可以选择图像中构成林分边界的像素 (绿色像素):
打开工具 。
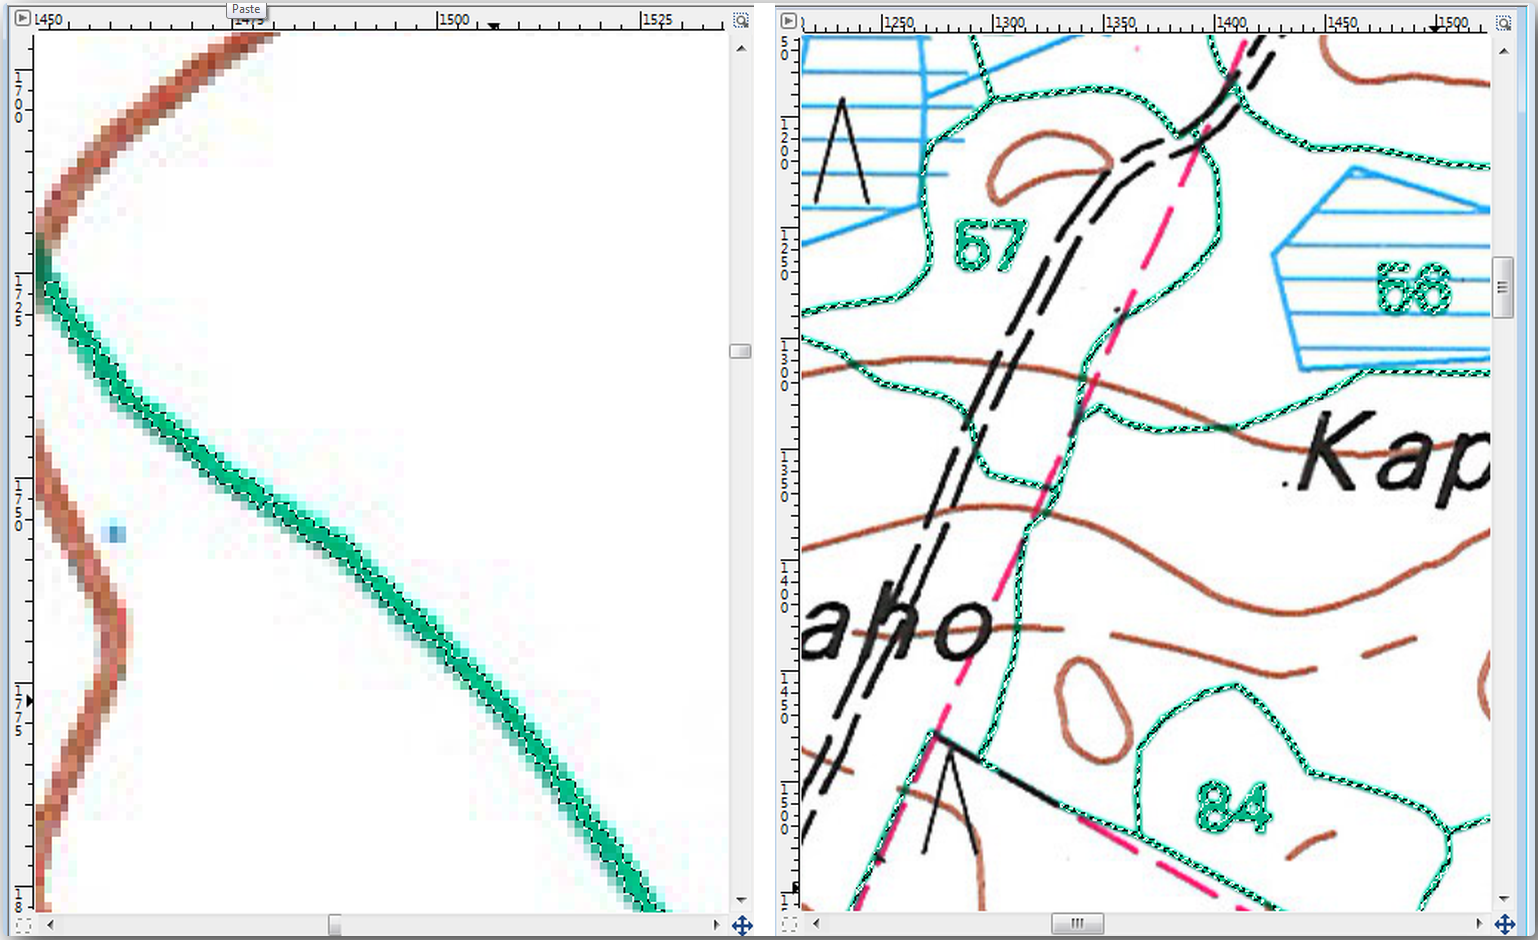
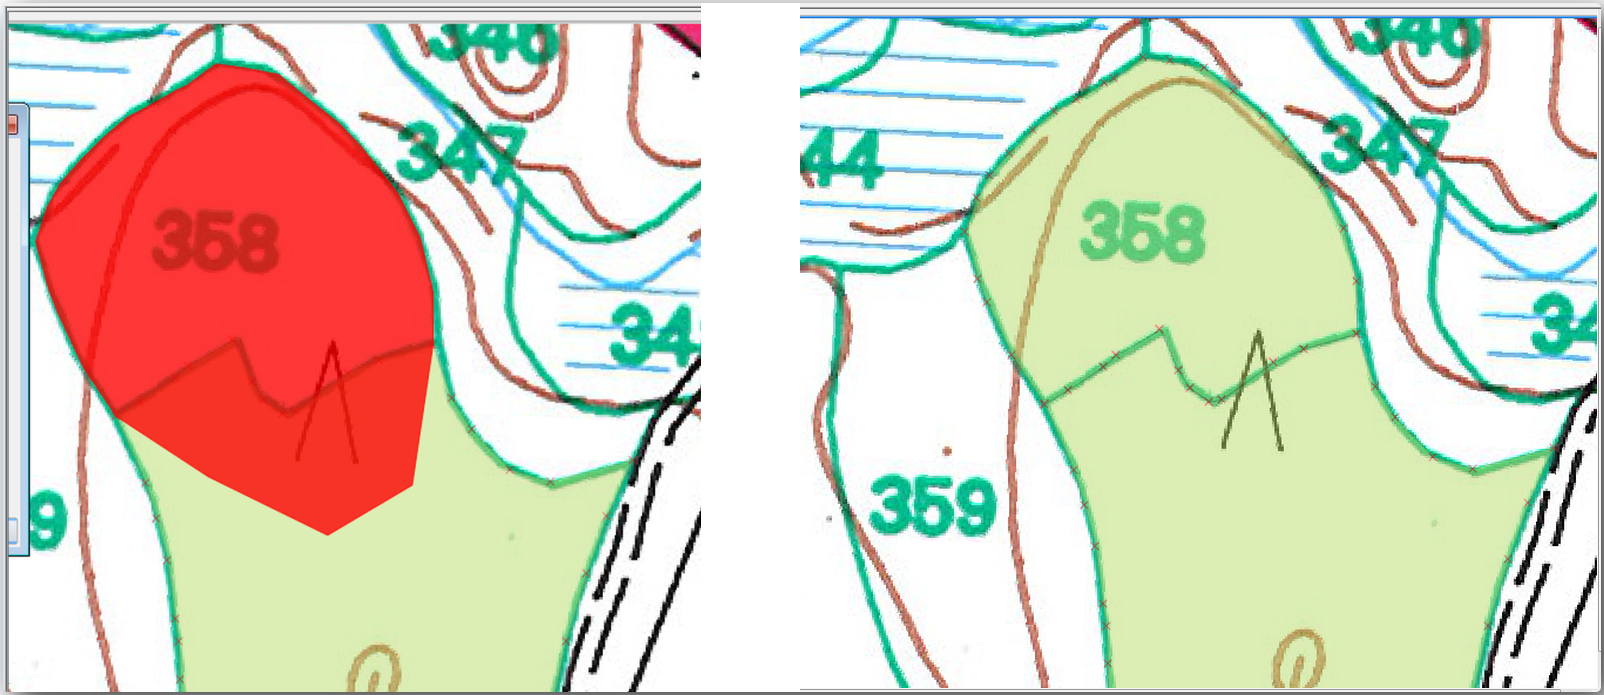
With the tool active, zoom into the image (Ctrl + mouse wheel) so that a forest stand line is close enough to differentiate the pixels forming the line. See the left image below.
在线中间单击并拖动鼠标光标,以便该工具收集多个像素颜色值。
释放鼠标左键并等待几秒钟,与工具收集的颜色相匹配的像素将在整个图像中被选中。
缩小视图,查看在整个图像中绿色像素的选择情况。
如果对结果不满意,请重复单击并拖动操作。
您的像素选择应该类似于下右图。
完成选择后,需要将此选择复制为新图层,然后另存为单独的图像文件:
Copy (Ctr+C) the selected pixels.
And paste the pixels directly (Ctr+V), GIMP will display the pasted pixels as a new temporary layer in the Layers - Brushes panel as a Floating Selection (Pasted Layer).
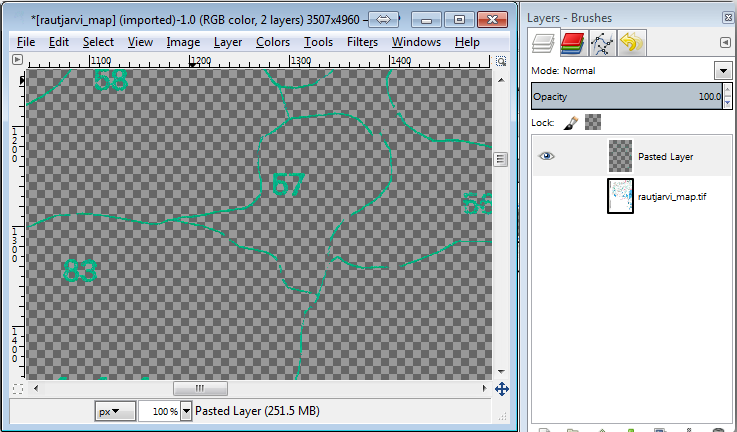
在临时图层上右键单击,然后选择 到新图层 。
单击原图像图层旁边的 "眼睛" 图标将其关闭,这样只有 被粘贴的图层 可见:
Finally, select , set Select File Type (By Extension) as a TIFF image, select the
digitizingfolder and name itrautjarvi_map_green.tif. Select no compression when asked.
您可以对图像中的其他元素执行相同的处理,例如提取表示道路的黑线或表示地形等高线的棕色线。但对我们来说,林分就足够了。
14.3.2. 试一试 配准绿色像素图像
正如在上一课中所做的那样,您需要对该新图像进行地理配准,以便能够将其与其他数据一起使用。
Note that you don't need to digitize the ground control points anymore because this image is basically the same image as the original map image, as far as the Georeferencer tool is concerned. Here are some things you should remember:
This image is also, of course, in
KKJ / Finland zone 2CRS.应该使用您保存的GCP 。
请查看 变换设置 。
Name the output raster as
rautjarvi_green_georef.tifin thedigitizingfolder.
检查新栅格是否与原地图完美匹配。
14.3.3. 跟我做: 为数字化创建支点
考虑到QGIS中的数字化工具,您可能已经认为,在数字化时捕捉这些绿色像素会很有帮助。这正是您接下来要做的,通过使用QGIS中可用的捕捉工具,从这些像素创建点,以便稍后使用它们来帮助您在数字化时跟踪林分的边界。
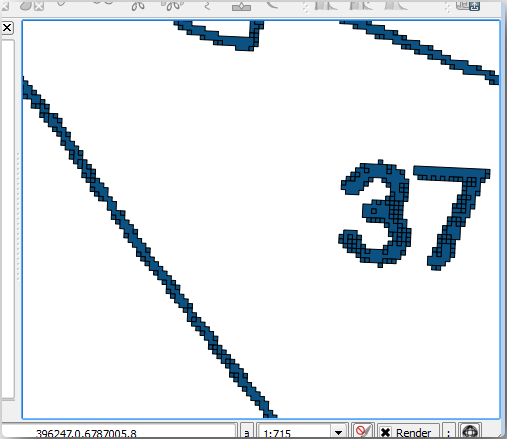
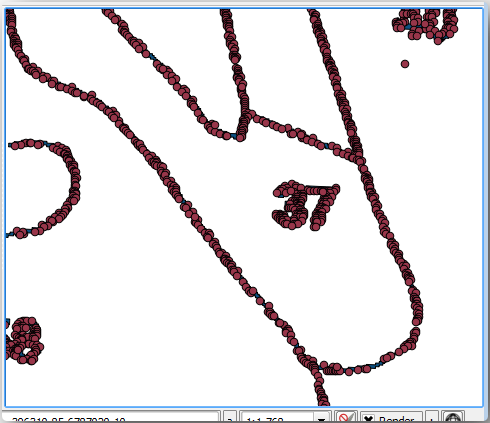
使用 工具将绿线矢量化为多边形。如果忘记如何操作,可以温习 课: 栅格转换为矢量 。
Save as
rautjarvi_green_polygon.shpinside thedigitizingfolder.放大并查看多边形的外观,您会得到这样的结果:
Next option to get points out of those polygons is to get their centroids:
Open .
Set Input Layer to
 rautjarvi_green_polygon
(the polygon layer you have just created)
rautjarvi_green_polygon
(the polygon layer you have just created)Set Centroids output to
green_centroids.shpfile within the folderdigitizingCheck

Press Run. This will calculate the centroids for the polygons as a new layer and add it to the project.
Now you can remove the
rautjarvi_green_polygonlayer from the TOC.Change the symbology of the centroids layer as follows:
Open the Layer Properties for

green_centroids.转到 符号化 选项卡。
Set Size to
1.00and choose
不需要将点相互区分开,只需要它们在那里,捕捉工具就可以使用。现在,您可以使用这些点来跟随原线条,这比不使用它们要容易得多。
14.3.4. 跟我做: 数字化林分
现在,您可以开始真正的数字化工作了。可以先创建 多边形类型 的矢量文件,但对于本练习,有一个Shapefile,其中关注区的一部分已经数字化。您只需将主要道路 (宽粉色线) 和湖泊之间剩下的一半林分数字化即可:
Go to the
digitizingfolder using your file manager browser.Drag and drop the
forest_stands.shpvector file to your map.Change the new layer's symbology so that it will be easier to see the polygons that have already been digitized.
Set Fill color to green - and change the Opacity to
50%.Select Simple Fill and set Stroke width to
1.00 mm.
现在,您还记得之前单元学习的内容吗?我们必须设置并激活捕捉选项:
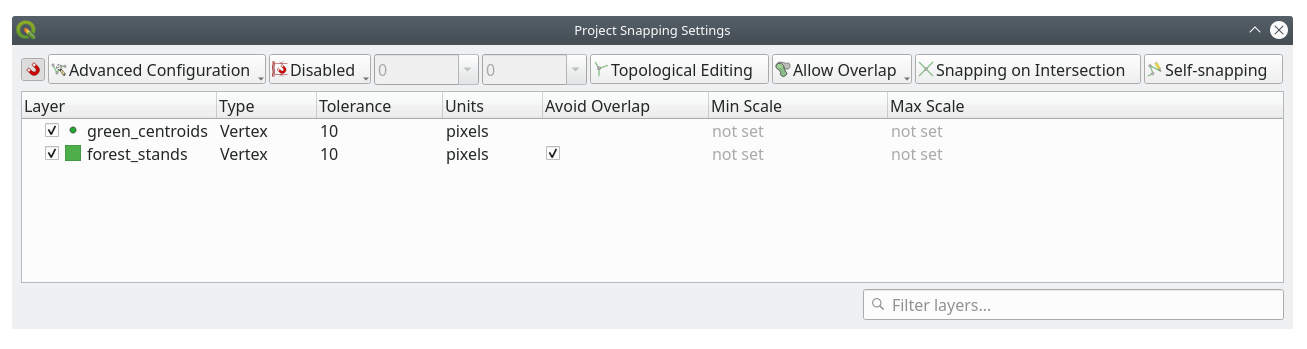
Go to
Press
 Enable Snapping and select Advanced Configuration
Check the green_centroids and forest_stands layers
Set Type for each layer to Vertex
Set Tolerance for each layer to
10Set Units for each layer to pixels
Check
Avoid Overlap for the forest_stands layerPress
 Topological editing
Choose
 Follow Advanced Configuration
Close the pop-up
With these snapping settings, whenever you are digitizing and get close enough to one of the points in the centroids layer or any vertex of your digitized polygons, a pink square will appear on the point that will be snapped to.
Finally, turn off the visibility of all the layers except forest_stands and rautjarvi_georef. Make sure that the map image has not transparency any more.
A few important things to note before you start digitizing:
不要试图过于精确数字化边界。
如果边界是一条直线,只需两个结点即可将其数字化。通常,使用尽可能少的结点进行数字化。
仅当您认为需要精确时才放大到近距离,例如,在某些拐角处,或者当您希望某个多边形在某个结点与另一个多边形连接时。
在数字化时,使用鼠标中键进行放大/缩小和平移。
一次仅能数字化一个多边形。
数字化一个多边形后,写出从地图上可以看到的林分ID。
现在您可以开始数字化了:
Locate the forest stand number
357in the map window.Select the
forest_standslayer.Click the
 Toggle Editing button to enable editing
Select
 Add Polygon Feature tool.
Start digitizing the stand
357by connecting some of the dots. Note the pink crosses indicating the snapping.
When you are done:
Right click to end digitizing that polygon.
Enter the forest stand ID within the form (in this case
357).单击 确定 。
If a form did not appear when you finished digitizing the polygon, go to and make sure that the Suppress attribute form pop-up after feature creation is not checked.
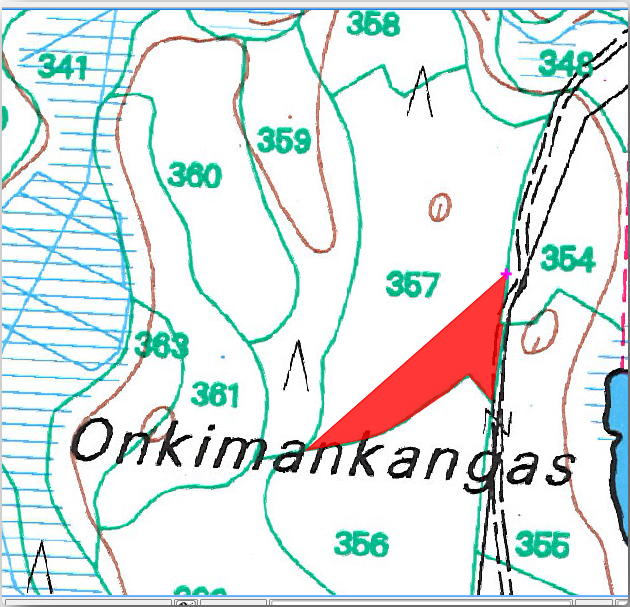
您的数字化多边形如下所示:
Now for the second polygon, pick up the stand number 358. Make sure that
Avoid Overlap is checked for the forest_stands layer (as shown above). This
option ensures polygons do not overlap. So, if you
digitize over an existing polygon, the new polygon will be trimmed to meet
the border of the existing polygons. You can use this option
to automatically obtain a common border.
在林分357的一个公共角开始数字化林分358。
Continue normally until you get to the other common corner for both stands.
最后,数字化多边形357内的几个点,确保公共边界不相交。见下左图。
右键单击完成对林分358的编辑。
Enter the ID as
358.Click OK. Your new polygon should have a common border with the stand 357 as you can see in the image below.
The part of the polygon that was overlapping the existing polygon has been automatically trimmed and you are left with a common border - as you intended it to be.
14.3.5. 试一试 完成林分的数字化
现在您已完成两个林分,和如何数字化的好方法。继续您的数字化,直到已经数字化了所有主要道路和湖泊之间的林分。
这看起来工作量很大,但您很快就会习惯数字化林分。整个过程大概需要15分钟。
在数字化过程中,可能需要编辑或删除结点、分割或合并多边形。您可在 课: 要素拓扑 中学习了有关必要的工具,现在可能是复习的好时机。
请记住, 启用拓扑编辑 激活后,可以移动两个多边形的公共结点,以便同时编辑两个多边形的公共边界。
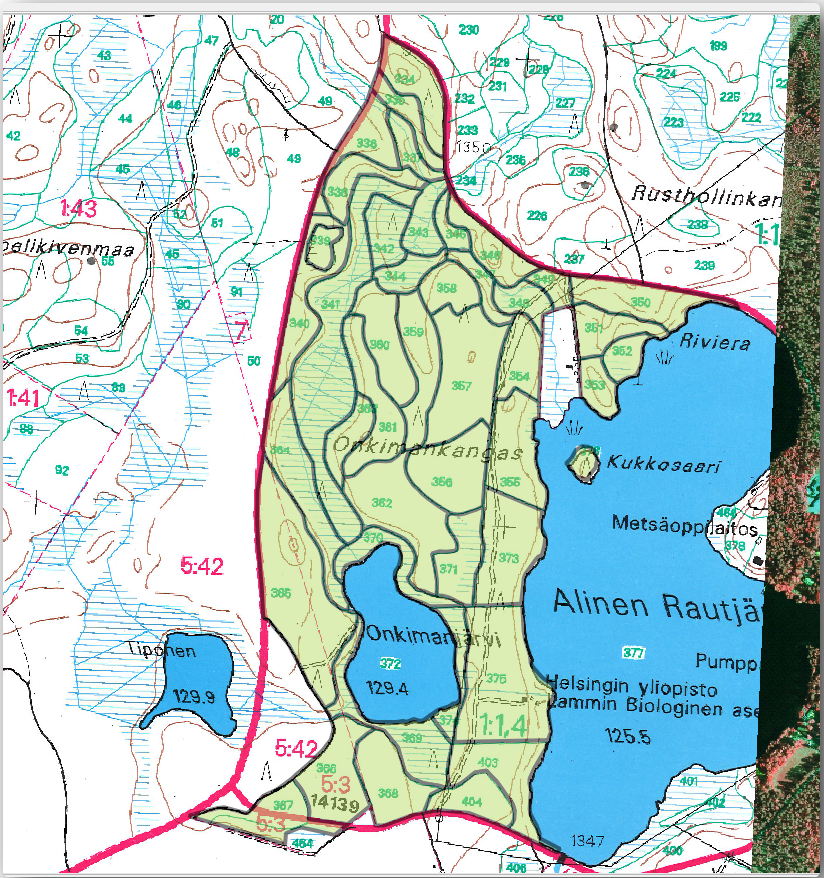
您的成果将如下所示:
14.3.6. 跟我做: 连接林分数据
有可能地图上的森林资源清查数据写在纸上。在这种情况下,您必须首先将数据录入文本文件或电子表格。对于本练习,1994年清单 (与地图相同的清单) 中的信息以逗号分隔文本 (csv) 文件的形式准备就绪。
Open the
rautjarvi_1994.csvfile from theexercise_data\forestrydirectory in a text editor and note that the inventory data file has an attribute called ID that has the numbers of the forest stands. Those numbers are the same as the forest stands ids you have entered for your polygons and can be used to link the data from the text file to your vector file. You can see the metadata for this inventory data in the filerautjarvi_1994_legend.txtin the same folder.Now add this file into the project:
Use the
 Add Delimited Text Layer tool.
This is accessed via .
Add Delimited Text Layer tool.
This is accessed via .Set details in the dialog as follows:
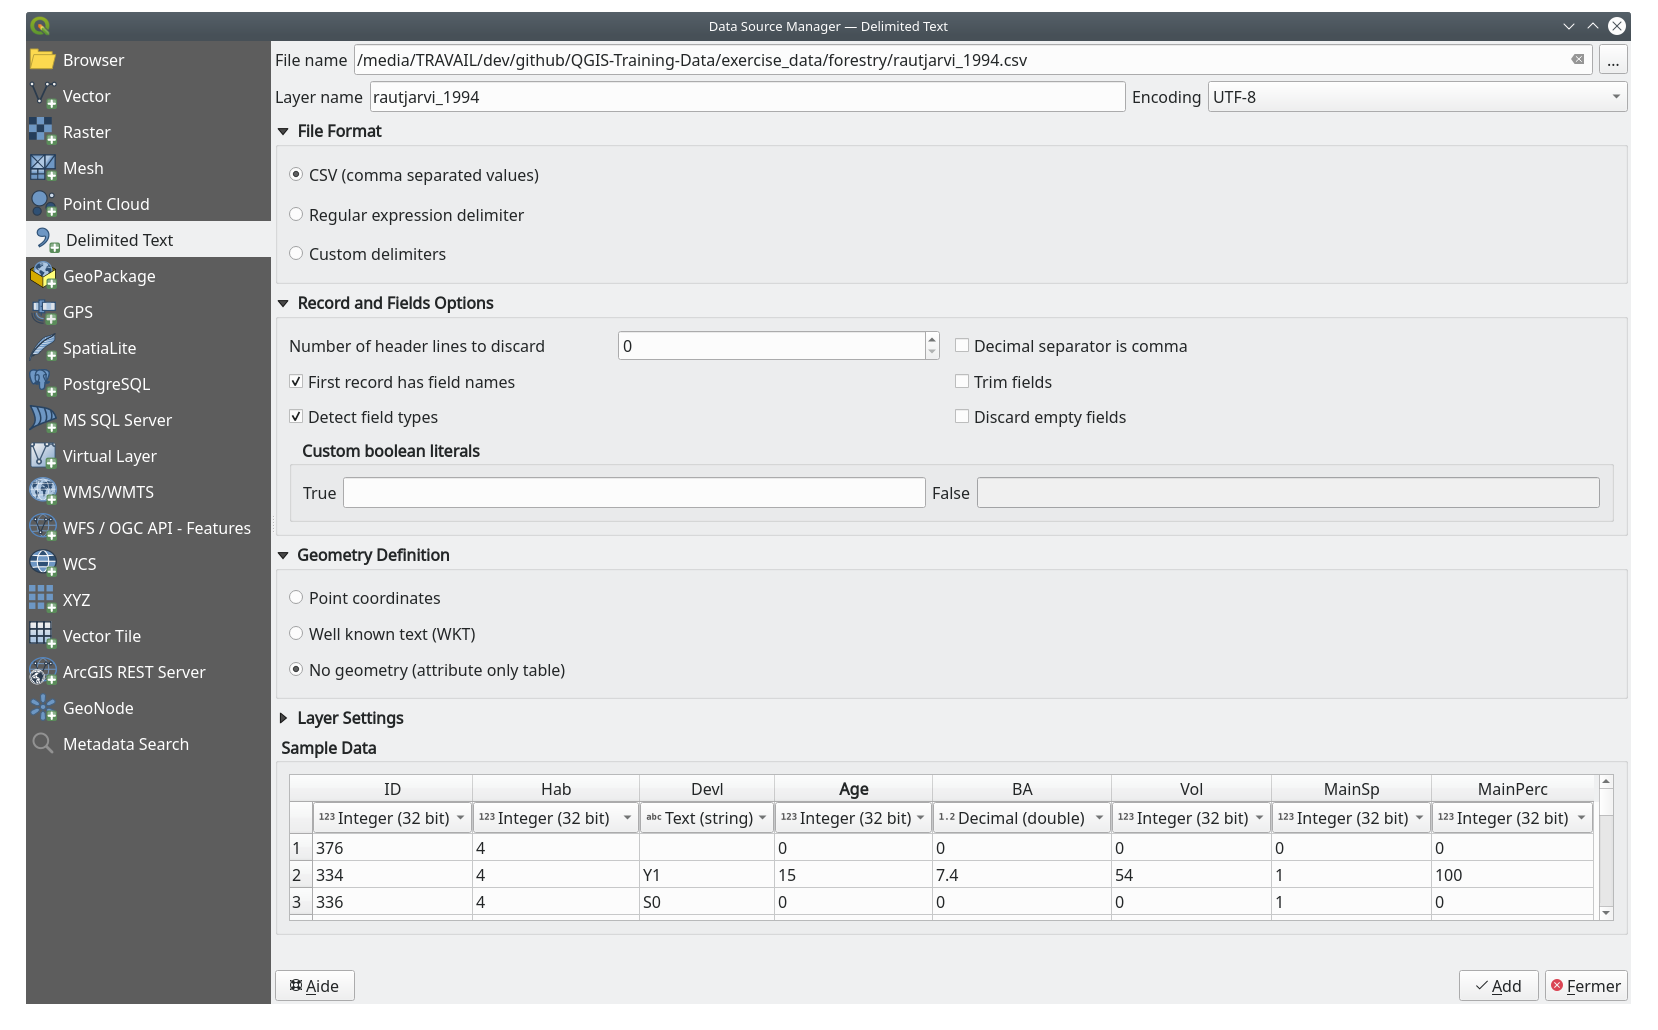
Press Add to load the formatted
csvfile in the project.
To link the data from the
.csvfile with the digitized polygons, create a join between the two layers:Open the Layer Properties for the
forest_standslayer.转到 连接 选项卡。
Click
 Add new join on the bottom of the dialog box.
Select rautjarvi_1994.csv as the Join layer
Set the Join field to ID
Set the Target field to ID
单击 确定 两次。
The data from the text file should be now linked to your vector file. To see
what has happened, select the forest_stands layer and use  Open Attribute Table.
You can see that all the attributes from the inventory data file are now linked
to your digitized vector layer.
Open Attribute Table.
You can see that all the attributes from the inventory data file are now linked
to your digitized vector layer.
You will see that the field names are prefixed with rautjarvi_1994_. To change this:
Open the Layer Properties for the
forest_standslayer.转到 连接 选项卡。
Select Join Layer rautjarvi_1994
Click the
Edit selected join button to enable editingUnder
Custom field name prefix remove the prefix name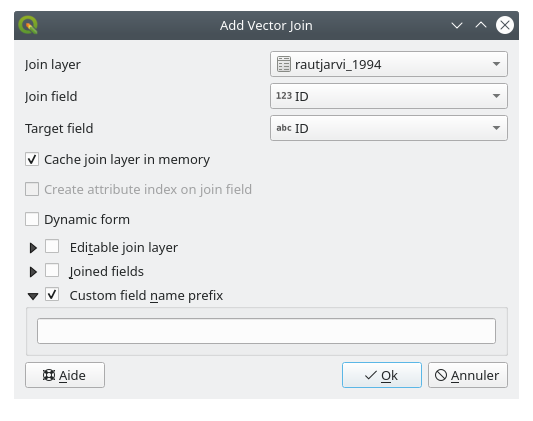
The data from the .csv file is just linked to your vector file. To make
this link permanent, so that the data is actually recorded to the vector file
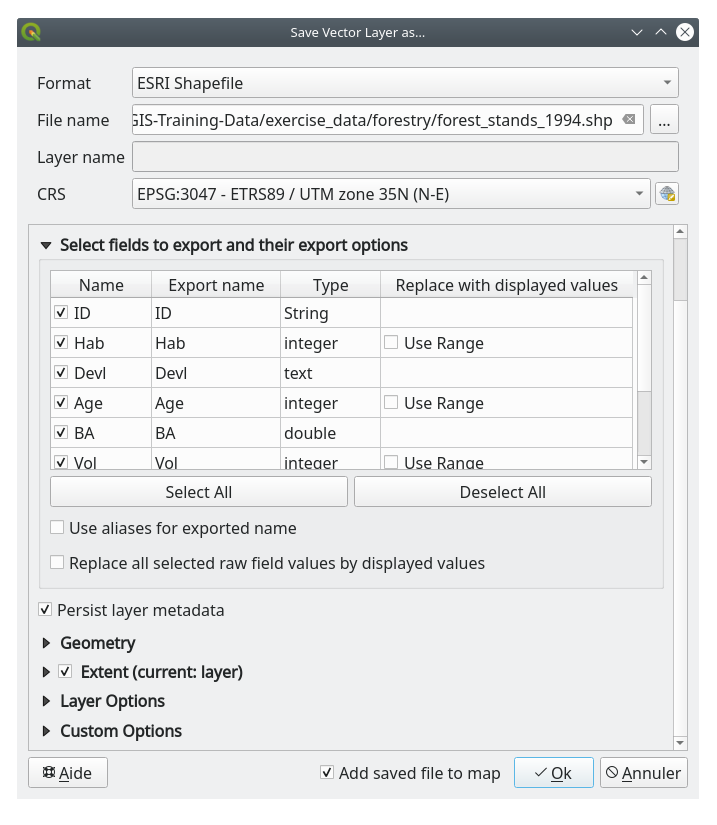
you need to save the forest_stands layer as a new vector file. To do this:
Right click on
forest_standslayerChoose
Set Format to ESRI Shapefile
Set file name to
forest_stands_1994.shpunder theforestryfolderTo include the new file as a layer in the project, check
Add saved file to map
14.3.7. Try Yourself Adding Area and Perimeter
To finish gathering the information related to these forest stands, you might
calculate the area and the perimeter of the stands. You calculated areas for
polygons in 课: 补充练习. Go back to that
lesson if you need to and calculate the areas for the forest stands. Name the
new attribute Area and make sure that the values calculated are in hectares.
You could also do the same for the perimeter.
Now your forest_stands_1994 layer is ready and packed with all the
available information.
Save your project to keep the current map layers in case you need to come back later to it.
14.3.8. In Conclusion
只需点击几下鼠标,您就有了数字格式的旧清查数据,并可以在QGIS中使用。
14.3.9. What's Next?
可以开始使用新数据集进行不同的分析,但您可能更感兴趣的是在更加新的数据集中执行分析。下一课的主题是使用当前的航拍照片创建林分,并将一些相关信息添加到数据集。