14.3. Lesson: Digitizarea Arboretului Forestier
Unless you are going to use your georeferenced map as a simple background image, the next natural step is to digitize elements from it. You have already done so in the exercises about creating vector data in Lesson: Crearea unui Nou Set de Date Vectoriale, when you digitized the school fields. In this lesson, you are going to digitize the forest stands» borders that appear in the map as green lines but instead of doing it using an aerial image, you will use your georeferenced map.
Scopul acestei lecții: Învățarea unei tehnici pentru a ajuta activitatea de digitizare a arboretului forestier și, în cele din urmă, adunarea din acesta a datelor de inventar.
14.3.1.  Follow Along: Extragerea Limitelor Arboretului Forestier
Open your map_digitizing.qgs project in QGIS, that you saved from the
previous lesson.
O dată ce ați scanat și georeferențiat harta, ați putea începe digitizarea, folosind imaginea drept ghid. Acesta ar fi, probabil, cel mai potrivit mod de lucru, atunci când imaginea pe care trebuie să o digitizați reprezintă, de fapt, o fotografie aeriană.
If what you are using to digitize is a good map, as it is in our case, it is likely that the information is clearly displayed as lines with different colors for each type of element. Those colors can be relatively easy extracted as individual images using an image processing software like GIMP. Such separate images can be used to assist the digitizing, as you will see below.
Primul pas va fi de a utiliza GIMP la obținerea unei imagini care conține doar pâlcuri de pădure, reprezentate de toate acele linii verzui pe care le puteți vedea în harta originală, scanată:
Deschideți GIMP (dacă nu l-ați instalat încă, descărcați-l de pe internet sau cereți-l profesorului dvs.).
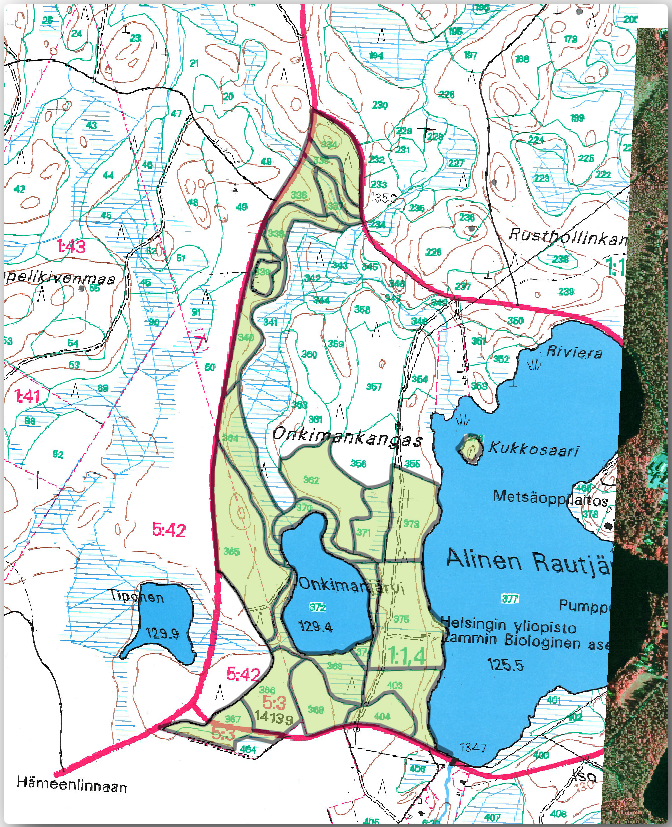
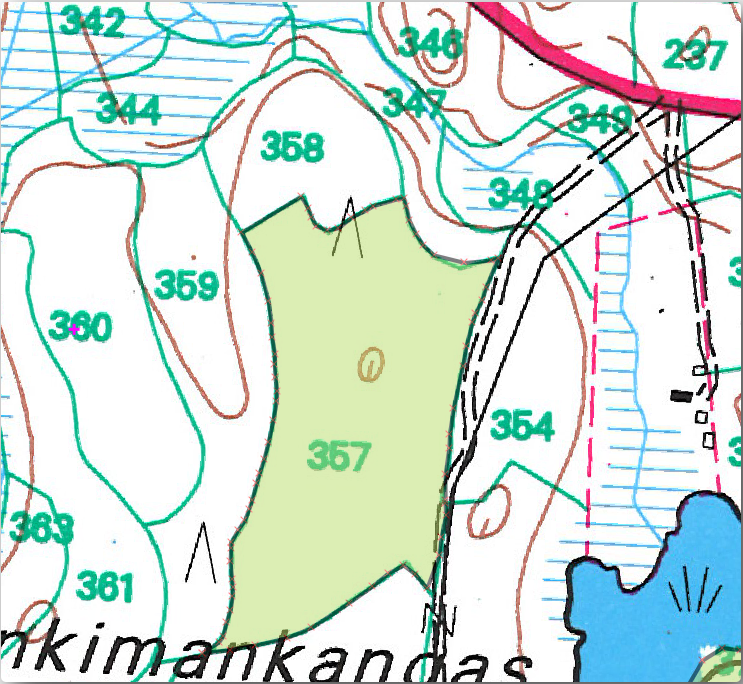
Open the original map image, ,
rautjarvi_map.tifin theexercise_data/forestryfolder. Note that the forest stands are represented as green lines (with the number of the stand also in green inside each polygon).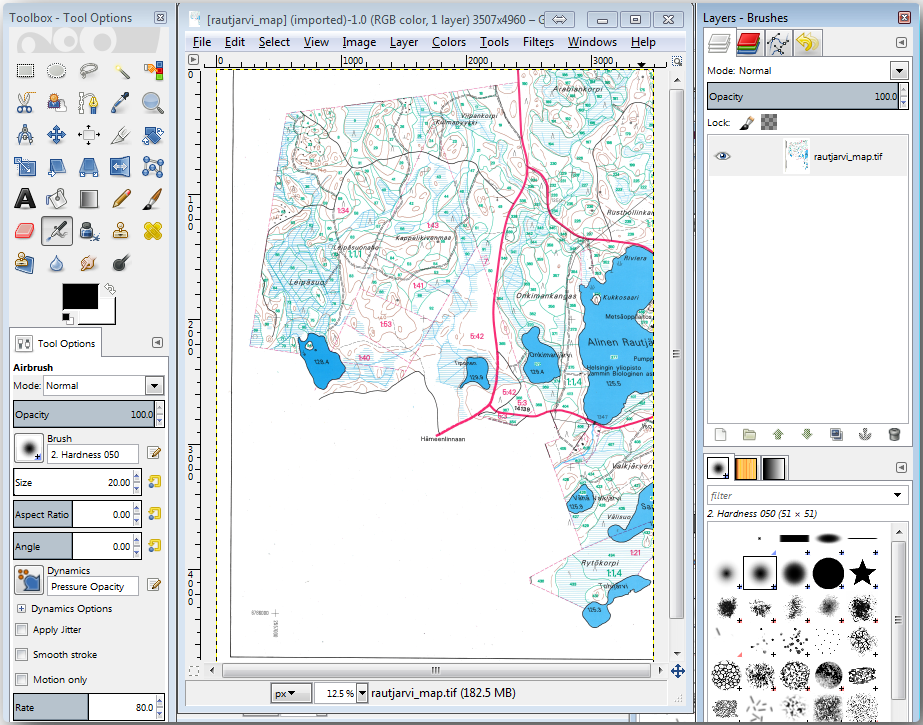
Acum puteți selecta pixelii din imagine, care reprezintă limitele parcelelor forestiere (pixelii verzui):
Deschideți instrumentul .
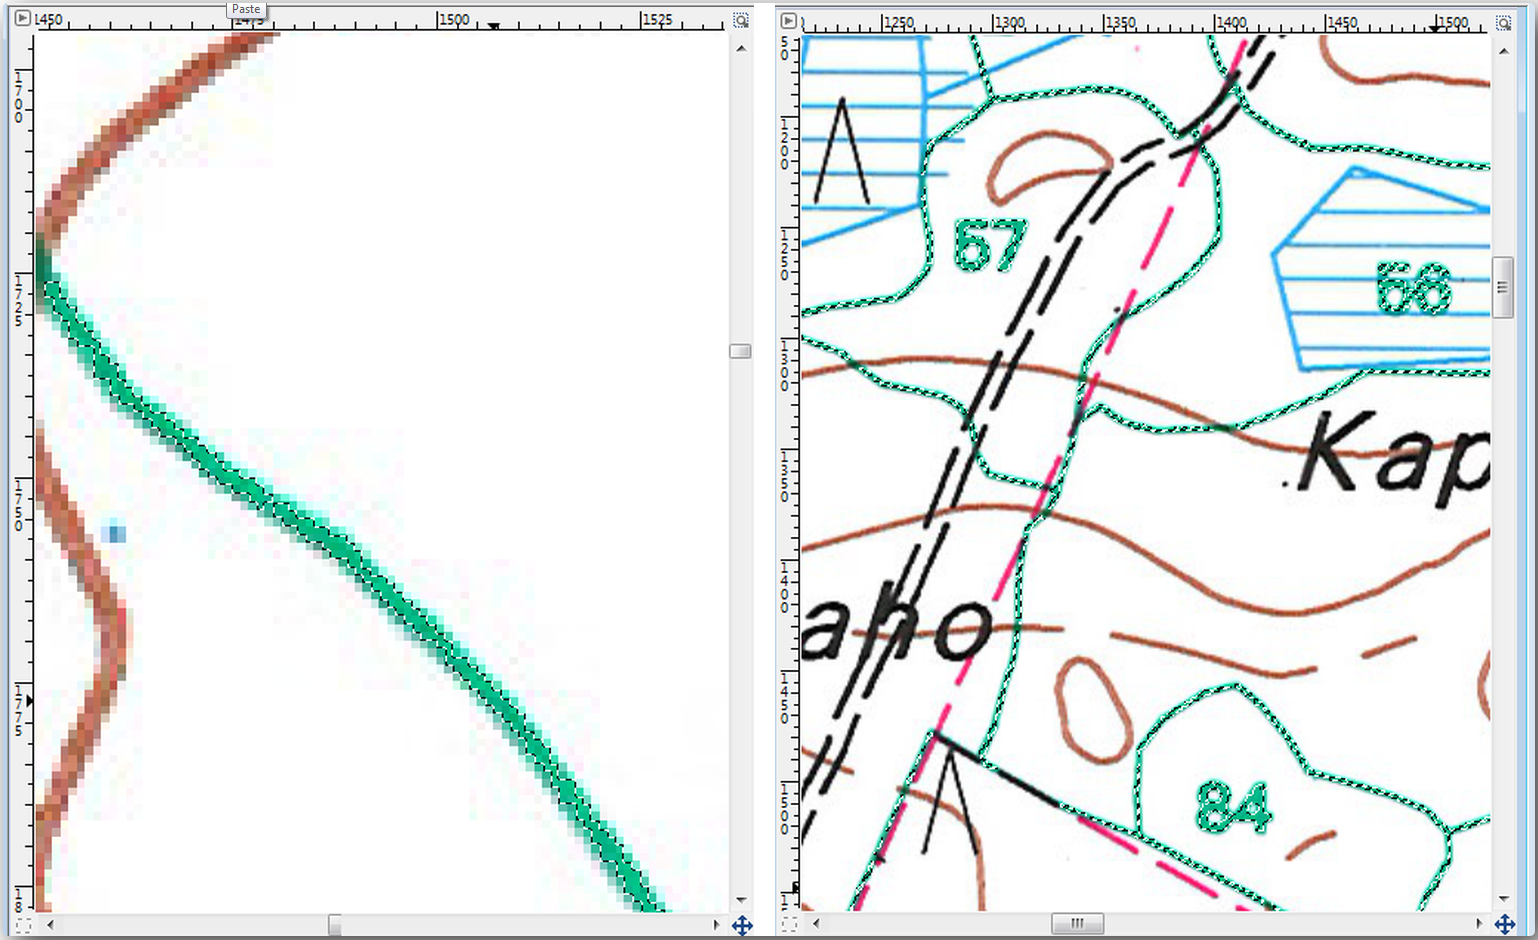
With the tool active, zoom into the image (Ctrl + mouse wheel) so that a forest stand line is close enough to differentiate the pixels forming the line. See the left image below.
Faceți clic și glisați cursorul mouse-ului în partea din mijloc a liniei, astfel încât instrumentul va colecta valorile câtorva dintre culorile pixelilor.
Eliberați butonul mouse-ului și așteptați câteva secunde. Din întreaga imagine vor fi selectați pixelii care se potrivesc culorilor colectate de către instrument.
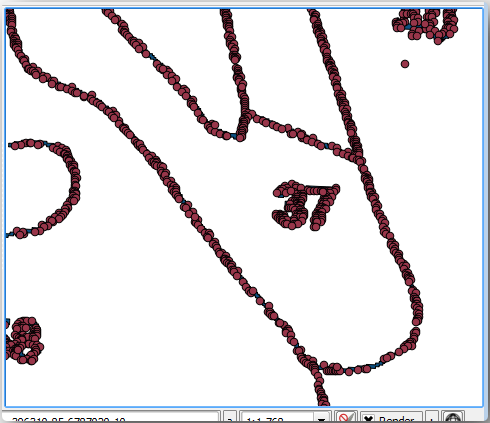
Micșorați, pentru a vedea cum au fost selectați pixelii verzui din întreaga imagine.
Dacă rezultatul nu vă mulțumește, repetați operațiunea de clic și glisare.
Pixelii selectați de către dumneavoastră ar trebui să arate în genul imaginii din dreapta-jos.
O dată ce ați terminat selecția, trebuie să o copiați sub forma unui nou strat, care se va salva ulterior ca fișier de tip imagine:
Copy (Ctr+C) the selected pixels.
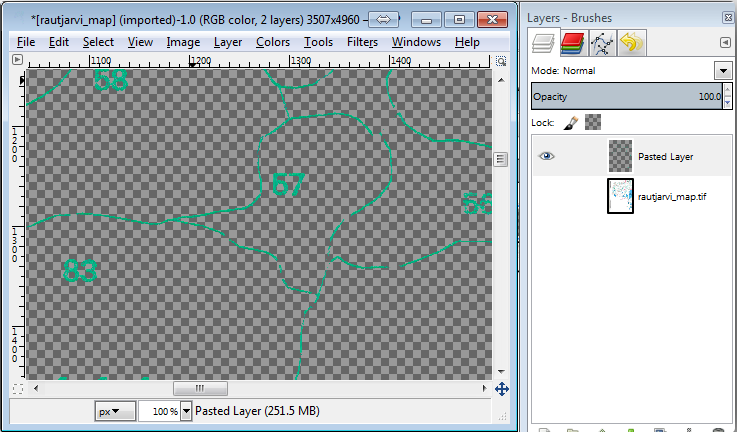
And paste the pixels directly (Ctr+V), GIMP will display the pasted pixels as a new temporary layer in the Layers - Brushes panel as a Floating Selection (Pasted Layer).
Faceți clic dreapta pe stratul temporar, apoi selectați Către Noul Strat.
Faceți clic pe pictograma „ochiului” de lângă stratul de imagine original pentru a-l dezactiva, astfel încât numai Stratul Lipit va fi vizibil:
Finally, select , set Select File Type (By Extension) as a TIFF image, select the
digitizingfolder and name itrautjarvi_map_green.tif. Select no compression when asked.
Ați putea face același proces cu alte elemente din imagine, de exemplu, extrăgând liniile negre care reprezintă drumurile, sau cele maro care reprezintă liniile de contur ale terenului. Dar pentru noi, arboretul forestier este suficient.
14.3.2. Try Yourself Georeferențiați Imaginea Pixelilor Verzi
Ca și în lecția anterioară, trebuie să georeferențiați această nouă imagine pentru a o putea folosi cu restul de date.
Note that you don’t need to digitize the ground control points anymore because this image is basically the same image as the original map image, as far as the Georeferencer tool is concerned. Here are some things you should remember:
This image is also, of course, in
KKJ / Finland zone 2CRS.Ar trebui să utilizați punctele de control din teren salvate, .
Amintiți-vă să revizuiți Setările de Transformare.
Name the output raster as
rautjarvi_green_georef.tifin thedigitizingfolder.
Verificați dacă noul raster se potrivește cu harta originală.
14.3.3. Follow Along: Crearea Punctelor de Sprijin pentru Digitizare
Având în vedere instrumentele de digitizare din QGIS, v-ați putea gândi că ar fi de ajutor acroșarea la pixelii verzi, pe durata digitizării. Exact acest lucru îl veți face în continuare: veți crea puncte din acei pixeli, pentru a le folosi mai târziu ca ghidaje în digitizarea arboretelor forestiere, când se vor utiliza instrumentele de acroșare disponibile în QGIS.
Folosiți instrumentul pentru a vectoriza liniile verzi în poligoane. Dacă nu vă mai amintiți cum se efectuează acest lucru, puteți să reexaminați Lesson: Conversia din Raster în Vector.
Save as
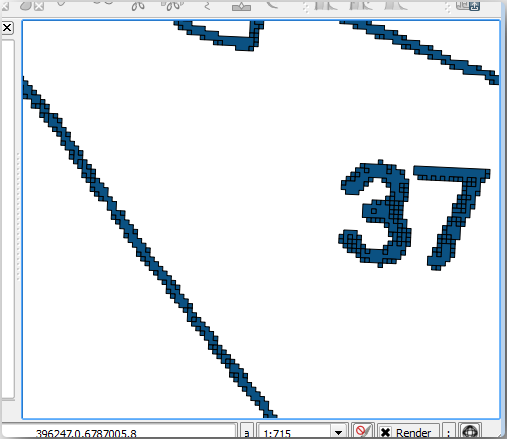
rautjarvi_green_polygon.shpinside thedigitizingfolder.Măriți și analizați forma poligoanelor. Veți obține ceva de genul:
Next option to get points out of those polygons is to get their centroids:
Open .
Set Input Layer to
 rautjarvi_green_polygon
(the polygon layer you have just created)
rautjarvi_green_polygon
(the polygon layer you have just created)Set Centroids output to
green_centroids.shpfile within the folderdigitizingCheck

Press Run. This will calculate the centroids for the polygons as a new layer and add it to the project.
Now you can remove the
rautjarvi_green_polygonlayer from the TOC.Change the symbology of the centroids layer as follows:
Open the Layer Properties for

green_centroids.Mergeți la fila Simbologiei.
Set Size to
1.00and choose
It is not necessary to differentiate points from each other, you just need them to be there for the snapping tools to use them. You can use those points now to follow the original lines much easily than without them.
14.3.4. Follow Along: Digitizarea Pâlcurilor de Pădure
Now you are ready to start with the actual digitizing work. You would start by creating a vector file of polygon type, but for this exercise, there is a shapefile with part of the area of interest already digitized. You will just finish digitizing the half of the forest stands that are left between the main roads (wide pink lines) and the lake:
Go to the
digitizingfolder using your file manager browser.Drag and drop the
forest_stands.shpvector file to your map.Change the new layer’s symbology so that it will be easier to see the polygons that have already been digitized.
Set Fill color to green - and change the Opacity to
50%.Select Simple Fill and set Stroke width to
1.00 mm.
Acum, așa cum vă amintiți de la modulele din trecut, trebuie să configurați și activați opțiunile de acroșare:
Go to
Press
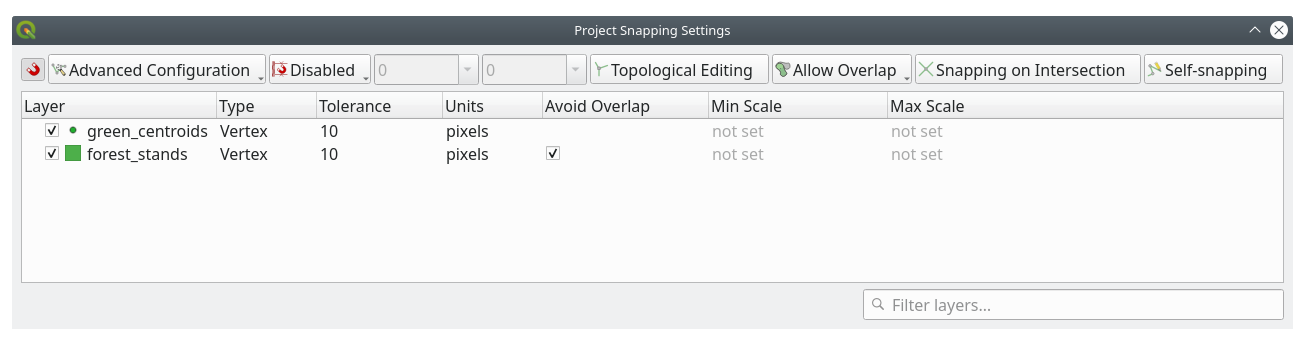
 Enable Snapping and select Advanced Configuration
Check the green_centroids and forest_stands layers
Set Type for each layer to Vertex
Set Tolerance for each layer to
10Set Units for each layer to pixels
Check
Avoid Overlap for the forest_stands layerPress
 Topological editing
Choose
 Follow Advanced Configuration
Close the pop-up
With these snapping settings, whenever you are digitizing and get close enough to one of the points in the centroids layer or any vertex of your digitized polygons, a pink square will appear on the point that will be snapped to.
Finally, turn off the visibility of all the layers except forest_stands and rautjarvi_georef. Make sure that the map image has not transparency any more.
A few important things to note before you start digitizing:
Nu încercați să fiți prea exacți în digitizarea frontierelor.
If a border is a straight line, digitize it with just two nodes. In general, digitize using as few nodes as possible.
Zoom in to close ranges only if you feel that you need to be accurate, for example, at some corners or when you want a polygon to connect with another polygon at a certain node.
Folosiți butonul din mijloc al mouse-ului pentru a mări/micșora și deplasa, pe durata digitizării.
Digitizați doar un singur poligon la un moment dat.
După digitizarea unui poligon, scrieți id-ul pâlcului de pădure pe care îl puteți vedea în hartă.
Acum puteți începe digitizarea:
Locate the forest stand number
357in the map window.Select the
forest_standslayer.Click the
 Toggle Editing button to enable editing
Select
 Add Polygon Feature tool.
Start digitizing the stand
357by connecting some of the dots. Note the pink crosses indicating the snapping.
When you are done:
Right click to end digitizing that polygon.
Enter the forest stand ID within the form (in this case
357).Clic pe OK
If a form did not appear when you finished digitizing the polygon, go to and make sure that the Suppress attribute form pop-up after feature creation is not checked.
Poligonul dvs. digitizat va arăta astfel:
Now for the second polygon, pick up the stand number 358. Make sure that
Avoid Overlap is checked for the forest_stands layer (as shown above). This
option ensures polygons do not overlap. So, if you
digitize over an existing polygon, the new polygon will be trimmed to meet
the border of the existing polygons. You can use this option
to automatically obtain a common border.
Începeți digitizarea standului 358 la unul dintre colțurile comune cu pâlcul 357.
Continue normally until you get to the other common corner for both stands.
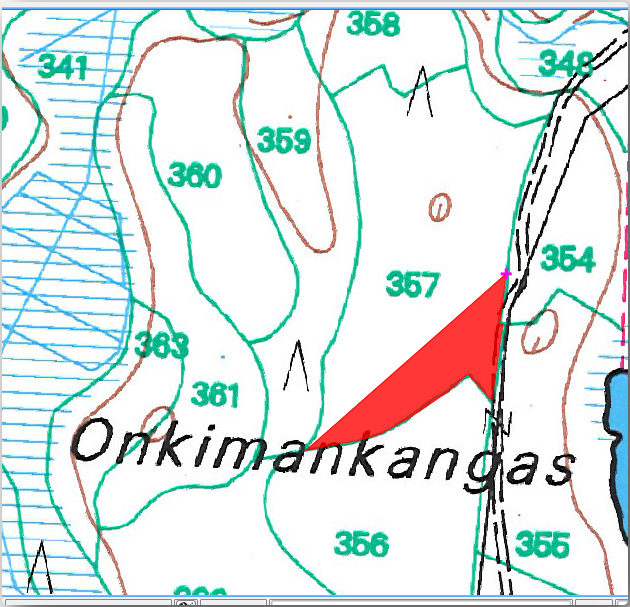
Finally, digitize a few points inside polygon 357 making sure that the common border is not intersected. See left image below.
Clic-dreapta pentru a termina editarea pâlcului de pădure 358.
Enter the ID as
358.Click OK. Your new polygon should have a common border with the stand 357 as you can see in the image below.
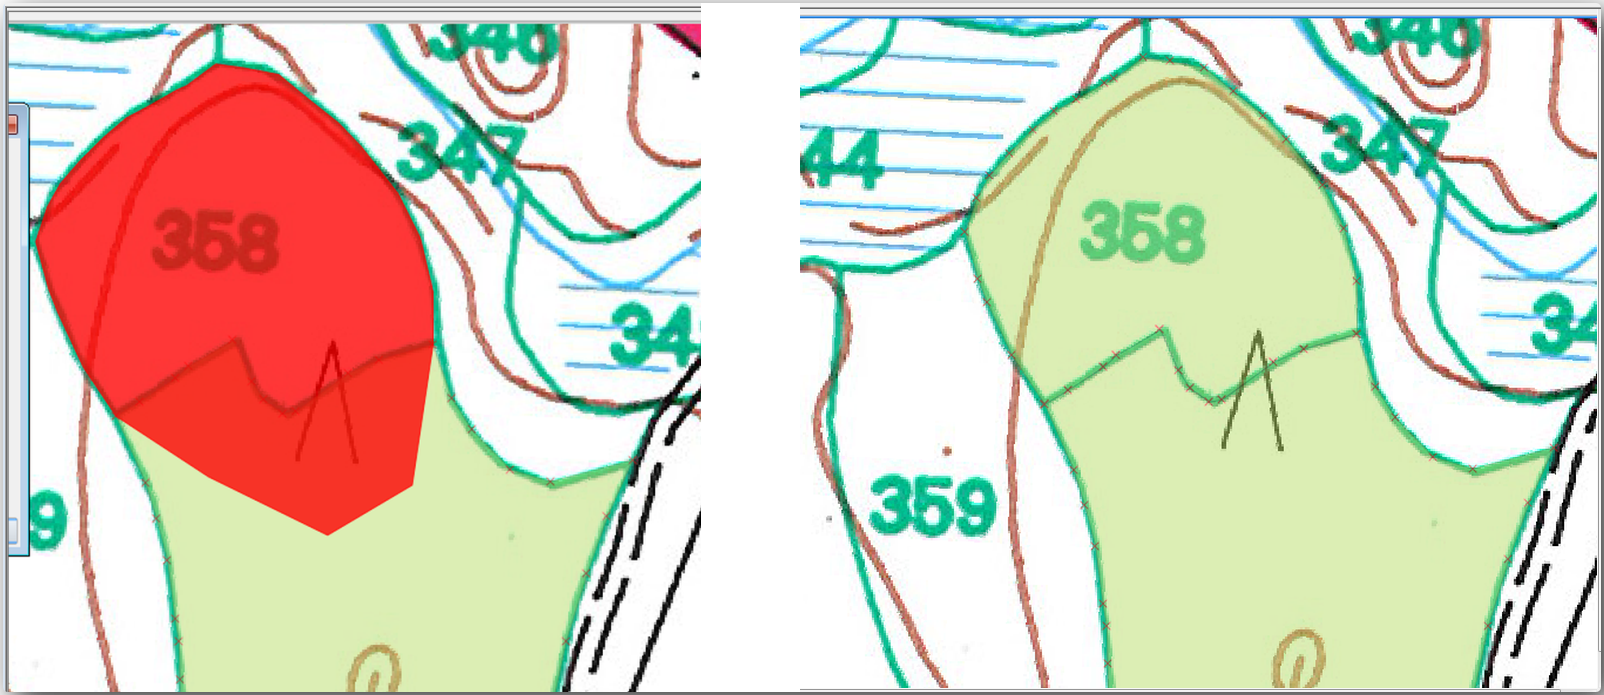
The part of the polygon that was overlapping the existing polygon has been automatically trimmed and you are left with a common border - as you intended it to be.
14.3.5. Try Yourself Încheierea Digitizării Pâlcurilor de Pădure
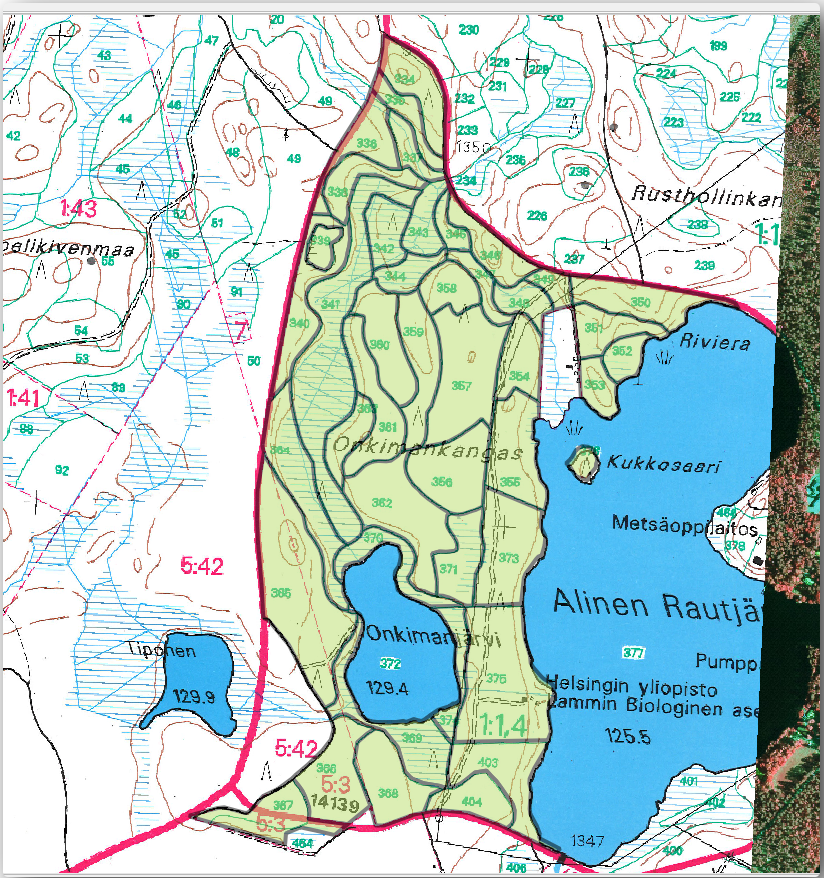
Now you have two forest stands ready. And a good idea on how to proceed. Continue digitizing on your own until you have digitized all the forest stands that are limited by the main road and the lake.
It might look like a lot of work, but you will soon get used to digitizing the forest stands. It should take you about 15 minutes.
During the digitizing you might need to edit or delete nodes, split or merge polygons. You learned about the necessary tools in Lesson: Topologia Entității, now is probably a good moment to go read about them again.
Remember that having Enable topological editing activated, allows you to move nodes common to two polygons so that the common border is edited at the same time for both polygons.
Rezultatul dvs. va arăta în felul următor:
14.3.6. Follow Along: Îmbinarea Datelor pentru Pâlcurile de Pădure
It is possible that the forest inventory data you have for you map is also written in paper. In that case, you would have to first write that data to a text file or a spreadsheet. For this exercise, the information from the inventory for 1994 (the same inventory as the map) is ready as a comma separated text (csv) file.
Open the
rautjarvi_1994.csvfile from theexercise_data\forestrydirectory in a text editor and note that the inventory data file has an attribute called ID that has the numbers of the forest stands. Those numbers are the same as the forest stands ids you have entered for your polygons and can be used to link the data from the text file to your vector file. You can see the metadata for this inventory data in the filerautjarvi_1994_legend.txtin the same folder.Now add this file into the project:
Use the
 Add Delimited Text Layer tool.
This is accessed via .
Add Delimited Text Layer tool.
This is accessed via .Set details in the dialog as follows:
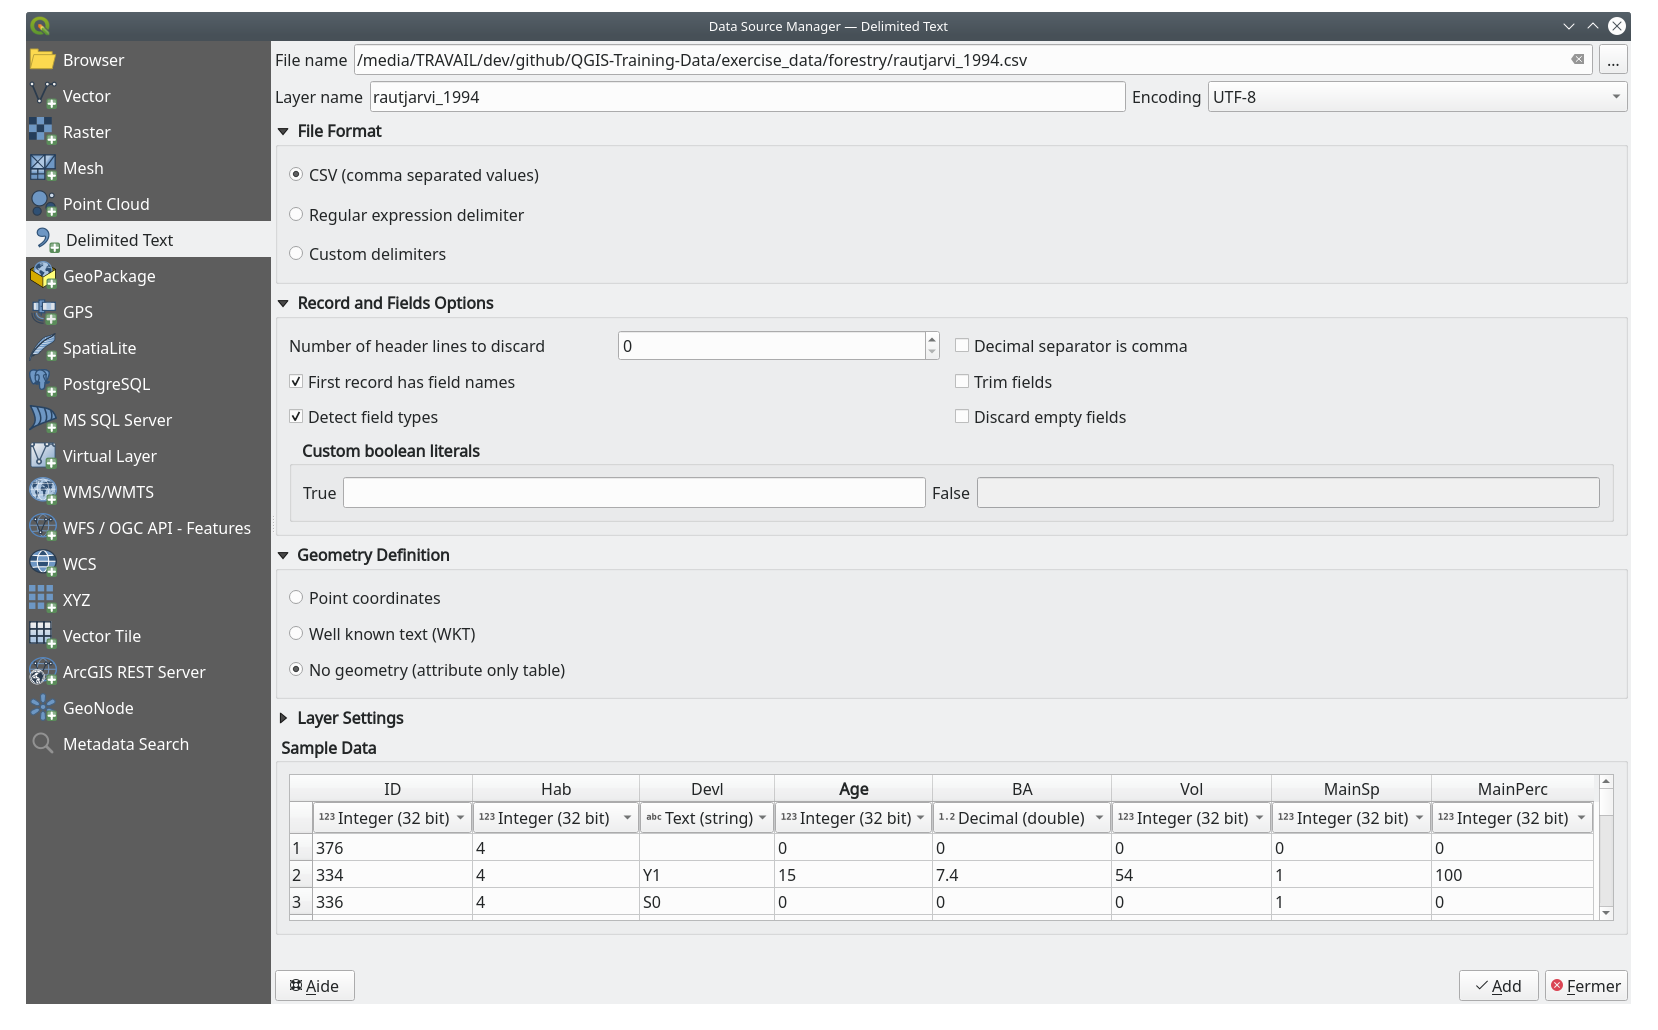
Press Add to load the formatted
csvfile in the project.
To link the data from the
.csvfile with the digitized polygons, create a join between the two layers:Open the Layer Properties for the
forest_standslayer.Mergeți la fila Îmbinări.
Click
 Add new join on the bottom of the dialog box.
Select rautjarvi_1994.csv as the Join layer
Set the Join field to ID
Set the Target field to ID
Faceți clic pe Ok de două ori.
The data from the text file should be now linked to your vector file. To see
what has happened, select the forest_stands layer and use  Open Attribute Table.
You can see that all the attributes from the inventory data file are now linked
to your digitized vector layer.
Open Attribute Table.
You can see that all the attributes from the inventory data file are now linked
to your digitized vector layer.
You will see that the field names are prefixed with rautjarvi_1994_. To change this:
Open the Layer Properties for the
forest_standslayer.Mergeți la fila Îmbinări.
Select Join Layer rautjarvi_1994
Click the
Edit selected join button to enable editingUnder
Custom field name prefix remove the prefix name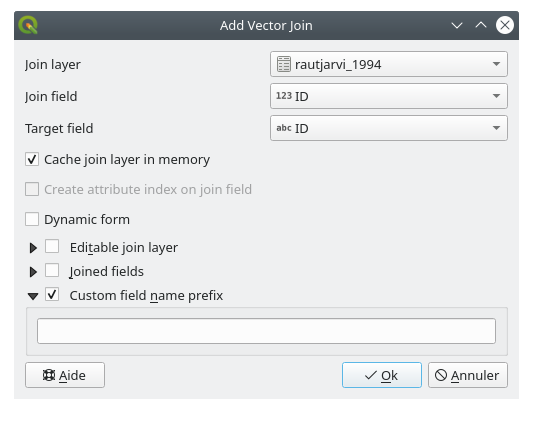
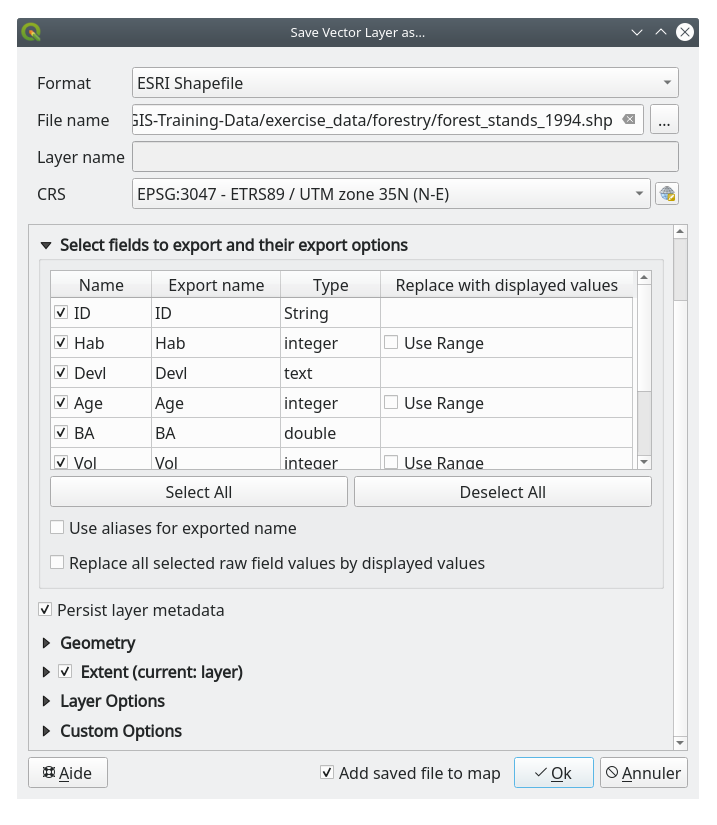
The data from the .csv file is just linked to your vector file. To make
this link permanent, so that the data is actually recorded to the vector file
you need to save the forest_stands layer as a new vector file. To do this:
Right click on
forest_standslayerChoose
Set Format to ESRI Shapefile
Set file name to
forest_stands_1994.shpunder theforestryfolderTo include the new file as a layer in the project, check
Add saved file to map
14.3.7. Try Yourself Adding Area and Perimeter
To finish gathering the information related to these forest stands, you might
calculate the area and the perimeter of the stands. You calculated areas for
polygons in Lesson: Exercițiu Suplimentar. Go back to that
lesson if you need to and calculate the areas for the forest stands. Name the
new attribute Area and make sure that the values calculated are in hectares.
You could also do the same for the perimeter.
Now your forest_stands_1994 layer is ready and packed with all the
available information.
Save your project to keep the current map layers in case you need to come back later to it.
14.3.8. In Conclusion
It has taken a few clicks of the mouse but you now have your old inventory data in digital format and ready for use in QGIS.
14.3.9. What’s Next?
You could start doing different analysis with your brand new dataset, but you might be more interested in performing analysis in a dataset more up to date. The topic of the next lesson will be the creation of forest stands using current aerial photos and the addition of some relevant information to your dataset.