14.6. 课: 使用地图集工具创建详细地图
系统抽样设计已准备就绪,现场团队也已将GPS坐标加载到其导航设备中。他们还有一个现场数据表单,在那里将收集每个取样地测量的信息。为了更容易地找到每个取样地,他们要求提供一些详细地图,其中可以清楚地看到一些地面信息,以及较小取样地子集和一些有关地图区域的信息。您可以使用地图集工具自动生成许多具有共同格式的地图。
本课目标: 学习使用QGIS中的地图集工具生成详细的可打印地图,以协助实地清查工作。
14.6.1.  跟我做: 准备打印布局
在我们可以自动操作林区和取样地块的详细地图之前,需要创建一个地图模板,其中包含我们认为对实地工作有用的所有元素。当然,最重要的是正确的样式,但正如您之前所看到的,还需要添加许多其他元素来完成打印地图。
Open the QGIS project from the previous lesson
forest_inventory.qgs. You should have at least the following layers:forest_stands_2012 (with a 50% transparency, green fill and darker green border lines)
systematic_plots_clip
rautjarvi_aerial
Save the project with a new name,
map_creation.qgs.
要创建可打印地图,请记住要使用 布局管理器:
Open
 Layout Manager....
In the Layout manager dialog:
Under New from template, press the Create... button next to the Empty layout entry
Name your print layout
forest_map.Press OK. A new print layout is created and opened, showing a blank paper.
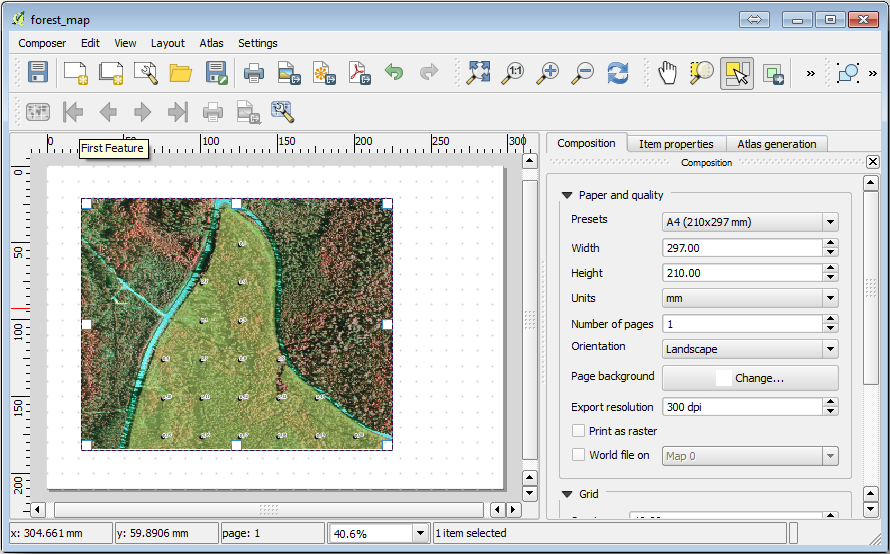
In the print Layout window, ensure properties are set for an A4 paper:
Right-click over the paper and select Page properties. The Page properties panel is open on the right side of the layout.
Check Size is A4.
Check Orientation is Landscape.
Enable the Layout tab next to the Page properties panel and set Export resolution to
300 dpi.
如果使用画布网格来定位不同的元素,则排版地图会更容易。检查布局网格的设置:
In the Layout tab expand the Guides and Grid region.
Check that Grid spacing is set to
10 mmand that Snap tolerance is set to5 px.
您需要激活网格的使用:
打开 菜单。
Check Show grid.
勾选 捕捉到网格 。
Notice that options for using Guides are checked by default, which allows you to see guiding lines when you are moving elements in the layout.
现在可以开始向布局中添加元素了。首先添加地图元素,以便在更改图层符号时查看地图画布的外观:
单击
 添加地图 按钮。
在画布上单击并拖动一个框,使地图占据其中大部分。
请注意鼠标光标是如何捕捉到画布网格的,添加其他元素时也可以使用此功能。如果要获得更高的精度,请更改网格 间距 设置。如果出于某种原因不想在某个点捕捉到网格,可以随时在 菜单中勾选或取消勾选。
14.6.2. 跟我做: 添加背景地图
Leave the layout open but go back to the map. Let's add some background data and create some styling so that the map content is as clear as possible.
添加背景栅格
basic_map.tif,您可以在exercise_data\forestry\文件夹找到此文件。If prompted select the ETRS89 / ETRS-TM35FIN CRS for the raster.
如您所见,背景地图已经设置了样式。这种即用类型制图栅格非常常见。它是从矢量数据创建,以标准格式设置样式并储存为栅格,这样您就不必费心设置多个矢量图层的样式,也不必担心会得到不理想的结果。
现在缩放到取样地,以便您只能看到大约四到五行的地块。
The current styling of the sample plots is not the best:
While during the last exercises, the white buffer was OK on top of the aerial image, now that the background image is mostly white you barely can see the labels. But how does it look in the print layout? Let's check it:
Go to the print layout window.
Use the
 Select/Move item button to select the map element
in the layout.
Select/Move item button to select the map element
in the layout.转到 项属性 标签页。
Click on
 Set map extent to match main canvas extent.
If you need to refresh the element, click on
 Update map preview.
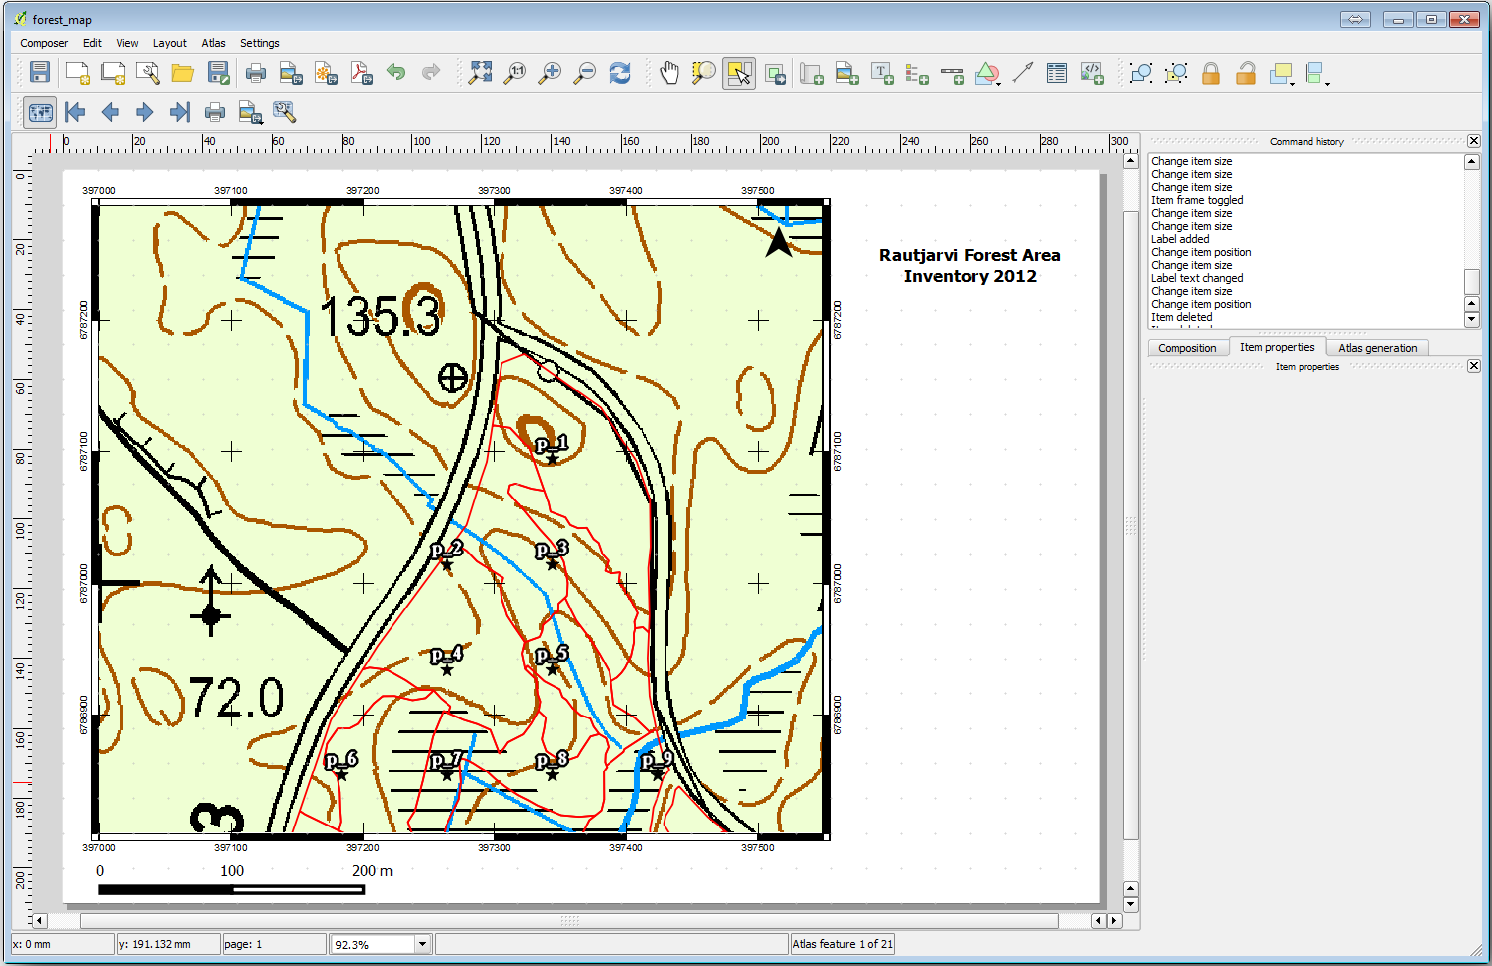
Obviously this is not good enough; you want to make the plot numbers as clearly visible as possible for the field teams.
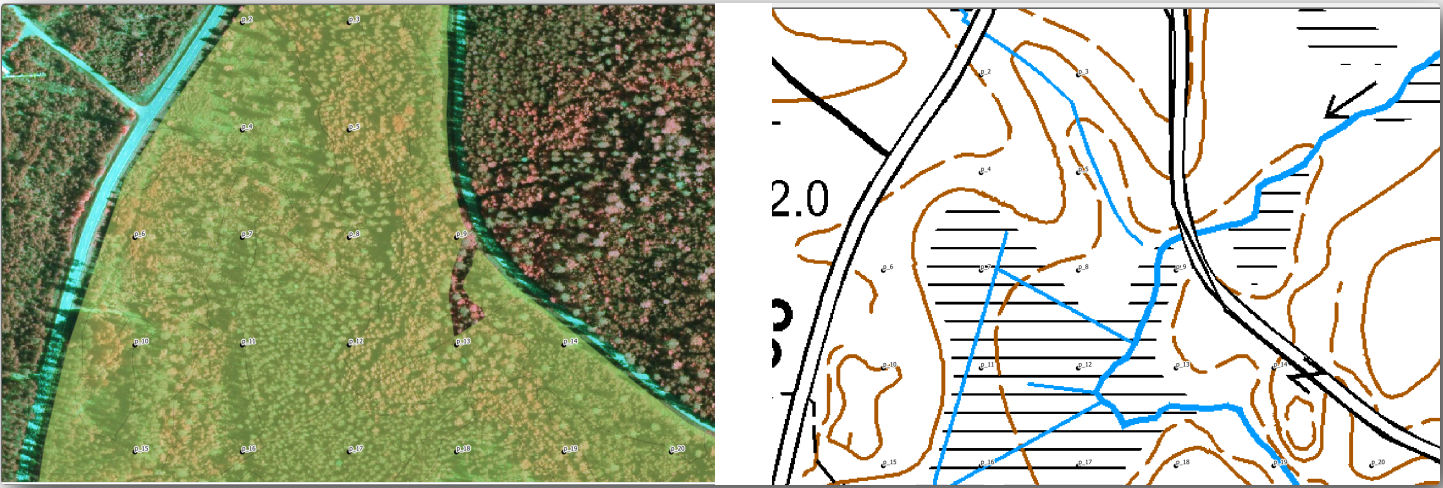
14.6.3. 试一试 更改图层符号
您曾经在 单元: 创建和探索基本地图 使用符号,在 单元: 分类矢量数据 使用过标注。如果需要重新了解某些可用选项和工具,请返回这些单元。您的目标是在始终允许查看背景地图元素的前提下使地块位置及其名称尽可能清晰可见。可以从这张图像中得到一些启发:
You will use later the the green styling of the forest_stands_2012 layer.
In order to keep it, and have a visualization of it that shows only the stand borders:
Right click on forest_stands_2012 and select Duplicate
You get a new layer named
forest_stands_2012 copythat you can use to define a different style, for example with no filling and red borders.现在,您有了两种不同的林分可视化,可以决定哪一个显示详细地图。
Go back to the print layout window often to see what the map would look like. For the purposes of creating detailed maps, you are looking for a symbology that looks good not at the scale of the whole forest area (left image below) but at a closer scale (right image below). Remember to use
Update map preview and
Set map extent to match main canvas extent
whenever you change the zoom in your map or the layout.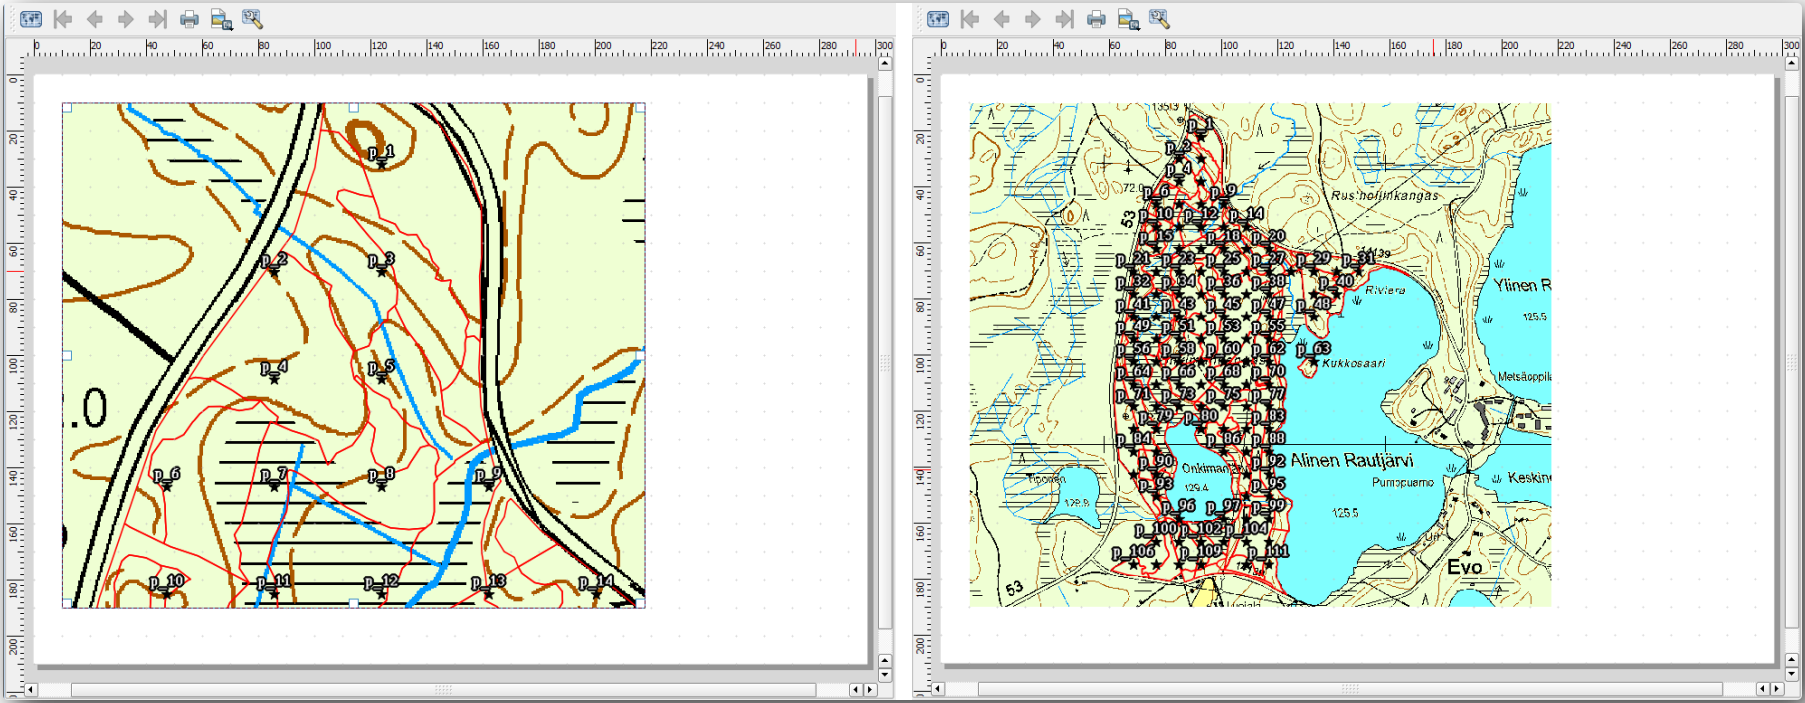
14.6.4. 试一试 创建底图模板
Once you have a symbology you are happy with, you are ready to add some more information to your printed map. Add at least the following elements:
标题。
比例尺。
地图的网格框架。
网格两侧的坐标。
You have created a similar layout already in 单元: 布局地图. Go back to that module as you need. You can look at this example image for reference:
将地图导出为图像并查看效果。
。
Use for example the JPG format.
这就是打印时的样子。
14.6.5. 跟我做: 向打印布局添加更多元素
正如您可能在推荐地图模板图像中注意到的,画布的右侧有很多空间。让我们看看还有什么可以放进去。就我们的地图而言,图例并不是真正需要的,但鹰眼图和一些文本框可以为地图增加实用价值。
鹰眼图将帮助现场团队将详细地图放置在整个森林区域内显示:
将另一个地图元素添加到画布,位于标题文本的正下方。
在 项属性 标签页,打开 鹰眼图 下拉列表。
将 地图框架 (鹰眼图框架) 设置为 Map 0 。这将在较小的地图上创建一个阴影矩形,表示较大地图的可见范围。
Check also the Frame option with a black color and a Thickness of
0.30.
请注意,您的鹰眼图并没有真正给出您想要的林区总览。您希望此地图表示整个林区,并希望仅显示背景地图和 forest_stands_2012 图层,而不显示取样地。此外,还需要锁定其视图,以便在更改图层的可见或顺序时不再更改。
返回地图,但不要关闭 打印布局 窗口。
Right click the forest_stands_2012 layer and click on Zoom to Layer Extent.
Deactivate all layers except for basic_map and forest_stands_2012.
Expand the Manage map themes tool on the Layers panel and select Add theme.
Name it
basic_overview.Go back to the print layout.
With the small map selected, click the Set map extent to match main canvas extent to set its extents to what you can see in the map window.
Lock the view for the overview map by checking Follow map theme and selecting
basic_overviewunder Main properties.
Now your overview map is more what you expected and its view will not change anymore. But, of course, now your detail map is not showing anymore the stand borders nor the sample plots. Let's fix that:
Go to the map window again and select the layers you want to be visible (
systematic_plots_clip,forest_stands_2012 copyandBasic_map).再次缩放,仅显示几行取样地即可。
返回 打印布局 窗口。
Select the bigger map in your layout.
In Item properties click on Update preview and Set map extent to match main canvas extent.
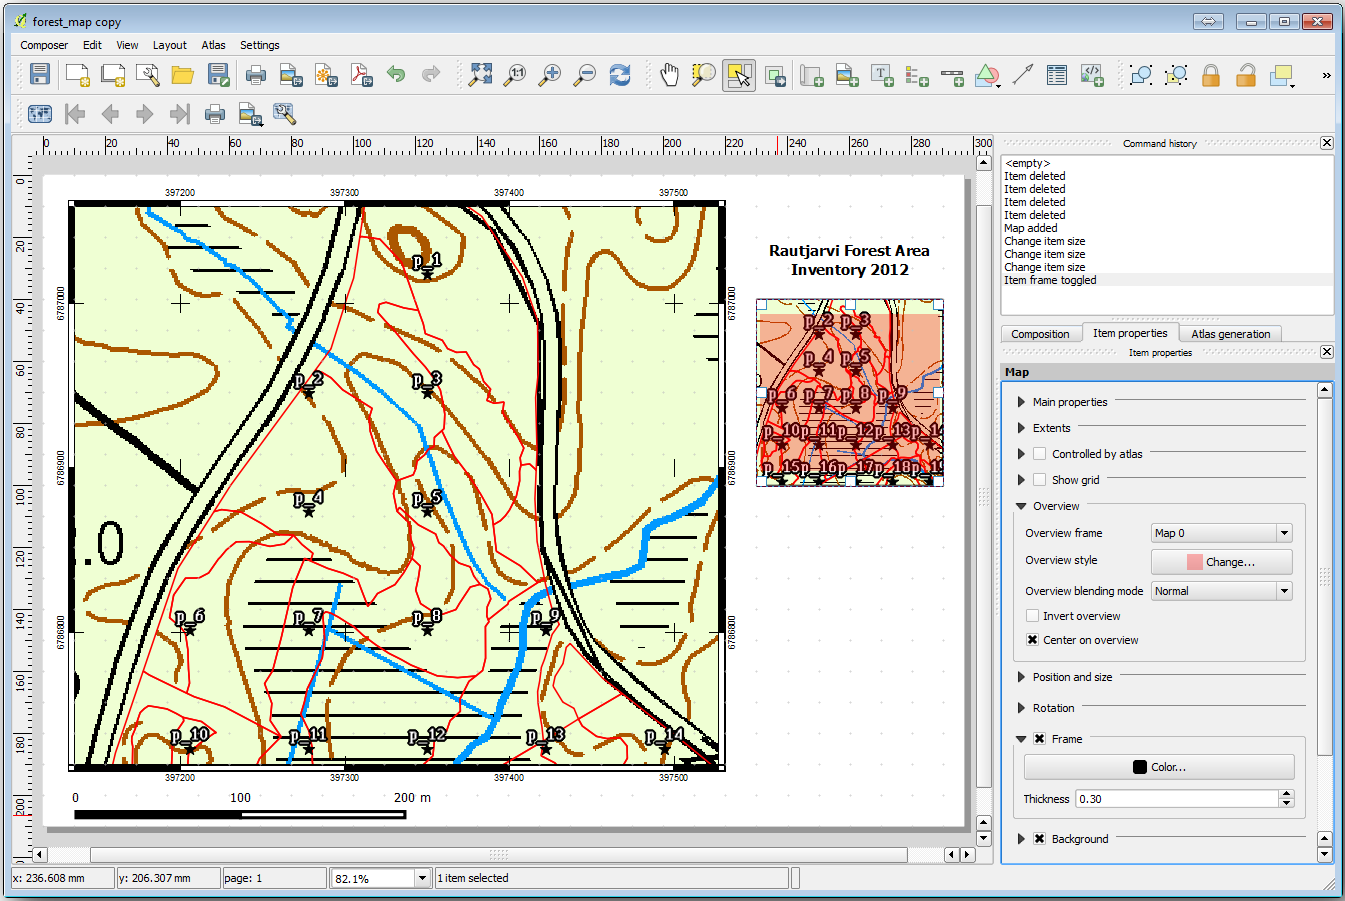
请注意,只有较大的地图显示当前地图视图,而较小的鹰眼图保持与锁定时相同的视图。
还请注意,鹰眼图显示了详细地图所示范围的阴影框架。
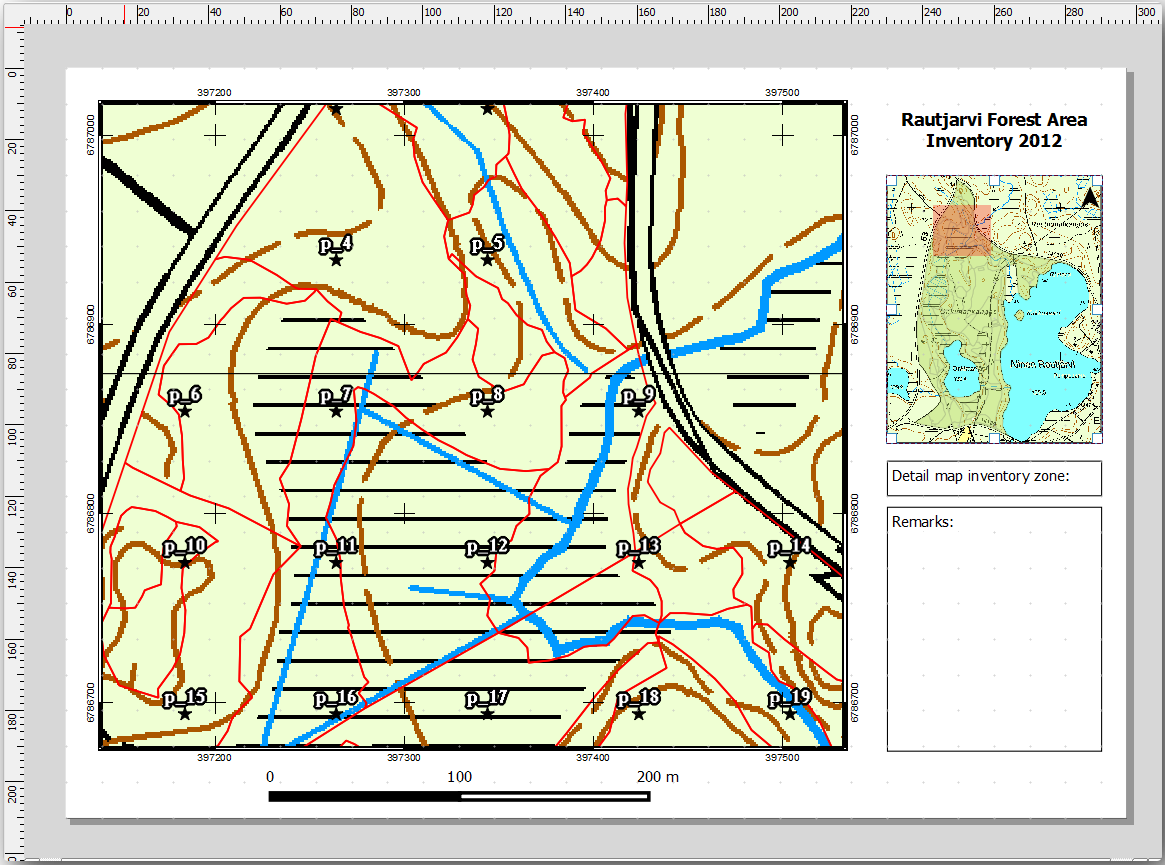
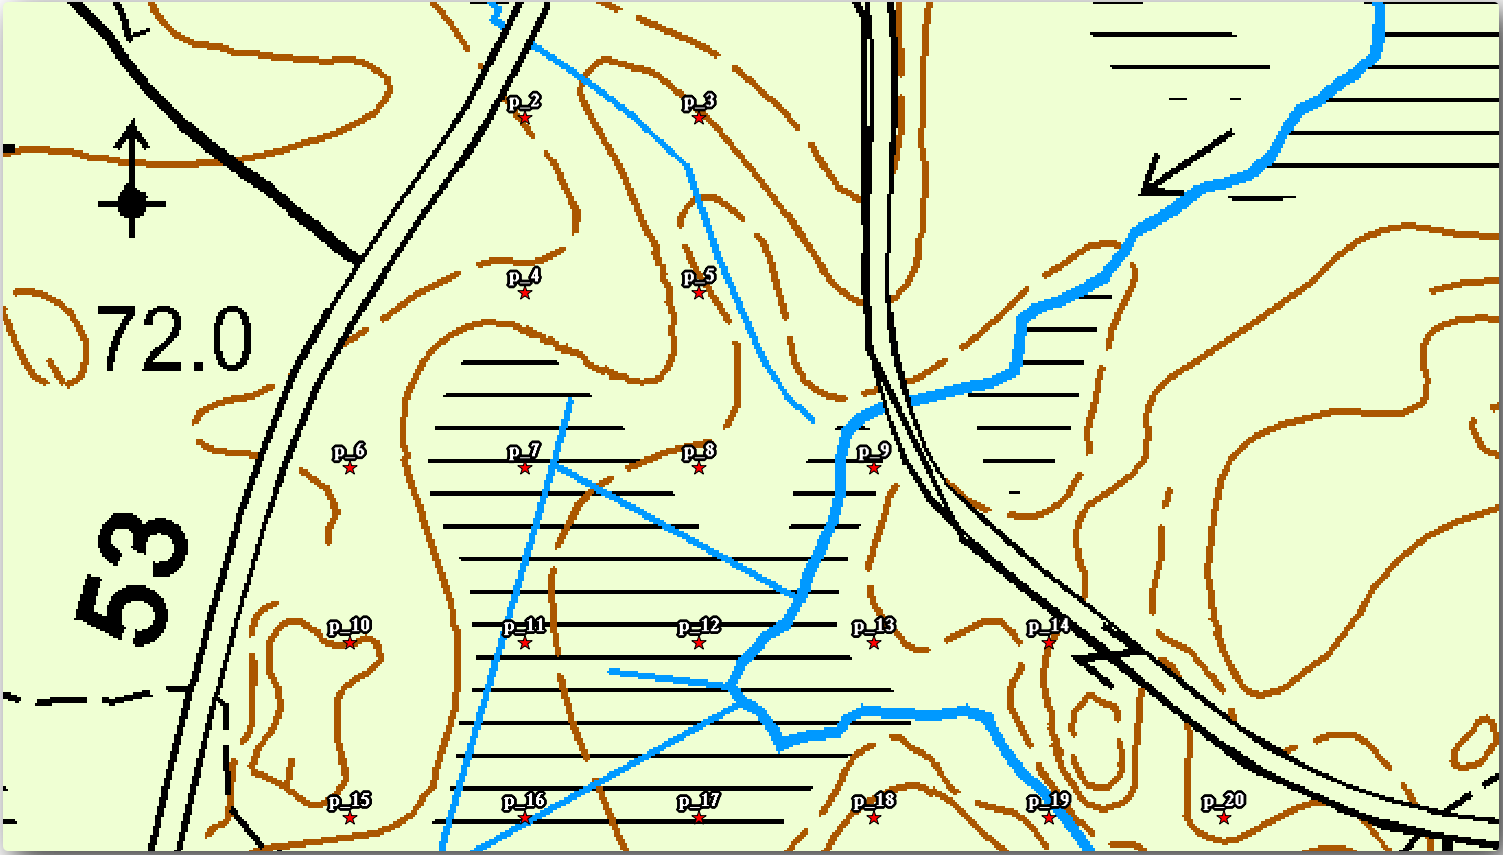
您的模板地图即将就绪。现在在鹰眼图下方添加两个文本框,一个包含文本 'Detailed map zone: ',另一个为 'Remarks: '。如上图所示。
您还可以将指北针添加到鹰眼图 (新版中有专门的指北针工具,可自行尝试):
Select the
 Add North Arrow tool.
Click and drag a rectangle at the upper right corner of the overview map.
In Item properties Check SVG image
Browse for an arrow image.
Under Image rotation, check the Sync with map and select Map 1 (the overview map).
将箭头图像调整为在小地图上看起来不错的尺寸。
基本地图布局已就绪,现在需要使用地图集工具以这种格式生成您认为必要的尽可能多的详细地图。
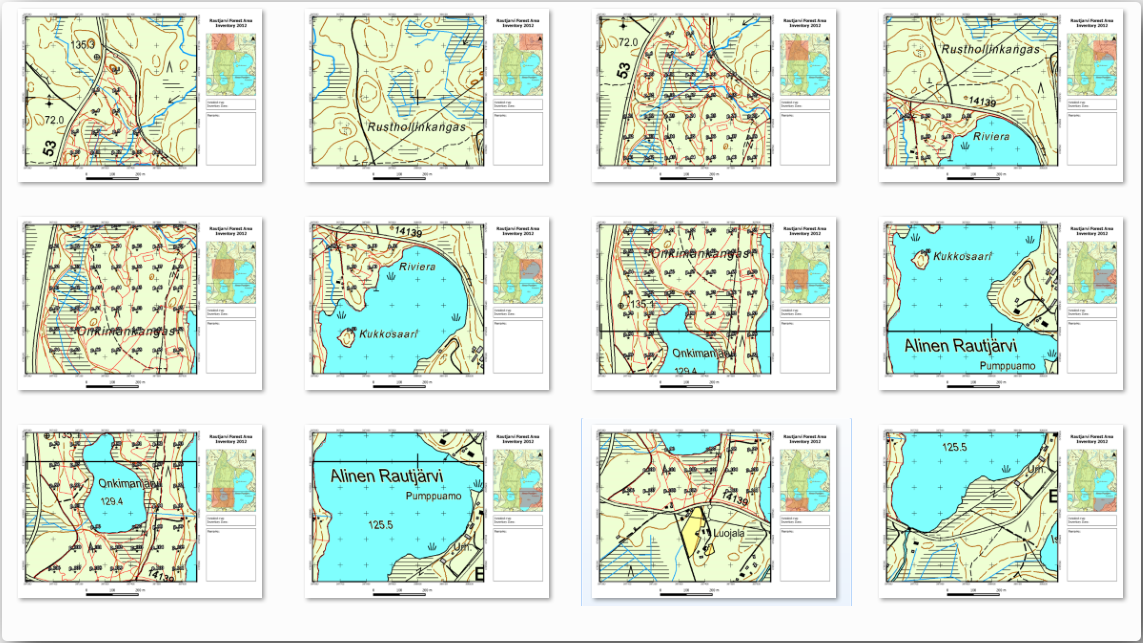
14.6.6. 跟我做: 创建地图集覆盖范围
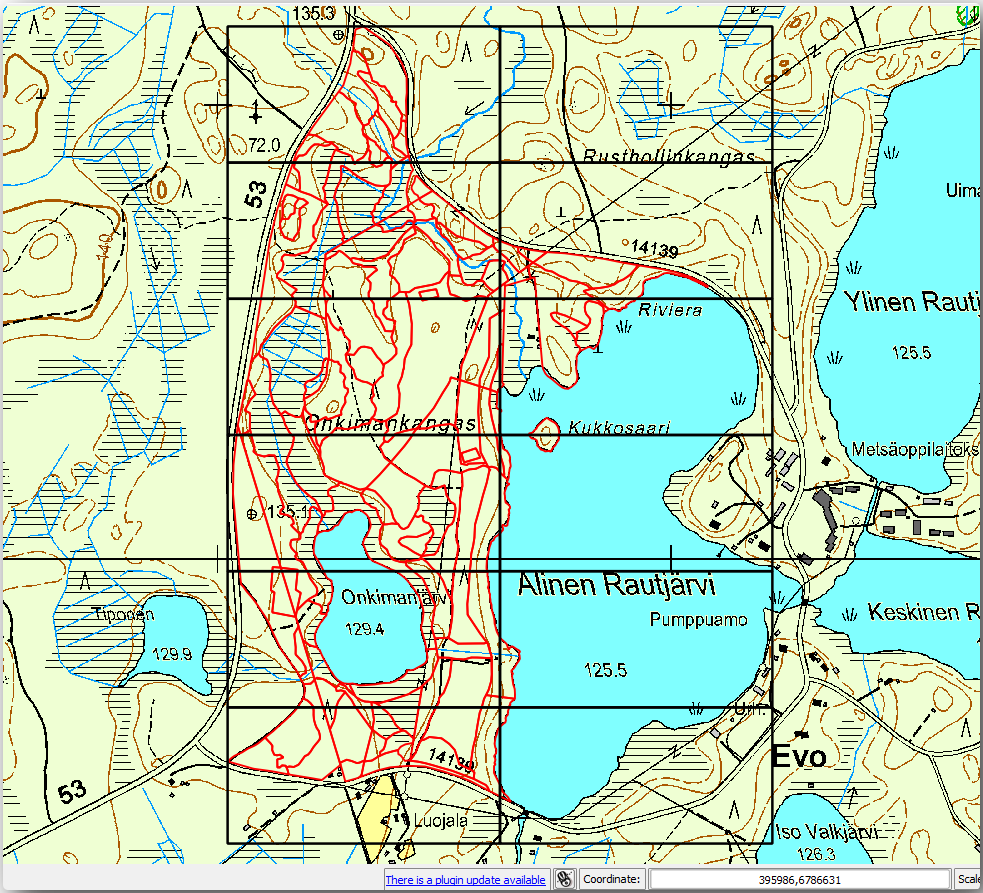
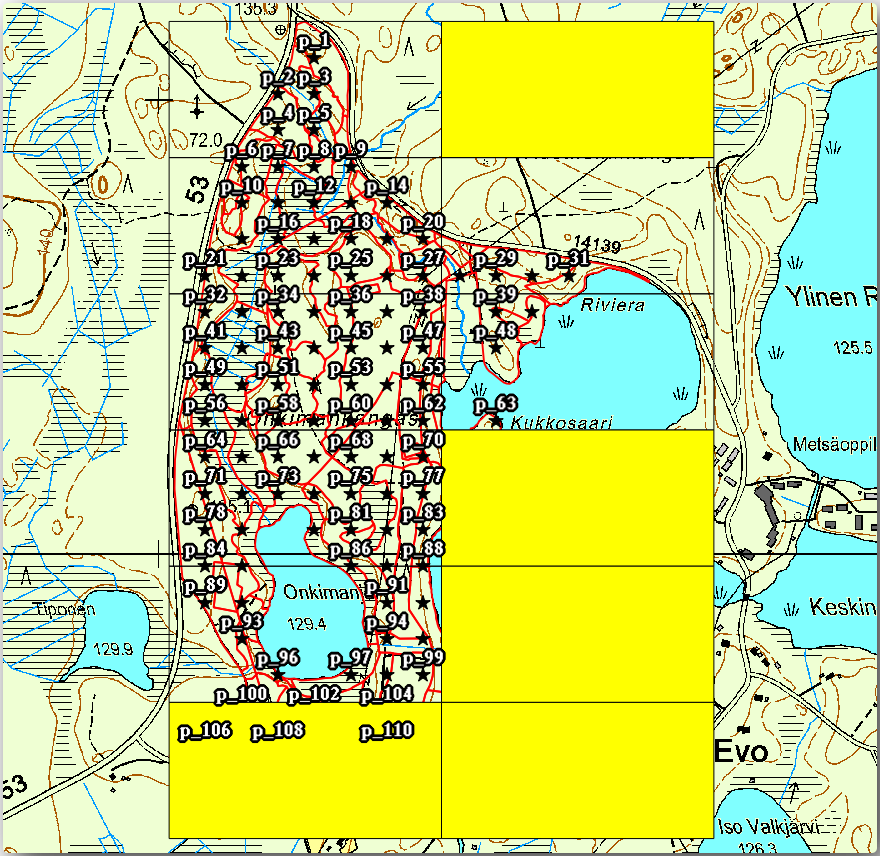
地图集覆盖范围只是一个矢量图层,将用于生成详细地图,覆盖范围内的每个要素对应一幅地图。为了了解接下来的工作,这里有一整套林区的详细地图,供参考:
覆盖范围可以是任何现有图层,但通常为特定目标创建一个范围更有意义。让我们创建一个遮盖林区的多边形网格:
In the QGIS map view, open
 .
.如图所示设置工具:
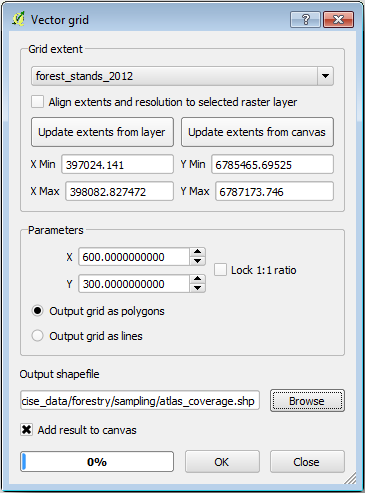
Save the output as
atlas_coverage.shp.Style the new
atlas_coveragelayer so that the polygons have no filling.
新多边形覆盖了整个林区,让您了解每幅地图 (从每个多边形创建) 将包含哪些内容。
14.6.7. 跟我做: 设置地图集工具
最后一步是设置地图集工具:
Go back to the print layout.
在右侧面板,转到 生成地图集 (地图集) 标签页。
设置选项如下所示:
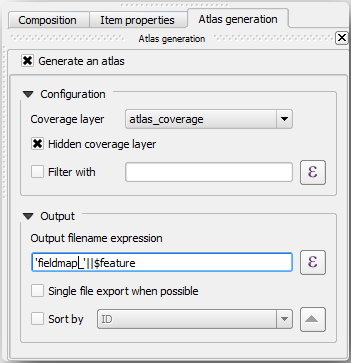
这告诉地图集工具使用
atlas_coverage内的要素 (多边形) 作为每幅详细地图的焦点。它将为图层中的每个要素输出一幅地图。 隐藏范围图层 告诉地图集不要在输出地图中显示多边形。
还有一件事需要做,您需要告诉地图集工具每幅输出地图将更新哪些地图元素。到目前为止,您可能已经猜测,要为每个要素更改的地图是您准备好的包含取样地详细视图的地图,即画布中较大的地图元素:
Select the bigger map element (
Map 0).转到 项属性 标签页。
在列表中,勾选 受控于地图集 。
And set the Marging around feature to
10%. The view extent will be 10% bigger than the polygons, which means that your detail maps will have a 10% overlap.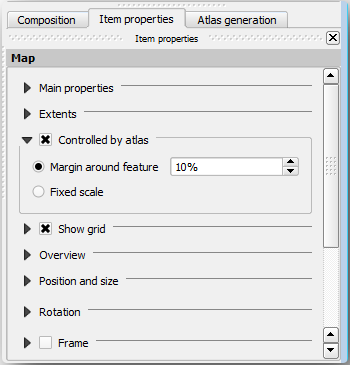
现在,您可以使用地图集的预览工具查看地图的外观:
使用按钮
 激活地图集预览,如果您的地图集工具栏不可见,请使用 。
可以使用地图集工具栏或 菜单中的箭头浏览每个要素创建的地图。
Note that some of them cover areas that are not interesting. Let's do something about it and save some trees by not printing those useless maps.
14.6.8. 跟我做: 编辑范围图层
除了移除那些不感兴趣区域的多边形外,还可以自定义地图中的文本标注,以生成范围图层 属性表 中的内容:
返回地图视图。
Enable editing for the atlas_coverage layer.
选择下图中选中的多边形 (黄色)。
移除选中的多边形。
关闭并保存编辑。
You can go back to the print layout and check that the previews of the Atlas use only the polygons you left in the layer.
您正在使用的范围图层还没有可用于自定义地图中标注内容的有用信息。第一步是进行创建,例如您可以添加多边形区域的区号和带有一些备注的字段,供现场团队参考:
Open the Attribute table for the atlas_coverage layer.
启用编辑。
使用
 字段计算器创建并填充以下两个字段。
Create a field named
Zoneof type Whole number (integer).In the Expression box write/copy/construct
$rownum.Create another field named
Remarks, of type Text (string) and a width of255.In the Expression box write
'No remarks.'. This will set all the default value for all the polygons.
The forest manager will have some information about the area that might be useful when visiting the area. For example, the existence of a bridge, a swamp or the location of a protected species. The atlas_coverage layer is probably in edit mode still, add the following text in the Remarks field to the corresponding polygons (double click the cell to edit it):
For the Zone 2:
Bridge to the North of plot 19. Siberian squirrel
between p_13 and p_14.
For the Zone 6: Difficult to transit in swamp to the North of the lake.`
For the Zone 7:
Siberian squirrel to the South East of p_94.关闭并保存编辑。
Almost ready, now you have to tell the Atlas tool that you want some of the text labels to use the information from the atlas_coverage layer's attribute table.
返回 打印布局 窗口。
Select the text label containing
Detailed map....Set the Font size to
12.将光标设置在标注文本的末端。
在 项属性 标签页的 主要属性 内,单击 插入/编辑表达式... 。
In the Function list double-click on the field Zone under Field and Values.
单击 确定 。
The text inside the box in the Item properties should show
Detail map inventory zone: [% "Zone" %]. Note that the[% "Zone" %]will be substituted by the value of the field Zone for the corresponding feature from the layer atlas_coverage.通过查看不同地图集预览图来测试标注的内容。
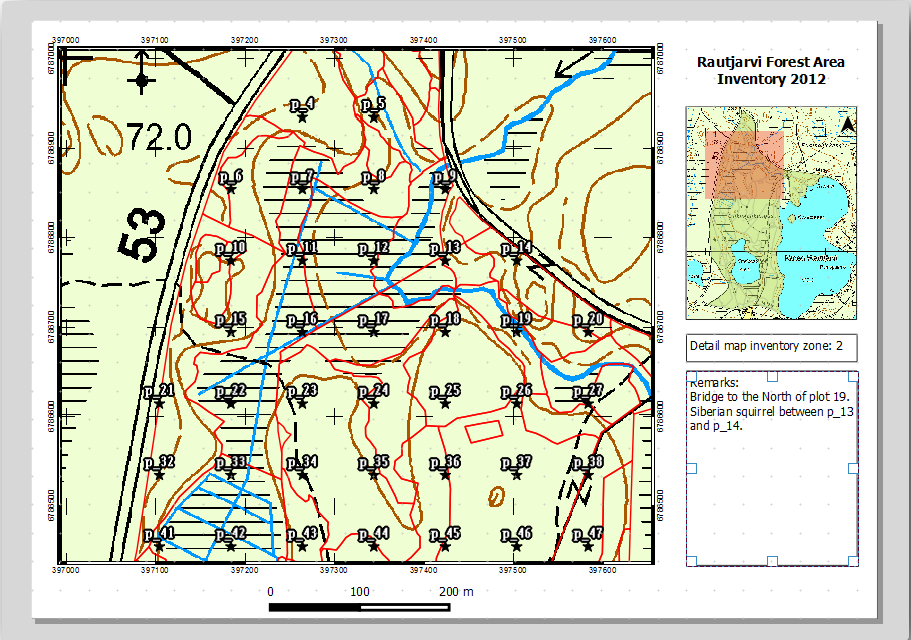
Do the same for the labels with the text Remarks: using the field with the zone information. You can leave a break line before you enter the expression. You can see the result for the preview of zone 2 in the image below:
使用地图集预览浏览您即将创建的所有地图,并尽情享受吧!
14.6.9. 跟我做: 打印地图
最后,将地图打印或导出为图像文件或PDF文件。你可以使用 或 。目前SVG导出格式仍不理想,结果不佳,请注意查看提示信息。
将地图导出为单个PDF文件,您可以将其发送到现场办公室进行打印:
转到右侧面板的 生成地图集 (地图集) 标签页。
在 输出 中,勾选 可能时导出为单个文件 。这将把所有地图放在一个PDF文件中,如果未勾选此选项,则每幅地图导出一个文件。
打开 。
Save the PDF file as
inventory_2012_maps.pdfin yourexercise_data\forestry\samplig\map_creation\folder.打开PDF文件,检查一切是否按预期进行。
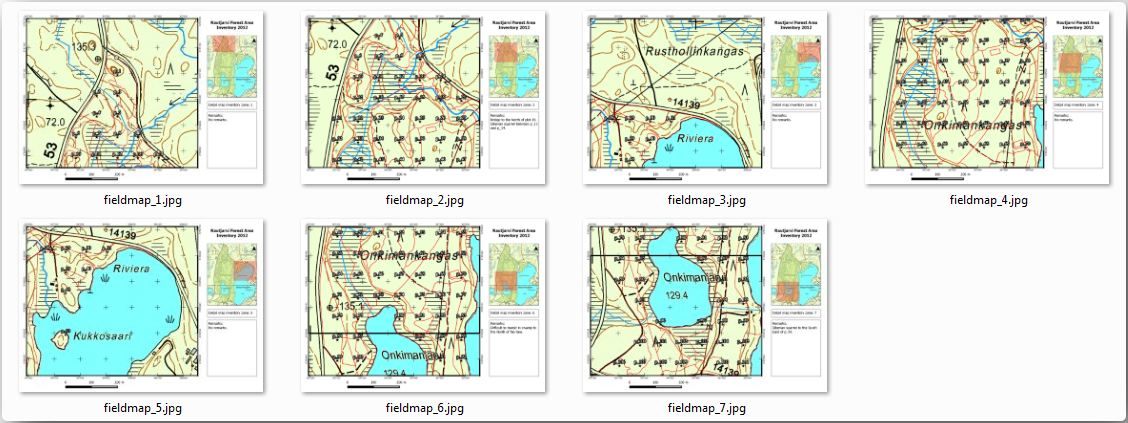
可以同样轻松地为每幅地图创建单独的图像 (记住取消勾选单个文件创建),在此您可以看到将创建图像的缩略图:
In the Print Layout, press
 Save in order
to save your print layout changes in the project. This also saves the project file.
You can reopen the project at any time and run or edit the atlas.
Save in order
to save your print layout changes in the project. This also saves the project file.
You can reopen the project at any time and run or edit the atlas.It is also possible to save your map as a layout template as
forestry_atlas.qptin yourexercise_data\forestry\map_creation\folder. Use . You will be able to use this template again and again in other projects.Close the Print Layout and the project.
14.6.10. In Conclusion
您已经成功创建了一个模板地图,可用于自动生成要在现场中使用的详图地图,以帮助导航到不同的地块。正如您所注意到的,这不是一项简单的任务,但当您需要为其他地区创建类似的地图时,可以使用刚刚保存的模板,这将节省许多时间。
14.6.11. What's Next?
In the next lesson, you will see how you can use LiDAR data to create a DEM and then use it to enhance your data and maps visibility.