17.16. 水文解析
注釈
このレッスンでは、ちょっとした水文解析を実行します。この分析は解析ワークフローの非常に良い例を構成しているので、後のいくつかのレッスンの一部に使用されます。そして、いくつかの高度な機能を発揮するためにそれを使用します。
目的:DEMから始めて、チャネルネットワークを抽出し、流域を描写し、いくつかの統計を計算します。
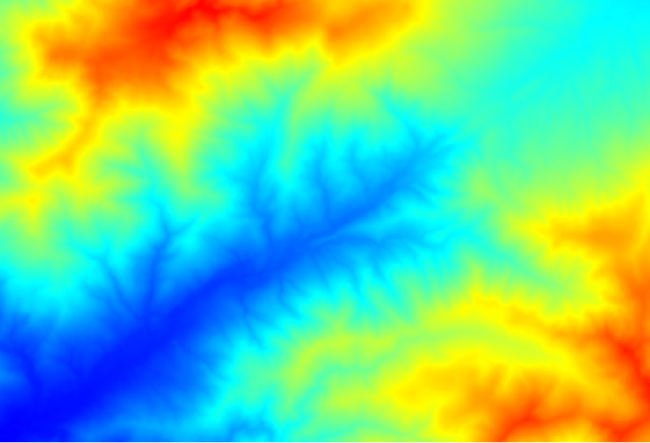
最初は、レッスンデータ、DEM だけが含まれている、を持つプロジェクトをロードすることです。
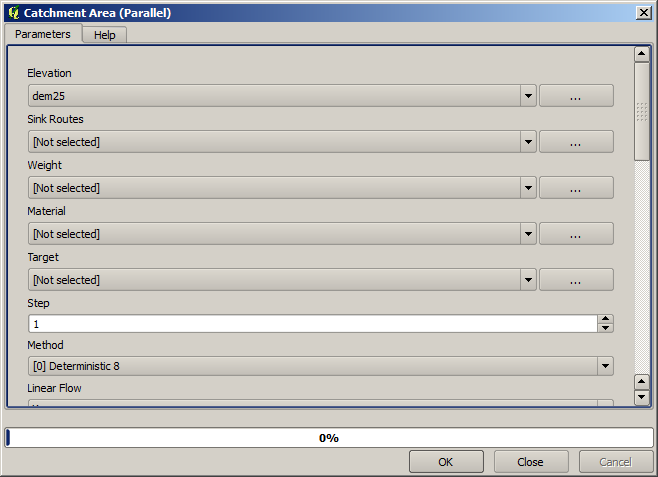
最初に実行するモジュールは 集水域 です(一部のSAGAバージョンでは、 流れの蓄積(トップダウン) と呼ばれます)。 集水域 という名前の他の任意のものを使用できます。それらは下に異なるアルゴリズムを持っていますが、結果は基本的に同じです。
Select the DEM in the Elevation field, and leave the default values for the rest of the parameters.
一部のアルゴリズムは多くのレイヤーを計算しますが、使用するのは 集水域 レイヤーだけです。必要に応じて、他のものを取り除くことができます。
レイヤーのレンダリングは非常に有益ではありません。
理由を知るために、ヒストグラムを見ると、値が均等に分散されていないことがわかります(非常に高い値のセルがいくつかあります。水路ネットワークに対応するものです)。 ラスター計算機 アルゴリズムを使用して、集水域の値の領域の対数を計算すると、より多くの情報を含むレイヤーが得られます。
The catchment area (also known as flow accumulation) can be used to set a threshold for channel initiation. This can be done using the Channel network algorithm.
Initiation grid: use the catchment area layer and not the logarithm one.
Initiation threshold:
10.000.000Initiation type: Greater than
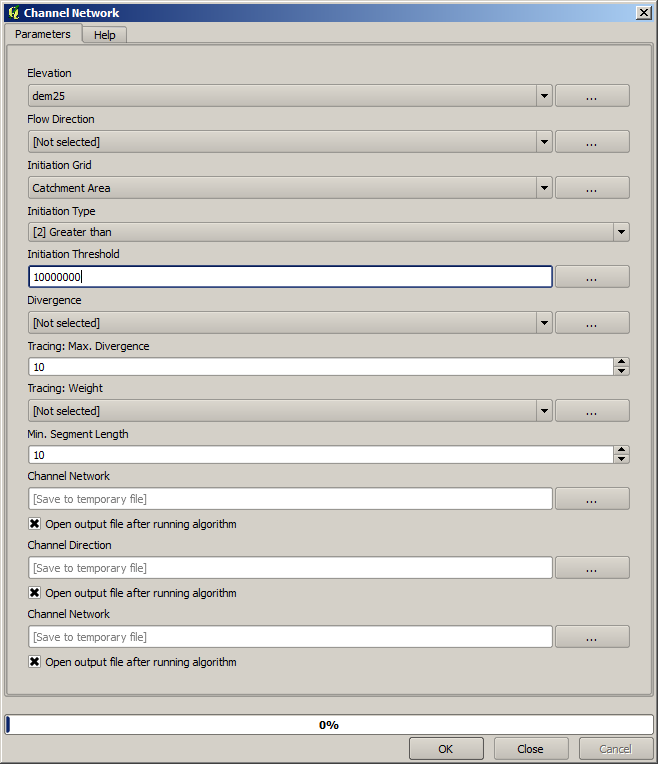
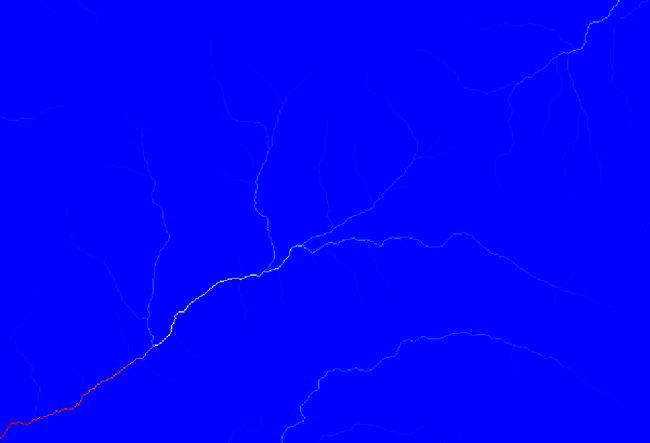
If you increase the Initiation threshold value, you will get a more sparse channel network. If you decrease it, you will get a denser one. With the proposed value, this is what you get.

The image above shows just the resulting vector layer and the DEM, but there should be also a raster layer with the same channel network. That raster will be, in fact, the layer we will be using.
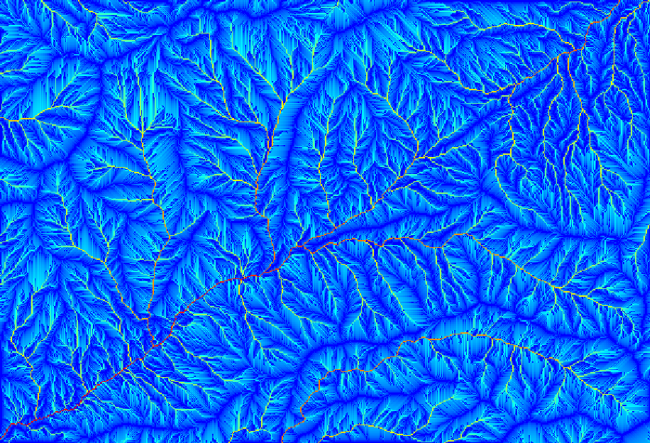
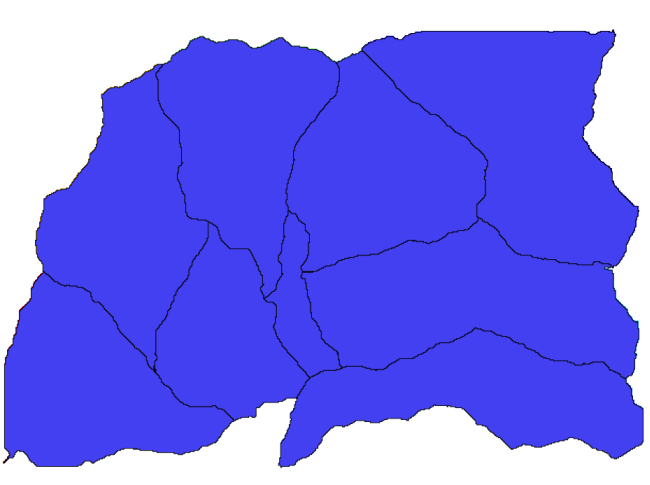
Now, we will use the Watersheds basins algorithm to delineate the subbasins corresponding to that channel network, using as outlet points all the junctions in it. Here is how you have to set the corresponding parameters dialog.
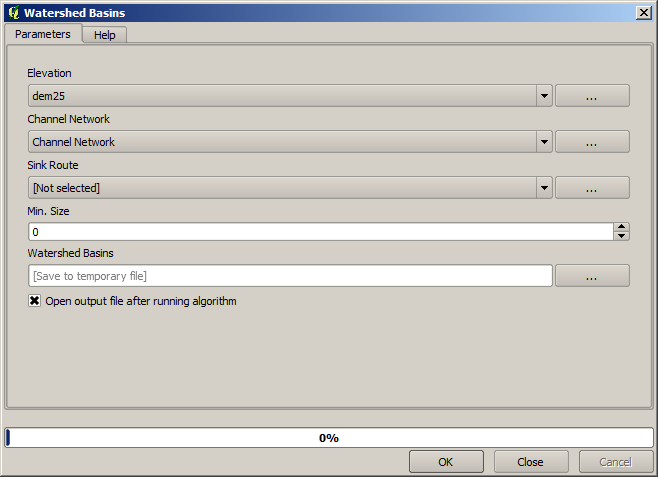
そして、得られるものはこれです。
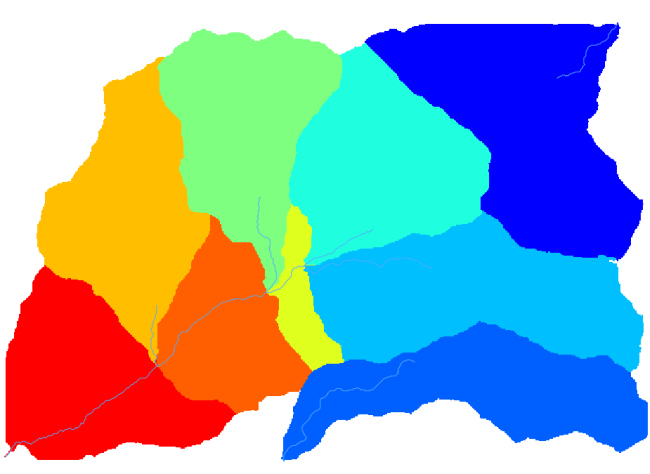
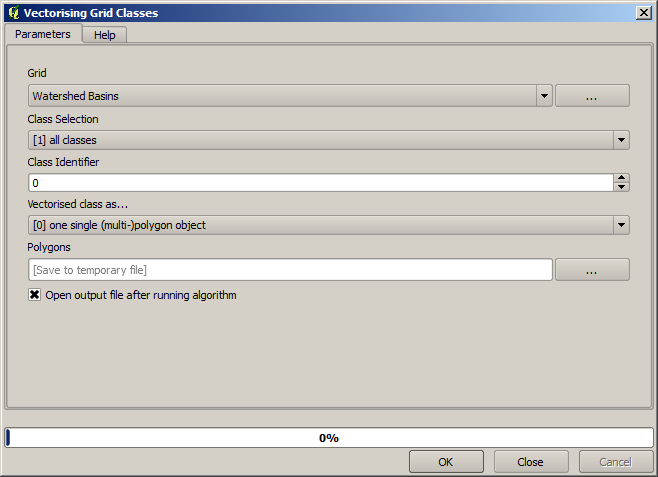
This is a raster result. You can vectorise it using the Vectorising grid classes algorithm.
さて、下位流域の一つで標高値についての統計を計算してみましょう。考え方は、ちょうどその下位流域内だけの標高を表しているレイヤーを得て、それをそれらの統計を計算するモジュールに渡すことです。
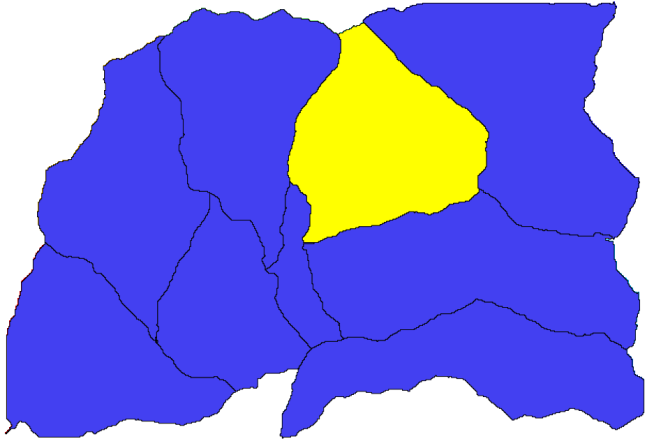
まず、下位流域を表すポリゴンを使用して元のDEMをクリップします。 ポリゴンでラスターをクリップ アルゴリズムを使用します。単一の下位流域ポリゴンを選択してからクリッピングアルゴリズムを呼び出すと、アルゴリズムが選択を認識しているため、DEMをそのポリゴンでカバーされる領域にクリップできます。
Select a polygon
Call the clipping algorithm with the following parameters:
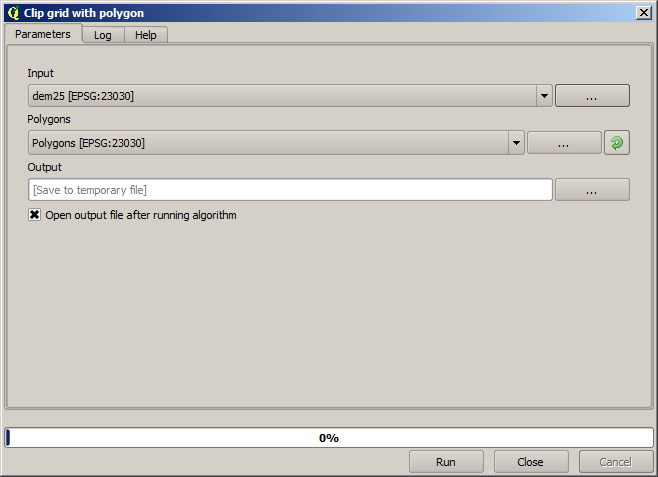
The element selected in the input field is, of course, the DEM we want to clip.
このようなものが得られます。
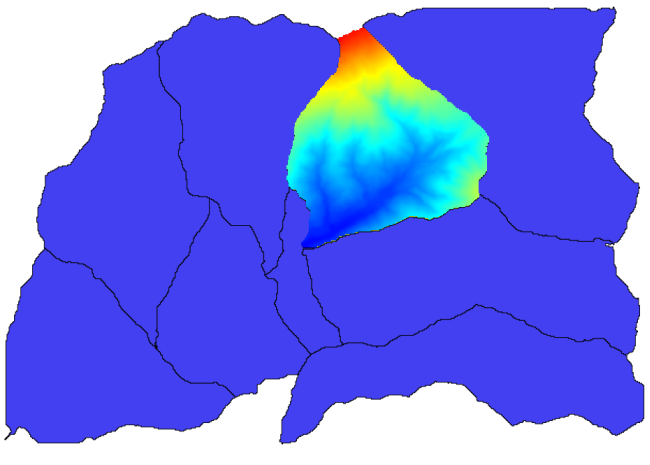
This layer is ready to be used in the Raster layer statistics algorithm.
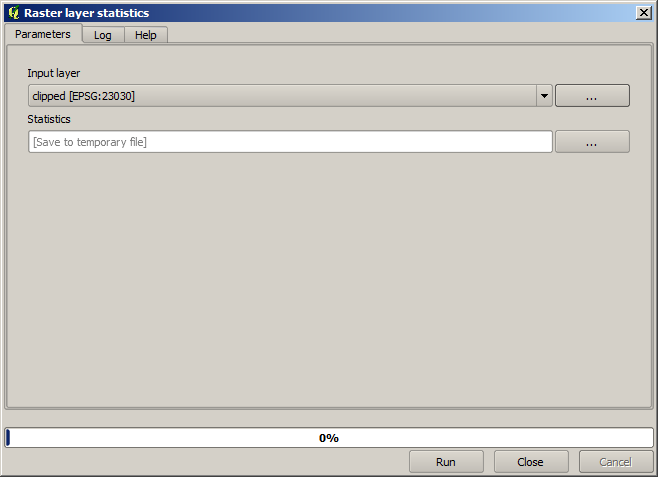
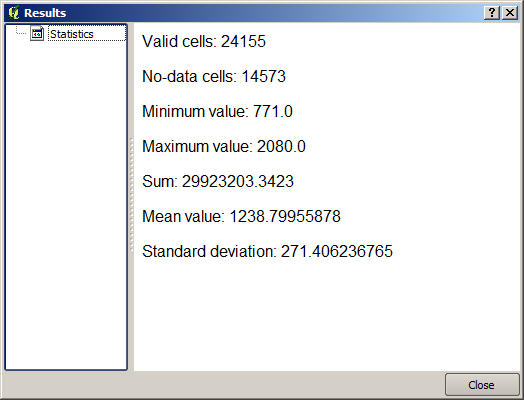
結果の統計は以下のものです。
他のレッスンでは流域の計算手順および統計計算の両方を使用するでしょう。そして他の要素がそれらの両方を自動化しより効率的に作業するのにどのように役立ちうるかを見ます。