Wichtig
Übersetzen ist eine Gemeinschaftsleistung Sie können mitmachen. Diese Seite ist aktuell zu 94.53% übersetzt.
5. QGIS anpassen
Sie können QGIS auf vielfache Art und Weise an Ihre Bedürfnisse anpassen. Im Menü finden Sie verschiedene Werkzeuge hierfür:
 Stilverwaltung…: erstellen und verwalten von Symbolen, Farbverläufen, etc.
 Benutzerprojektionen…: definieren Sie Ihre eigenen Koordinatenbezugssystem.
 Tastenkürzel…: legen Sie ihre eigenen <shortcuts> fest. Sie können auch während jeder QGIS-Sitzung durch die Projekteigenschaften überschrieben werden (zu finden im Menü ).
 Oberflächenanpassung…: passen Sie die Oberfäche an, indem Sie Dialoge oder Werkzeuge verstecken, die Sie für Ihre Arbeit nicht benötigen.
 Optionen…: hier können Sie verschiedene <gui_options> festlegen, die in unterschiedliche Bereiche gegliedert sind. Diese werden in den Einstellungen des aktuellen Benutzerprofils gespeichert und sind immer dann wirksam, wenn Sie mit diesem Profil arbeiten.
5.1. Optionen
Einige grundlegende Einstellungen für QGIS können Sie mit dem Dialog Optionen vornehmen. Wählen Sie im Menü aus. Hier können Sie die Einstellungen an Ihre Bedürfnisse anpassen. Einige Änderungen können einen Neustart von QGIS erfordern, um wirksam zu werden.
Im Nachfolgenden werden die einzelnen Reiter beschrieben, in denen Sie die Optionen ihren Bedürfnissen anpassen können.
Bemerkung
Erweiterungen können durch ihre eigenen Einstellungsmöglichkeiten die unten beschriebenen Optionen ergänzen
Bitte beachten Sie, dass im Folgenden nur die Optionen, die in der Kernanwendung vorhanden sind, beschrieben werden. Durch die Installation von Erweiterungen, ist es möglich, dass die Standard-Optionen durch Einträge dieser Erweiterung ergänzt werden. Damit wird verhindert, dass jede Erweiterung einen eigenen Konfigurationsdialog mit eigenen Menüeinträgen mitbringt.
5.1.1. Allgemein
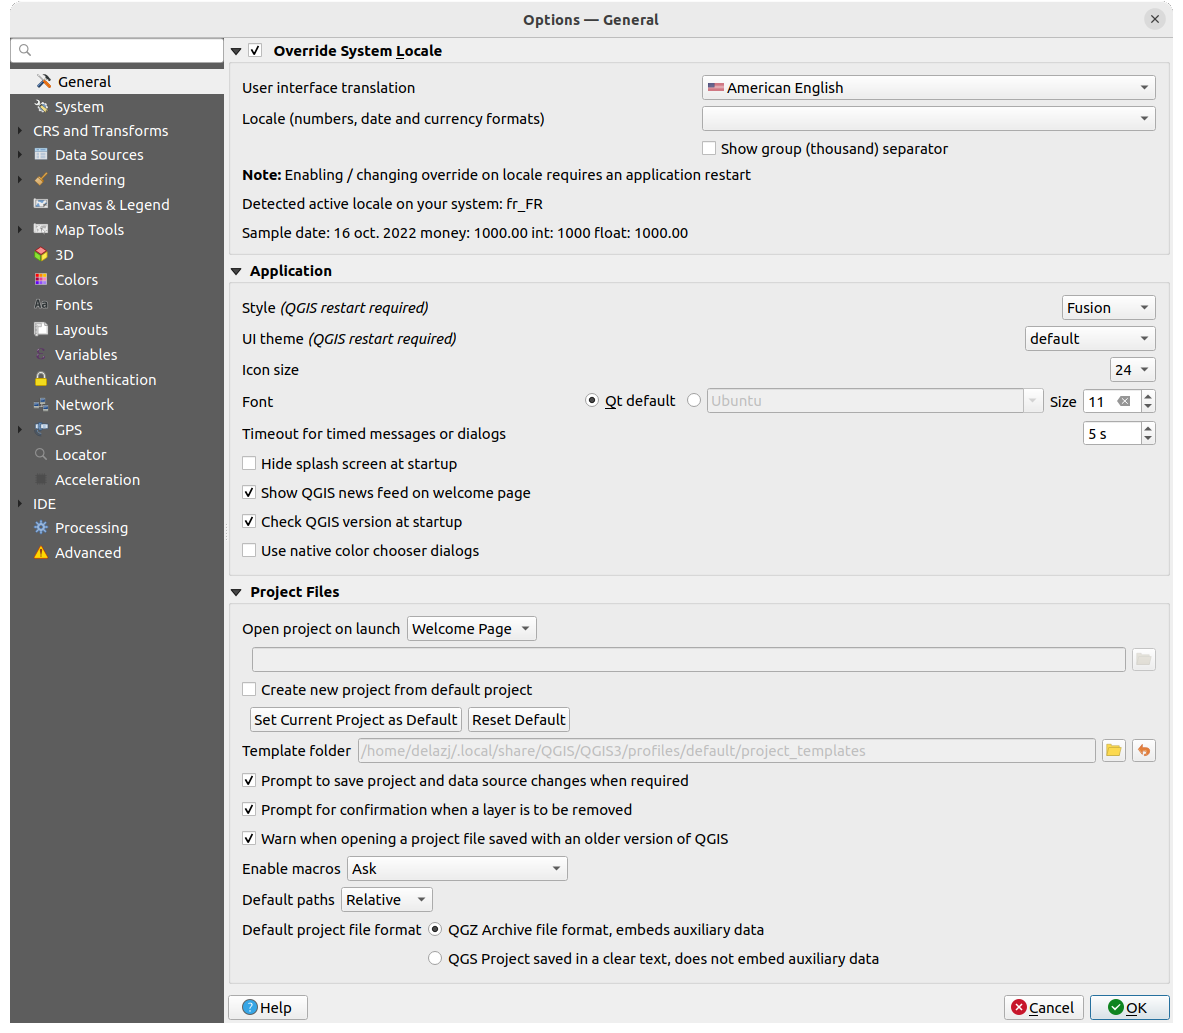
Abb. 5.1 Allgemein
System-Locale übersteuern
Standardmäßig verwendet QGIS die Konfiguration Ihres Betriebssystems für die Sprach- und Zahleinstellungen. Wenn Sie diese Gruppe aktivieren, können Sie dieses Verhalten anpassen:
Wählen Sie in Benutzeroberflächenübersetzung die Sprache aus, die für die Benutzeroberfläche verwendet werden soll
Wählen Sie in Locale (Zahlen-, Daten- Währungsformate) das System, in dem Datum und numerische Werte eingegeben und dargestellt werden sollen
 Gruppen-/Tausendertrennung anzeigen
Am unteren Rand des Bereichs wird eine Zusammenfassung der ausgewählten Einstellungen und deren Interpretation angezeigt.
Anwendung
Wählen Sie den Stil (QGIS-Neustart erforderlich), d.h. das Aussehen und die Anordnung der Elemente in Dialogen. Die Auswahlmöglichkeiten hängen von Ihrem Betriebssystem ab.
Legen Sie das Oberflächenthema (QGIS-Neustart erforderlich) fest
 . Mögliche Werte sind ‚default‘, ‚Night Mapping‘, und ‚Blend of Gray‘.
Legen Sie die Icon-Größe fest
Legen Sie die Schriftart und ihre Größe fest. Die Auswahl kann
 Qt Vorgabe oder eine benutzerdefinierte Schrift sein.
Ändern Sie die Dauer von zeitweiligen Meldungen und Dialogen
 Splashscreen beim Start nicht anzeigen
- QGIS-Neuigkeiten auf Willkommensseite anzeigen: zeigt einen QGIS-Newsfeed auf der Startseite an, der Sie über Projektneuigkeiten informiert (Datum und Zusammenfassung von Benutzer-/Entwicklertreffen, Community-Umfragen, Ankündigungen von Releases, verschiedene Tipps…)
mit
QGIS-Version beim Start überprüfen werden Sie informiert, wenn eine neue QGIS-Version veröffentlicht wurde- Native Farbauswahldialoge verwenden (siehe Farbauswahl)
Projektdateien
Projekt beim Start öffnen bietet die folgenden Möglichkeiten:
‚Willkommensseite‘ (Standardeinstellung): kann den „Newsfeed“ anzeigen, die Projektvorlagen und die zuletzt verwendeten Projekte des aktuellen Benutzerprofils (mit Vorschau); standardmäßig wird kein Projekt geöffnet
‚Neu‘: öffnet ein neues Projekt, das auf der Standardvorlage basiert
‚Zuletzt verwendetes‘: öffnet das zuletzt verwendete Projekt
‚Bestimmtes‘: öffnet ein festgelegtes Projekt; benutzen sie die … Schaltfläche, um das Projekt festzulegen
Unter
Neues Projekt aus Vorgabeprojekt erstellen können Sie das Aktuelle Projekt als Vorgabe speichern oder die Vorgabe zurücksetzen. In der Zeile darunter können Sie ein Verzeichnis festlegen, in dem Sie ihre benutzerdefinierten Projektvorlagen speichern. Diese werden dann dem Menü hinzugefügt.Wählen Sie
Bei Bedarf nachfragen, ob geänderte Projekte und Datenquellen gespeichert werden sollen, um zu verhindern, dass Ihre Änderungen verloren gehen.- Beim Löschen von Layern Bestätigung anfordern
- Warnung ausgeben, wenn QGIS-Projekt einer früheren Version geöffnet wird: Sie können Projekte, die mit einer älteren QGIS-Version gespeichert wurden, jederzeit öffnen; das Öffnen einer neueren Projektdatei mit einer älteren Version kann aber scheitern, weil neuere Entwicklungen in dieser Version noch nicht verfügbar sind.
In Projekt eingebetteten Python-Code aktivieren
. Diese Option regelt die Ausführung von Makros, die geschrieben wurden, um eine Aktion bei Projekt-Ereignissen auszuführen, sowie von benutzerdefinierten Python-Funktionen, die als Ausdrücke verwendet werden sollen. Sie können zwischen „Nie“, „Fragen“, „Nur in diese Sitzung“ und „Immer (nicht empfohlen)“ wählen.Vorgabepfade: legt fest, ob Pfade zu Dateien und Layern, die in neuen Projekten verwendet werden, als ‚Absolut‘ oder ‚Relativ‘ zur Projektdatei gespeichert werden. Diese Einstellung kann auf Projektebene überschrieben werden.
Vorgabeprojektdateiformat
- QGZ-Archivdateiformat, enthält Zusatzdaten (siehe Hilfsspeicher)
 QGS-Projekt in Klartext speichern, unterstützt keine Zusatzdaten: die Zusatzdaten werden in einer separaten
 .qgd-Datei zusammen mit der Projektdatei gespeichert
5.1.2. System
SVG-Pfade
Es können Suchpfad(e) für SVG-Symbole (Scalable Vevtor Graphic) hinzugefügt oder entfernt werden. Alle SVG-Dateien, die sich in diesen Verzeichnissen befinden, stehen dann zur Verfügung, um die Objekte ihrer Karte zu symbolisieren, zu beschriften oder um Dekorationen hinzuzufügen (z.B. in der Layer-Symbolisierung oder der Stilverwaltung).
Lesen Sie auch das Kapitel Entfernte oder eingebettete Dateiauswahl für verschiedene Möglichkeiten, auf SVG-Dateien in einem QGIS-Pfad zu verweisen.
Erweiterungspfade
Fügen Sie Nach zusätzlichen C++-Erweiterungsbibliotheken zu durchsuchende Pfad(e) hinzu oder entfernen Sie diese.
Dokumentationspfade
Hinzufügen oder Entfernen von Dokumentationspfad(e) für die QGIS-Hilfe. Standardmäßig wird ein Link zum offiziellen Online-Benutzerhandbuch hinzugefügt, das der verwendeten Version entspricht (d. h. https://docs.qgis.org/§qgis_short_version/$qgis_locale/docs/user_manual/). Sie können jedoch weitere Links hinzufügen und diese von oben nach unten priorisieren: Jedes Mal, wenn Sie in einem Dialogfeld auf die Schaltfläche Hilfe klicken, wird der oberste Link überprüft. Wenn keine entsprechende Seite gefunden wird, wird der nächste Link versucht usw.
Bemerkung
Die Dokumentation wird nur für die QGIS Long Term Releases (LTR) versioniert und übersetzt. Das bedeutet, dass Sie, wenn Sie in einer regulären Version (z.B. QGIS 3.0) auf die Schaltfläche Hilfe klicken, als Voreinstellung das nächste LTR-Benutzerhandbuch angezeigt bekommen (d.h. 3.4 LTR), das aber Beschreibungen von Programmeigenschaften enthalten kann, die erst in neueren Versionen (3.2 und 3.4) enthalten sind. Falls keine LTR-Dokumentation verfügbar ist, wird die testing-Dokumentation angezeigt, die Programmeigenschaften von neueren und Entwicklerversionen enthält.
Einstellungen
Sie können die Benutzeroberflächeneinstellungen zurücksetzen (Neustart erforderlich) falls Sie eigene Anpassungen vorgenommen haben, diese aber wieder verwerfen wollen.
Umgebung
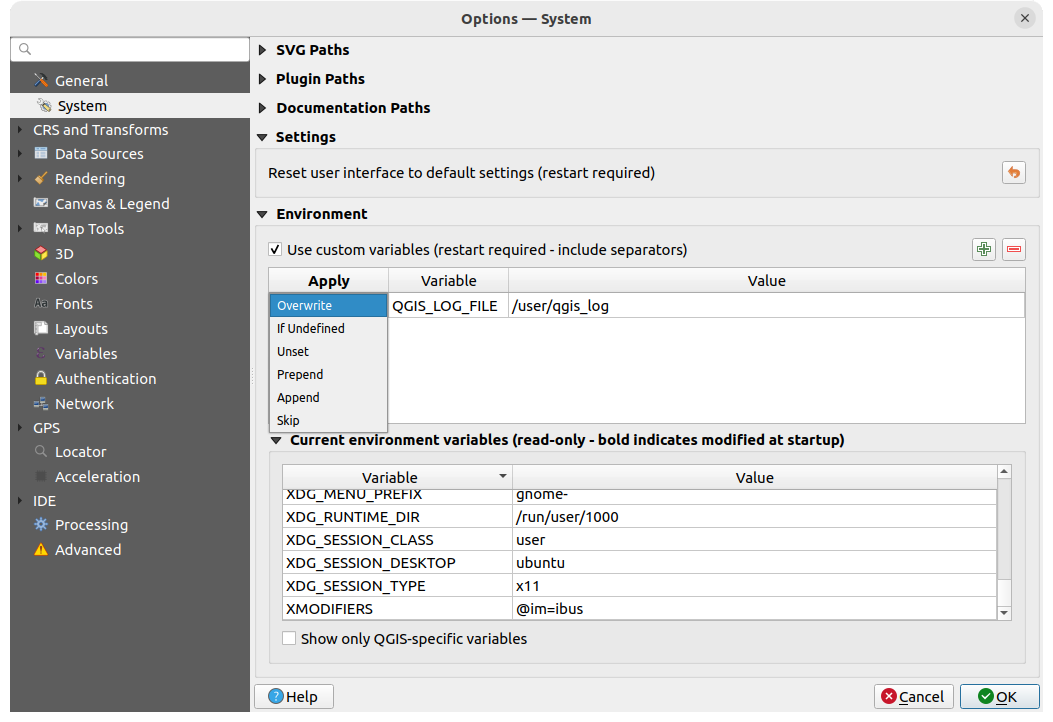
Abb. 5.2 Systemumgebungsvariablen
System environment variables can be viewed, and many configured, in the Environment group. This is useful for platforms, such as Mac, where a GUI application does not necessarily inherit the user’s shell environment. It’s also useful for setting and viewing environment variables for the external tool sets controlled by the Processing toolbox (e.g., GRASS), and for turning on debugging output for specific sections of the source code.
Wenn Sie das Kontrollkästchen Benutzerdefinierte Umgebungsvariablen verwenden (Neustart erforderlich - Trennzeichen einschließen) aktiviert haben, können Sie eine  neue Variable hinzufügen oder eine
  Variable entfernen. Für jedes neue Element können Sie einen Variable-Namen, einen Wert und die zu verwendende Anwenden-Methode konfigurieren, wobei die folgenden Methoden zur Verfügung stehen:
Überschreiben: ersetzt einen bereits existierenden Wert der Variablen
wenn definiert: Verwenden Sie diesen Wert für die Variable, wenn er nicht bereits auf einer höheren Ebene (z. B. auf Betriebssystem- oder Anwendungsebene) definiert ist
Nicht gesetzt: die Variable aus der Umgebung entfernen (der Parameter Wert wird nicht verwendet)
Voranstellen: den Wert dem bereits bestehenden Wert der Variablen voranstellen
Anhängen: den Wert dem bereits bestehenden Wert der Variablen anfügen
Überspringen: der Eintrag wird in der Liste für zukünftige Referenzzwecke aufbewahrt, aber nicht benutzt
Bereits definierte Umgebungsvariablen werden in Aktuelle Umgebungsvariablen angezeigt, wobei es möglich ist, sie durch Aktivierung der Checkbox Nur QGIS-spezifische Variablen anzeigen zu filtern.
5.1.3. Benutzerprofile
Bemerkung
Für weitere Informationen zur Verwaltung von Benutzerprofilen lesen Sie bitte den entsprechenden Abschnitt unter Arbeiten mit Benutzerprofilen.
5.1.4. KBS und Transformation
Bemerkung
Für weitere Informationen darüber, wie QGIS mit der Projektion von Layer umgeht, lesen Sie bitte den Abschnitt Arbeiten mit Projektionen.
5.1.4.1. KBS-Behandlung
Auf dem  KBS-Behandlung-Reiter können Sie festlegen, welches Koordinatenbezugssystem für ein neues Projekt oder einen neuen Layer verwendet werden soll.
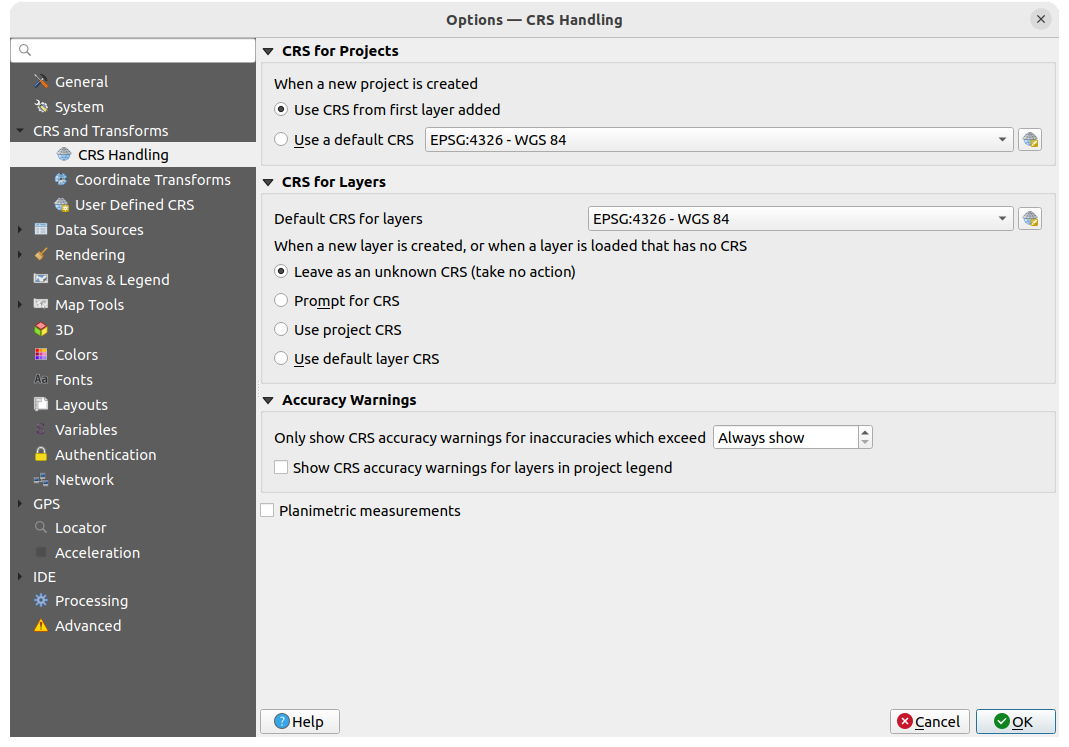
Abb. 5.3 KBS Einstellungen
KBS für Projekte
Um einem neu erzeugten Projekt ein KBS zuzuweisen, gibt es zwei Möglichkeiten:
- KBS des ersten hinzugefügten Layer verwenden: das KBS des Projekts wird auf das KBS des ersten geladenen Layers gesetzt
- Voreingestelltes KBS verwenden: Ein vorausgewähltes KBS wird standardmäßig auf jedes neue Projekt angewendet und bleibt beim Hinzufügen von Layern zum Projekt unverändert.
Die Auswahl wird für die Verwendung in späteren QGIS-Sitzungen gespeichert. Das Koordinatenbezugssystem des Projekts kann weiterhin über das Menü angepasst werden.
KBS für Layer
Vorgabe-KBS für Layer: hier können Sie ein Standard-KBS auswählen, das beim Erstellen eines Layers verwendet werden soll (wenn unten ausgewählt)
Sie können die Aktion festlegen, die ausgeführt werden soll, wenn ein neuer Layer erstellt wird oder wenn ein Layer ohne KBS geladen wird:
- Bei unbekanntem KBS belassen (nichts tun)
- KBS abfragen
- Projekt KBS verwenden
- Projekt KBS verwenden
Genauigkeitswarnungen
Only show CRS accuracy warnings for inaccuracies which exceed a given
distance: occurs when you are explicitly creating or modifying a dataset and
select a CRS based on a datum ensemble with lower
accuracy. The default is to Always show the warning if any inaccuracy.
KBS-Genauigkeitswarnung für Layer in Projektlegende anzeigen: Wenn diese Option aktiviert ist, wird für alle Layer mit einem KBS mit Genauigkeitsproblemen (d. h. einem dynamischen KBS ohne verfügbare Koordinatenepoche oder einem KBS, das auf einem Datumsensemble basiert, dessen inhärente Ungenauigkeit den vom Benutzer festgelegten Grenzwert überschreitet) das Warnsymbol  im Layer-Bedienfeld angezeigt, um darauf hinzuweisen, dass es sich um einen Layer mit geringer Genauigkeit handelt.
Dies wurde für den Einsatz in den Bereichen Ingenieurwesen, BIM, Asset Management und anderen Bereichen entwickelt, in denen Ungenauigkeiten dieser Art potenziell sehr gefährlich oder teuer sind!
Planimetrische Messungen: legt den Standardwert für die Eigenschaft von planimetrischen Messungen für neu erstellte Projekte fest.
5.1.4.2. Koordinatentransformationen
Auf dem  Koordinatentransformationen Reiter können Sie Koordinatentransformationen und Operationen festlegen, die beim Laden eines Layers in ein Projekt oder bei der Reprojektion eines Layers angewendet werden sollen.
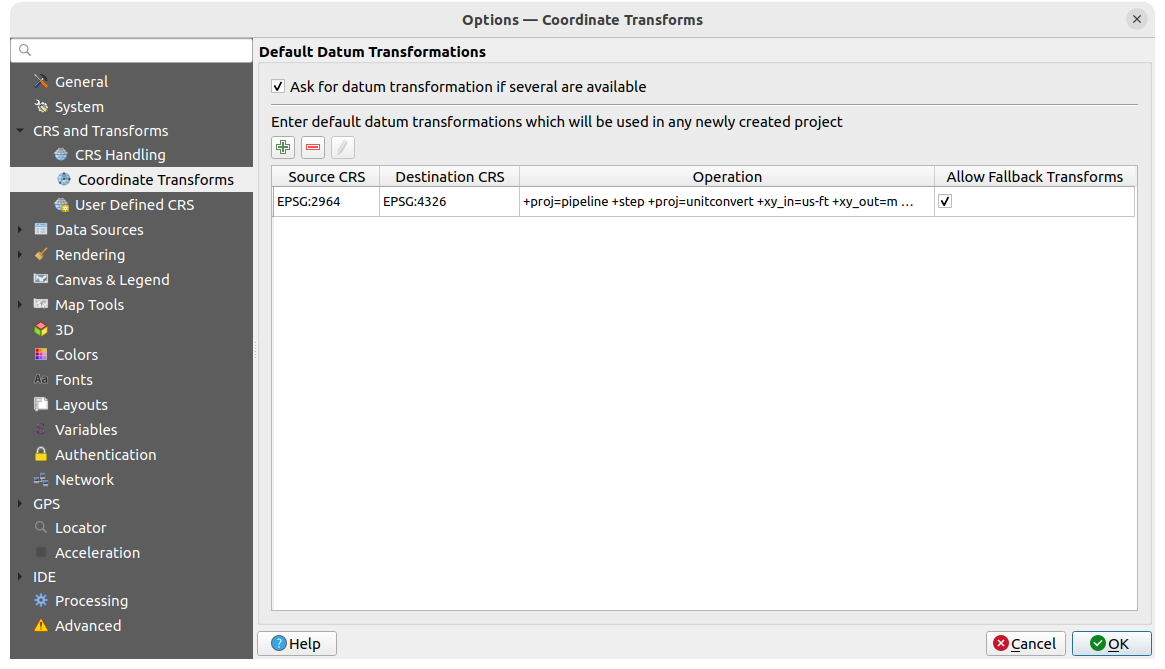
Abb. 5.4 Transformationseinstellungen
Datumstransformationsvorgabe
Hier können Sie einstellen, wie verfahren werden soll, wenn Layer in ein anderes KBS projiziert werden müssen:
automatisch die QGIS-Standardeinstellungen für Transformationen anwenden
oder Sie können individuelle Optionen einstellen:
- Datumstransformation erfragen, wenn mehrere verfügbar sind
aus einer vordefinierte Liste von Datumstransformationen eine bestimmte auswählen, die standardmäßig angewendet werden soll; für Details dazu siehe Datumstransformationen
Sie können Vorgabedatumstransformationen hinzufügen, entfernen oder  bearbeiten, die für alle neu erzeugten Projekte verwendet werden sollen.
5.1.4.3. Benutzerdefinierte KBS
Auf dem Reiter Benutzerdefinierte KBS können Sie Ihre eigenen KBS festlegen. Diese müssen dem WKT- oder Proj-Format entsprechen.
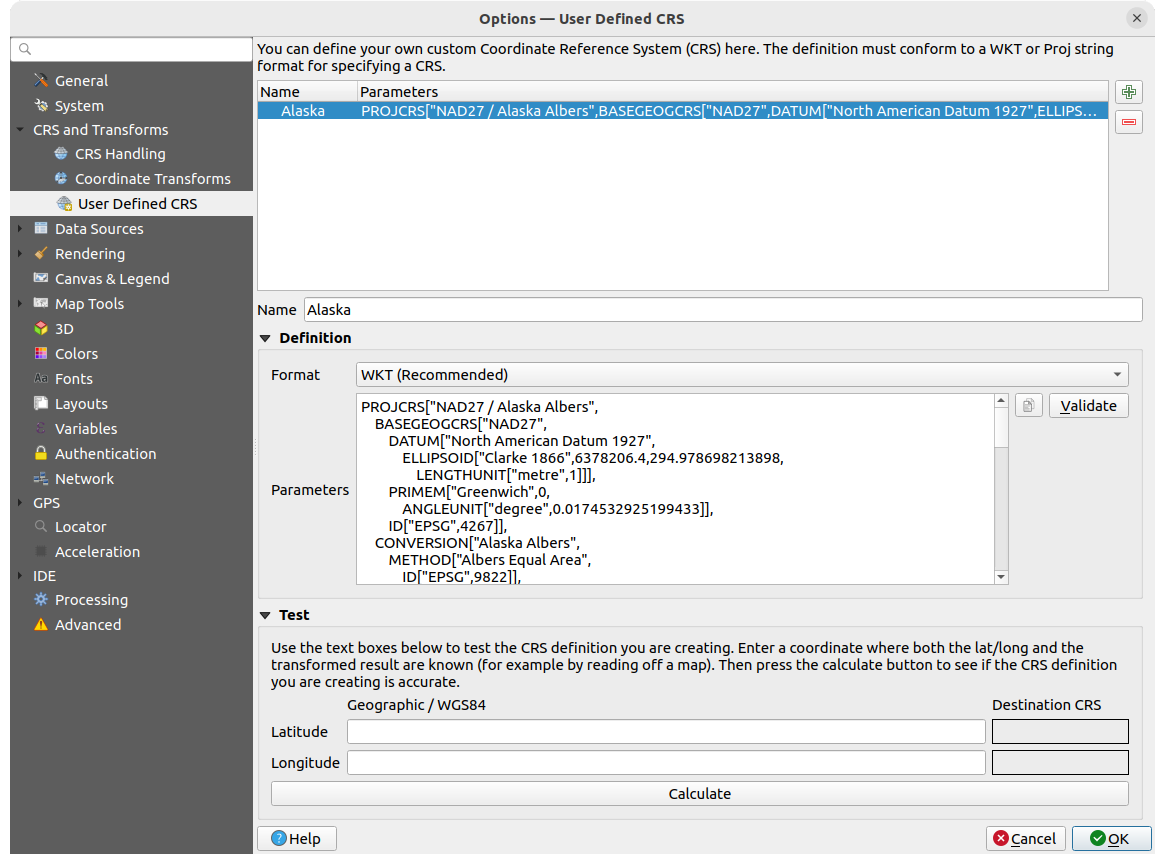
Abb. 5.5 Benutzerdefinierte KBS
Tragen Sie unter der Liste im Textfeld Name den gewünschten Namen ein und verwenden Sie die Neues KBS hinzufügen Schalfläche um ein neues KBS anzulegen. Wenn Sie ein vorhandenes KBS löschen möchten, können Sie die KBS entfernen Schlatfläche verwenden.
Definition
- Format
WKT (empfohlen)
Proj-Zeichenkette (Altlast - nicht empfohlen)
- Parameter
 Sie können die Parameter eines vorhandenem KBS kopieren
mit Validieren können Sie testen, ob Ihr Ausdruck korrekt ist
Test
Hier können Sie Ihre erstellte KBS-Definition anhand einer Umrechnung von Breiten- und Längengrad testen. Geben Sie eine bekannte Koordinate, um zu prüfen, ob die Umrechnung das korrekte Ergebnis liefert.
5.1.5. Datenquellen
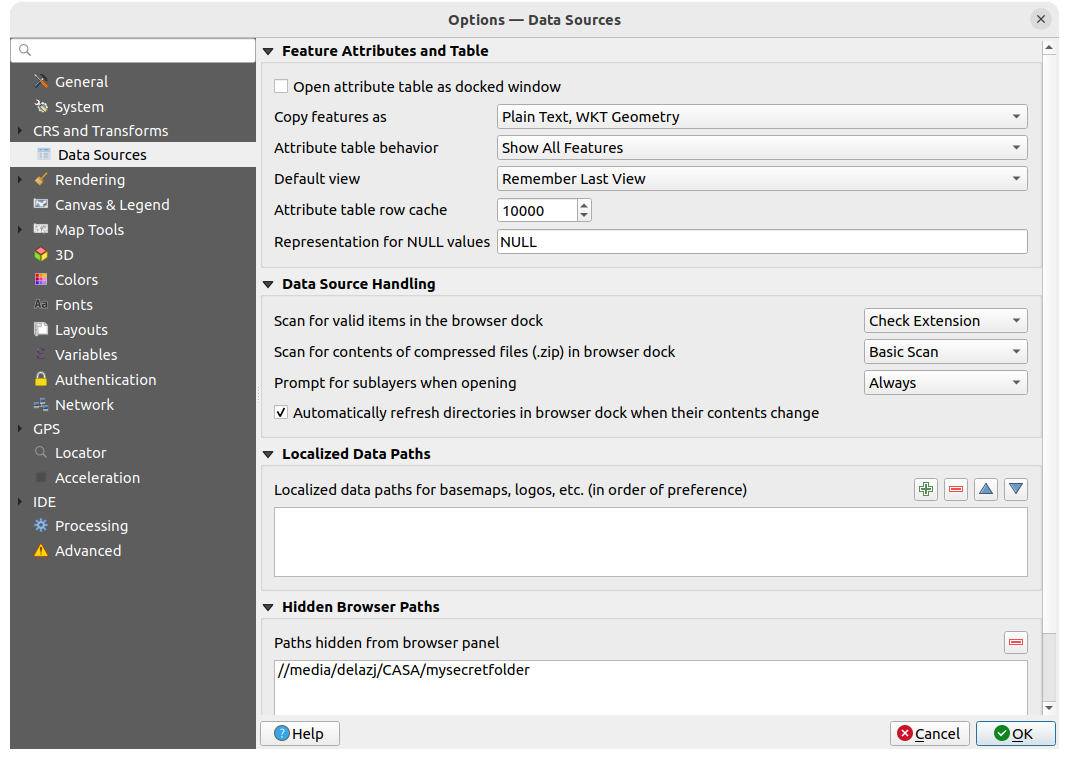
Abb. 5.6 Datenquellen
Objektattribute und -tabelle
- Attributtabelle im gedockten Fenster öffnen
- Beim Öffnen der Attributtabelle die Spaltengröße automatisch anpassen
Objekte kopieren als: Legt das Format fest, das für Daten verwendet werden soll, wenn Funktionen in andere Anwendungen eingefügt werden.
Einfacher Text, keine Geometrie: Attribute werden als Text kopiert, aber die Geometrie wird übersprungen
Einfacher Text, WKT-Geometrie: Attribute werden als Text kopiert und die Geometrie wird in WKT zurückgegeben
Einfacher Text, WKT-Geometrie: Attribute werden als Text kopiert und die Geometrie wird in WKT zurückgegeben (Hexadezimalformat)
GeoJSON: Attribute und Geometrie werden als GeoJSON-Daten formatiert
Attributtabellenverhalten
: setzt beim Öffnen einen Filter auf die Attributtabelle; es gibt die folgenden Möglichkeiten: ‚Alle Objekte anzeigen‘, ‚Alle gewählten Objekte anzeigen‘ and ‚Sichtbare Objekte der Karte anzeigen‘.Voreingestellte Ansicht: definiert den Ansichtsmodus der Attributtabelle beim Öffnen; mögliche Einstellungen sind ‚Letzte Ansicht merken‘, ‚Tabellenansicht‘ oder ‚Formularansicht‘
Attributtabellenzeilencache
 : hier wird die Anzahl der Zeilen der zuletzte geladenen Tabelle festgelegt, die im Cache gespeichert werden; der Cache wird gelöscht, wenn die Attributtabelle geschlossen wird
Repräsentation für NULL-Werte: Hier können Sie einen Wert festlegen, der in Datenfeldern angezeigt wird, die einen NULL-Wert enthalten
Tipp
Schnelleres Öffnen von Attributtabellen mit sehr vielen Zeilen
Wenn Sie mit Layern mit einer großen Anzahl von Datensätzen arbeiten, kann das Öffnen der Attributtabelle lange dauern, da für die Anzeige alle Zeilen des Layers abfragt werden. Wenn Sie das Attributtabellenverhalten auf Sichtbare Objekte der Karte anzeigen setzen, wird QGIS beim Öffnen der Tabelle nur die Features in der aktuellen Kartenansicht abfragen, was ein schnelleres Laden der Daten ermöglicht.
Beachten Sie, dass bei dieser Einstellung die Attributtabelle immer nur Objekte enthält, die in der Kartenansicht sichtbar waren, als die Tabelle geöffnet wurde. Das bedeutet, dass auch nach dem Verschieben des Kartenausschnitts mit Alle Objekte anzeigen in der Tabelle keine neuen Objekte angezeigt werden. Sie können jedoch die angezeigten Objekte aktualisieren, indem Sie die Option Features auf der Karte sichtbar machen auswählen.
Datenquellenbehandlung
Nach gültigen Element im Browser suchen
: hier können Sie zwischen ‚Erweiterung prüfen‘ und ‚Dateiinhalt prüfen‘ wählen.Inhalt komprimierter Dateien (.zip) im Browser durchsuchen
: legt fest, wie detailliert die Suche nach Informationen (für das Browser Bedienfeld) innerhalb solcher Dateien durchgeführt wird; die möglichen Einstellungen sind ‚Nein‘, ‚Grundsuche‘ and ‚Vollsuche‘.Beim Öffnen nach Unterlayern fragen: einige Raster unterstützen Unterlayer, diese werden in GDAL auch „subdatasets“ genannt; ein Beispiel sind netCDF-Dateien. Mit dieser Option können Sie festlegen, wie mit Unterlayern verfahren werden soll, wenn eine Datei mit Unterlayern geöffnet wird. Sie haben die folgenden Auswahlmöglichkeiten:
‚Immer‘: Immer fragen, ob es Unterlayer gibt
‘Wenn nötig’: Fragen, wenn der Layer keine Bänder, aber möglicherweise Unterlayer hat
‚Nie‘: Nicht fragen; es wird dann nichts geladen
‚Alle laden‘: Nicht fragen, aber immer alle Unterlayer laden
- Verzeichnisse im Browser-Dock automatisch aktualisieren, wenn sich der Inhalt ändert: Ermöglicht es Ihnen, die Überwachung von Verzeichnissen im Browser Bedienfeld zu deaktivieren (z. B. um eine mögliche Verlangsamung aufgrund von Netzwerklatenz zu vermeiden).
Lokalisierungsdatenpfade
Es ist möglich, lokalisierte Pfade für alle Arten von dateibasierten Datenquellen zu verwenden. Dabei handelt es sich um eine Liste von Pfaden, die zur Abstraktion des Speicherorts der Datenquelle verwendet werden. Wenn z. B. C:\my_maps in den lokalisierten Pfaden aufgeführt ist, wird ein Layer mit der Quelle C:\my_maps\my_country\ortho.tif im Projekt unter localized:my_country\ortho.tif gespeichert.
Die Pfade sind in der Reihenfolge ihrer Präferenz aufgelistet, d.h. QGIS sucht die Datei zuerst im ersten Pfad, dann im zweiten usw.
Ausgeblendeter Browserpfad
Hier werden alle Ordner aufgelistet, die Sie aus dem Browser Bedienfeld über das Kontextmenü ausgeblendet haben. Wenn Sie einen Ordner aus der Liste entfernen, wird er im Browser Bedienfeld wieder sichtbar.
5.1.5.1. GDAL
GDAL ist eine Datenaustauschbibliothek für Geodaten, die eine Vielzahl von Vektor- und Rasterformaten unterstützt. Sie stellt Treiber zum Lesen und (oft auch) Schreiben von Daten in diesen Formaten bereit. Die Registerkarte GDAL zeigt die Treiber für Raster- und Vektorformate mit ihren Funktionen an.
GDAL Raster- und Vektortreiber
Die Reiter Rastertreiber und Vektortreiber ermöglichen es Ihnen, festzulegen, welcher GDAL-Treiber zum Lesen und/oder Schreiben von Dateien verwendet werden soll, wenn mehr als ein GDAL-Treiber verfügbar ist.
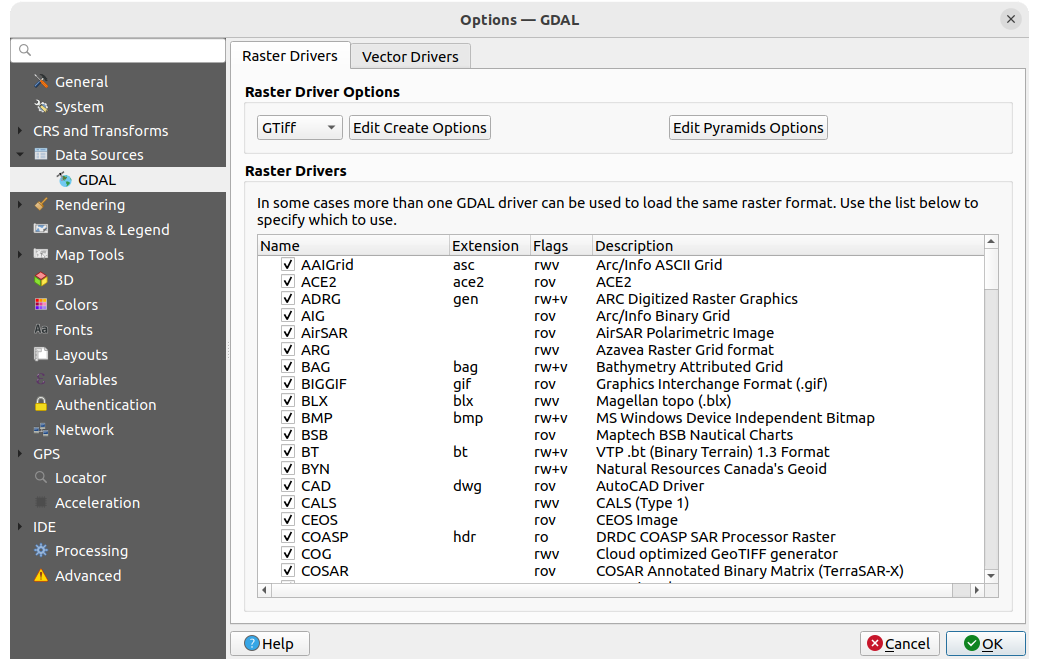
Abb. 5.7 GDAL - Rastertreiber
Tipp
Mit einem Doppelklick auf einen Rastertreiber für den Lese- und Schreibrechte bestehen (rw+(v)) öffnen Sie den Erzeugungsoptionen Dialog zur Anpassung.
Rastertreiberoptionen
Dieser Bereich bietet Möglichkeiten zur Anpassung des Verhaltens von Rastertreibern, auf die Lese- und Schreibzugriff besteht:
Edit create options: allows you to edit or add different profiles of file transformation, i.e., a set of predefined combinations of parameters (type and level of compression, BIGTIFF support, blocks size, overview, colorimetry, alpha…) to use when outputting raster files. The parameters depend on the driver.
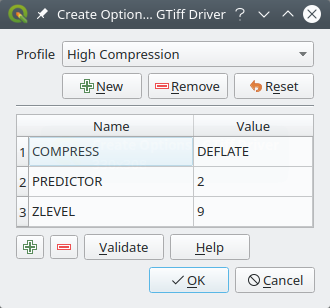
Abb. 5.8 Beispiel für die Erstellung eines Optionsprofils (für GeoTiff)
Im oberen Teil des Dialogfensters werden die aktuellen Profile aufgelistet, und Sie können neue Profile hinzufügen oder eines entfernen. Sie können das Profil auch auf seine Standardparameter zurücksetzen, wenn Sie diese geändert haben. Einige Treiber (z. B. GeoTiff) haben einige Beispielprofile, mit denen Sie arbeiten können.
Im unteren Bereich des Dialofensters finden Sie folgende Optionen:
Mit der
Schaltfläche können Sie neue Zeilen einfügen, in die Sie den Parameternamen und den Wert eintragenMit der
Schaltfläche können Sie den ausgewählten Parameter löschenMit der Prüfen Schaltfläche können Sie prüfen, ob die für das angegebene Format eingegebenen Erstellungsoptionen gültig sind
Verwenden Sie die Schaltfläche Hilfe, um die zu verwendenden Parameter zu finden, oder lesen Sie die GDAL-Rastertreiber-Dokumentation.
Pyramiden-Optionen bearbeiten
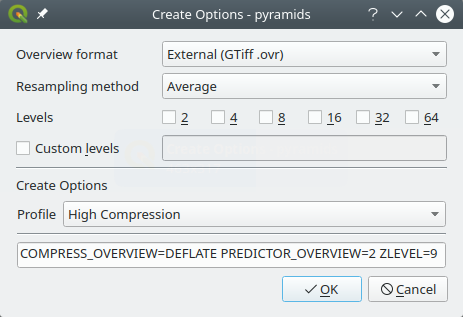
Abb. 5.9 Beispiel eines Pyramidenprofils
5.1.6. Darstellung
Der Reiter  Darstellung bietet Einstellungen zur Steuerung der Darstellung von Layern in der Kartenansicht.
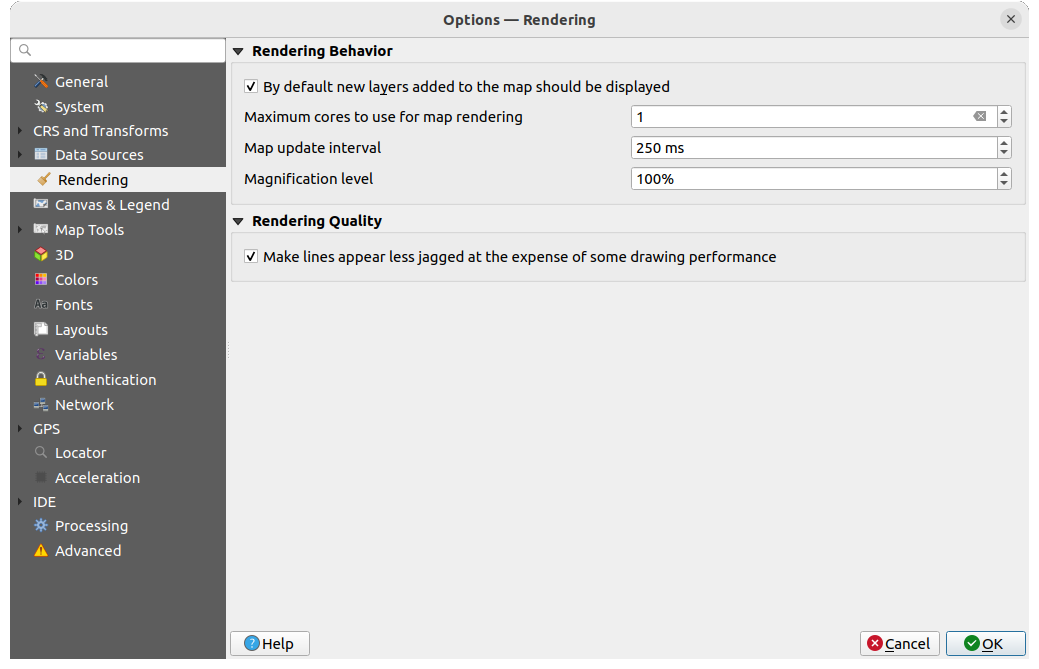
Abb. 5.10 Übersicht des Darstellungs-Reiters
Zeichenverhalten
- Normalerweise werden alle neuen Layer im Kartenfenster angezeigt: Die Deaktivierung dieser Option kann beim Laden mehrerer Layer nützlich sein, um zu vermeiden, dass jeder neue Layer in der Kartenansicht gerendert wird und so das Laden verlangsamt wird
Legen Sie die Anzahl der Maximal zu benutzenden Kerne fest
Die Kartenansicht wird im Hintergrund in einem separaten Image gerendert, und bei jedem Kartenaktualisierungsintervall (Standardwert 250 ms) wird der Inhalt dieses (nicht auf dem Bildschirm angezeigten) Images zur Aktualisierung der sichtbaren Kartenansicht verwendet. Wenn das Rendering der Kartenansicht jedoch schneller als diese Zeitspanne abgeschlossen ist, wird es sofort angezeigt.
Vergrößerungsgrad (siehe Abschnitt: Vergrößerung)
Zeichenqualität
- Linie auf Kosten der Zeichengeschwindigkeit weniger gezackt zeichnen
5.1.6.1. Einstellungen zur Vektor-Darstellung
Der Reiter  Vektor enthält spezifische Einstellungen für die Darstellung von Vektor-Layern.
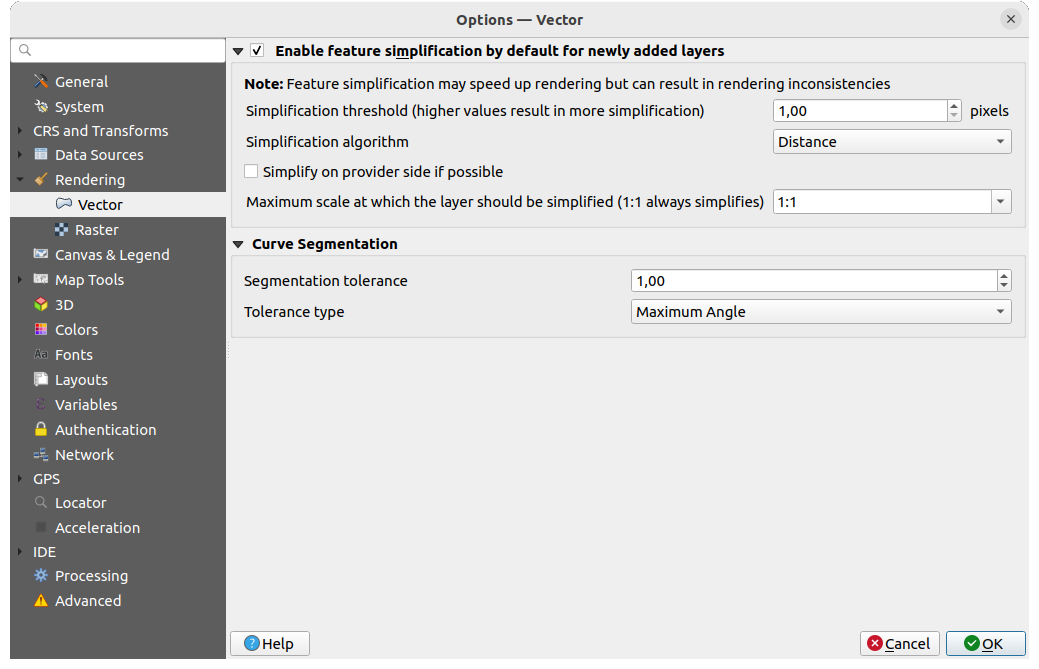
Abb. 5.11 Einstellungen zur Vektor-Darstellung
- Geometrievereinfachung für neue Layer voreinstellen: Sie können die Geometrie von Objekten in Vektorlayern vereinfachen (weniger Knoten), was zu einer schnelleren Darstellung führt. Beachten Sie jedoch, dass dies zu Inkonsistenzen bei der Darstellung führen kann. Verfügbare Einstellungen sind:
Vereinfachungsschwelle (höhere Werte führen zu stärkerer Vereinfachung)
Vereinfachungsalgorithmus: Diese Option führt eine lokale „On-the-Fly“-Vereinfachung der Features durch und beschleunigt das Rendering der Geometrien. Die von den Datenanbietern abgerufenen Geometrien werden dabei nicht verändert. Dies ist wichtig, wenn Sie Ausdrücke haben, die die Feature-Geometrie verwenden (z. B. Flächenberechnung) – es stellt sicher, dass diese Berechnungen auf der ursprünglichen Geometrie und nicht auf der vereinfachten Geometrie durchgeführt werden. Zu diesem Zweck bietet QGIS drei Algorithmen: „Entfernung“ (Standard), „SnapToGrid“ und „Visvalingam“.
- Simplify on provider side if possible: the geometries
are simplified by the provider (PostgreSQL, Oracle…) and unlike the
local-side simplification, geometry-based calculations may be affected
Größter Maßstab bis zu dem der Layer vereinfacht werden soll (1:1 vereinfacht immer)
Bemerkung
Neben der globalen Einstellung kann die Vereinfachung von Objekten für jeden einzelnen Layer über eingestellt werden.
Kurvensegmentierung
Segmentierungstoleranz: Diese Einstellung steuert die Art und Weise, wie Kreisbögen gerendert werden. Je kleiner der maximale Winkel (zwischen den beiden aufeinanderfolgenden Scheitelpunkten und dem Kurvenzentrum in Grad) oder die maximale Differenz (Abstand zwischen dem Segment der beiden Scheitelpunkte und der Kurvenlinie in Karteneinheiten), desto mehr geradlinige Segmente werden beim Rendern verwendet.
Toleranztyp: kann ‚Maximalwinkel‘ oder ‚Maximaldifferenz‘ zwischen Annäherung und Kurve sein.
5.1.6.2. Raster Einstellungen
Der Reiter  Raster enthält spezifische Einstellungen für die Darstellung von Raster-Layern.
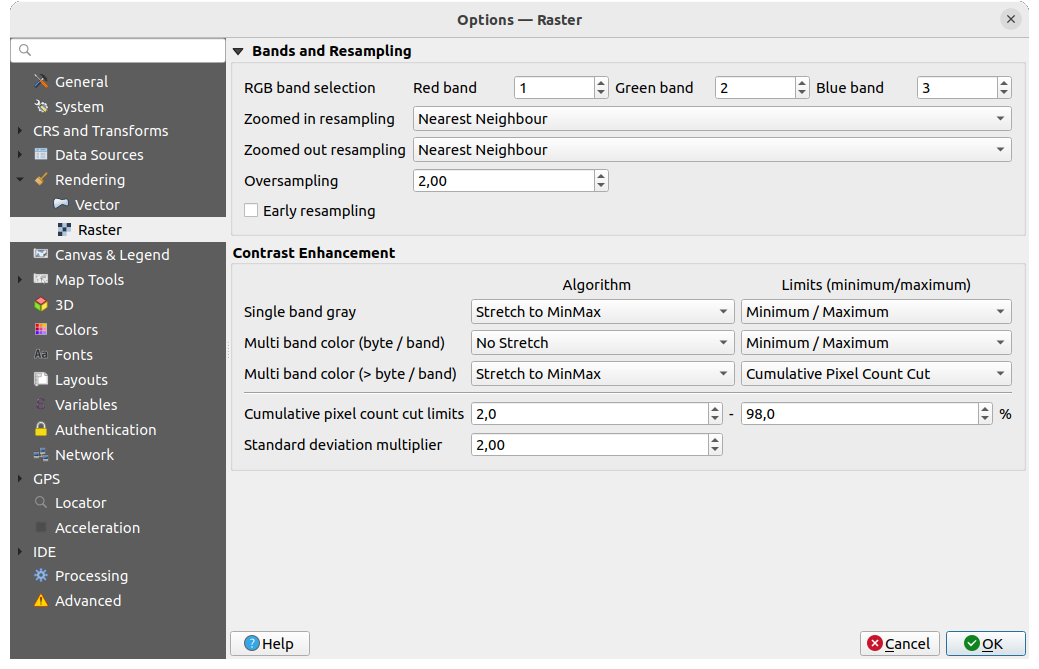
Abb. 5.12 Raster Einstellungen
Bereich Kanäle und Abtastung:
Mit RGB Kanalauswahl können Sie die Nummer für den Roten, Grünen und Blauen Kanal festlegen.
Bei der Abtastung für Hineinzoomen und der Abtastung für Hinauszoomen können verschiedene Methoden definiert werden; für Abtastung für Hineinzoomen können Sie zwischen drei Resampling-Methoden wählen: ‚Nächster Nachbar‘, ‚Bilinear (2x2 Kern)‘ und ‚Kubisch (4x4 Kern)‘. Für Abtastung für Hineinzoomen können Sie zwischen ‚Nächster Nachbar‘ und ‚Durchschnitt‘ wählen. Sie können auch einen Wert für die Überabtastung einstellen: zwischen 0,0 und 99,99 - je höher der Wert, umso länger dauert die Abtastung - der Standardwert ist 2,0.
- Frühe Abtastung: ermöglicht die Berechnung des Raster-Renderings auf der Seite des Datenanbieters (Datenquelle), wo die Auflösung der Quelle bekannt ist, und sorgt für ein besseres Zoomen beim Rendering mit QGIS benutzerdefiniertem Stil. Dies ist sehr praktisch für Vektor Tiles, die mit einer Interpretationsmethode geladen werden. Die Option kann auch auf Layer-Ebene gesetzt werden (Symbolisierung Eigenschaften).
Kontrastverbesserung kann für Einkanalgraustufen, Multikanalfarbe (Byte/Kanal) oder Multikanalfarbe (> Byte/Kanal) angewendet werden. Für jeden Punkt können Sie folgendes festlegen:
den zu verwendenden Algorithmus, welcher die Werte ‚Kein Strecken‘, ‚Strecken auf MinMax‘, ‚Auf MinMax strecken und zuschneiden‘ oder ‚Zuschneiden auf MinMax‘ haben kann
die Grenzen (Minimum/Maximum) festlegen, welche die Werte ‚Kumulativer Pixelanzahl-Schnitt‘, ‚Minimum/Maximum‘ oder ‚Mittlere +/- Standardabweichung‘ haben kann.
Die Kontrastverbesserung enthält darüber hinaus folgende Optionen:
Kommulative Pixelanzahl-Schnittgrenzen
Standardabweichungsfaktor
5.1.7. Karte & Legende
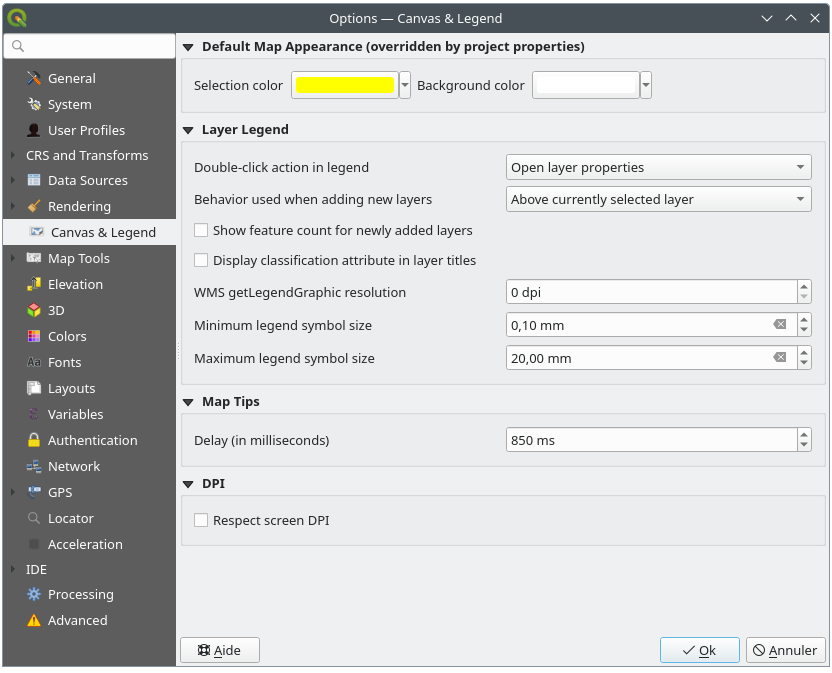
Abb. 5.13 Optionien auf dem Karte und Legende Reiter
Hier haben Sie die folgenden Einstellungsmöglichkeiten:
unter Voreingestelltes Kartenaussehen (Projekteigenschaften überschreiben): können Sie die Auswahlfarbe und die Hintergrundfarbe die verwendet werden sollen einstellen.
Anpassungsmöglichkeiten für die Layerlegende im Layer-Bedienfeld:
Doppelklick-Aktion in Legende: hier kann eingestellt werden, ob ein Doppelklick auf einen Layer entweder die Layereigenschaften öffnen (default), die Attributtabelle öffnen oder das Kartengestaltungsdock öffnen soll.
Beim Anlegen von neuen Layern verwendetes Verhalten: bestimmt, wo der Layer im Layer Bedienfeld platziert wird, wenn er in QGIS geladen wird. Das kann sein:
Über dem derzeitig gewählten Layer
Immer oben im Layerbaum
Optimaler Index in der aktuellen Layerbaumgruppe: Im Gegensatz zu den anderen Optionen, bei denen die neuen Layer direkt untereinander an der gewünschten Stelle platziert werden, wird bei dieser Option die Sortierlogik auf den gesamten Layerbaum (bzw. die aktive Gruppe) ausgedehnt und neue Layer werden „optimal“ eingefügt, d.h. Punktlayer werden auf Punktlayer, Linienlayer auf Linienlayer, Polygonlayer auf Polygonlayer usw. platziert.
- Objektanzahl für neu hinzugefügte Vektorlayer anzeigen: zeigt im Layer Bedienfeld die Anzahl der Objekte neben dem Layernamen an. Die Anzahl der Objekte in den Klassen (wenn vorhanden), wird ebenfalls angezeigt. Sie können mit der rechten Maustaste auf einen Layer klicken, um die Anzahl der Objekte ein- oder auszuschalten.
- Klassifikationssattribute in Layertiteln anzeigen im Layer-Bedienfeld, z. B. beim Anwenden eines kategorisierten oder regelbasierten Renderers (weitere Informationen finden Sie unter Symbolisierung).
die WMS-getLegendGraphic-Auflösung
mit Minimale Legendensymbolgröße und Maximale Legendensymbolgröße können Sie die Größe, mit der Symbole im ,:guilabel:Layer Bedienfeld angezeigt werden, einstellen
die Verzögerung (in Millisekunden) mit der Kartenhinweise eines Layers angezeigt werden
- Bildschirmauflösung berücksichtigen: Wenn diese Option aktiviert ist, versucht QGIS, die Kartenansicht mit physikalisch genauer Skalierung auf dem Bildschirm anzuzeigen, abhängig von der physikalischen DPI des Monitors. Symbole mit einer bestimmten Anzeigegröße werden ebenfalls genau dargestellt, z. B. wird ein 10-mm-Symbol auf dem Bildschirm als 10 mm angezeigt. Die Schriftgrößen der Beschriftungen in der Kartenansicht können jedoch von denen in der Benutzeroberfläche von QGIS oder anderen Anwendungen abweichen. Wenn diese Einstellung deaktiviert ist, verwendet QGIS die logische DPI des Betriebssystems, die mit anderen Anwendungen auf dem System übereinstimmt. Der Maßstab der Kartenansicht und die Größe der Symbole können jedoch auf dem Bildschirm physikalisch ungenau sein. Insbesondere auf Bildschirmen mit hoher DPI-Auflösung werden Symbole wahrscheinlich zu klein angezeigt.
Es wird empfohlen, die Option
Bildschirmauflösung berücksichtigen zu aktivieren, wenn Sie mehrere oder unterschiedliche Monitore verwenden und wenn Sie optisch hochwertige Kartenausdrucke erstellen wollen. Die Deaktivierung von Bildschirmauflösung berücksichtigen erzeugt eine Ausgabe, die in der Regel besser für Karten geeignet ist, die nur auf dem Bildschirm verwendet werden sollen, insbesondere wenn die Schriftgrößen anderen Anwendungen entsprechen sollen.
Bemerkung
Die Darstellung in Drucklayouts wird von der Einstellung Bildschirmauflösung berücksichtigen nicht beeinflusst; hier wird immer die angegebenen Auflösung verwendet. Beachten Sie auch, dass diese Einstellung die vom Betriebssystem gemeldete physische Bildschirm-Auflösung verwendet, der möglicherweise nicht bei allen Bildschirme korrekt ist.
5.1.8. Kartenwerkzeuge
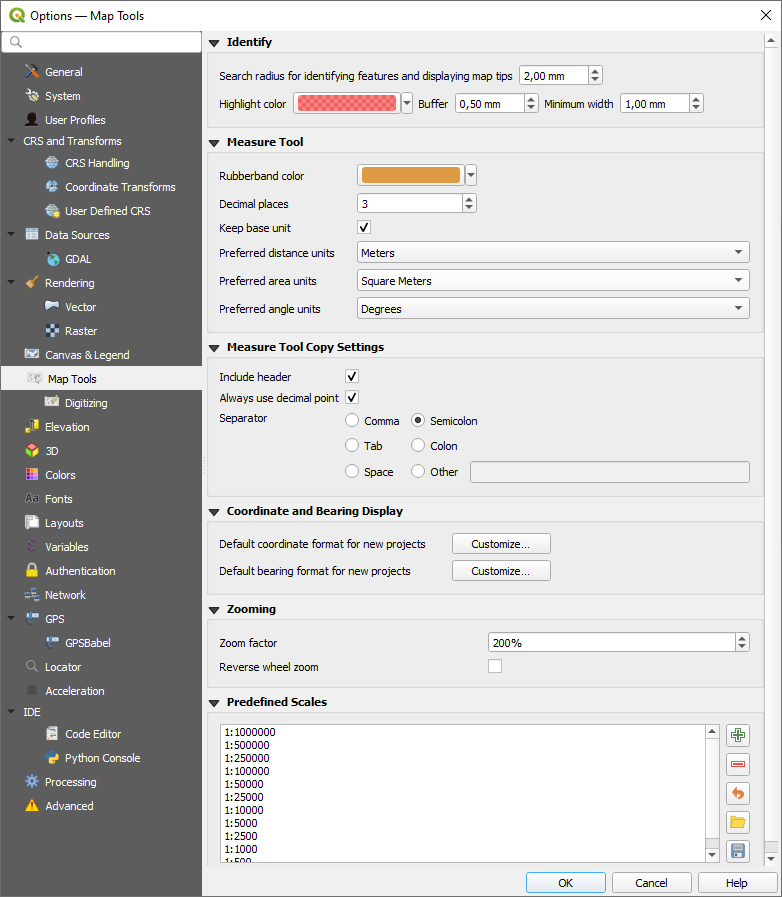
Abb. 5.14 Einstellungen Kartenwerkzeuge
Measurements, Coordinate and Bearing Display
This section provides ways to configure default units parameters:
Definieren Sie die Anzahl der Dezimalstellen, die beim Messen angezeigt werden.
Wenn
Basiseinheit beibehalten aktiviert ist, werden große Zahlen nicht automatisch umgewandelt (z. B. Meter in Kilometer).Für das Bevorzugte Winkelmaß sind die folgenden Optionen verfügbar: ‚Grad‘, ‚Bogenmaß‘, ‚Gon/Neugrad‘, ‚Bogenminuten‘, ‚Bogensekunden‘, ‚Umdrehungen‘, ‚Milliradianten (SI Definition)‘ und ‚Mil (NATO/Militärische Definition)‘.
Default distance units for new projects: options are ‚Meters‘, ‚Kilometers‘, ‚Feet‘, ‚Yards‘, ‚Miles‘, ‚Nautical Miles‘, ‚Centimeters‘, ‚Millimeters‘, ‚Inches‘, ‚Degrees‘ or ‚Map Units‘ (automatically matches the project’s CRS units)
Preferred area units for new projects: options are ‚Square meters‘, ‚Square kilometers‘, ‚Square feet‘, ‚Square yards‘, ‚Square miles‘, ‚Hectares‘, ‚Acres‘, ‚Square nautical miles‘, ‚Square centimeters‘, ‚Square millimeters‘, ‚Square inches‘, ‚Square degrees‘ or ‚Map Units‘ (automatically matches the project’s CRS units)
Vorgabekoordinatenformat für neue Projekte, wie es im Koordinatenfeld der QGIS-Statusleiste und im Bereich Koordinaten des
 Objekte abfragen Werkzeugs angezeigt wird.
Kursformat für neue Projekte, wie es in der Richtungsanzeige der Statusleiste und vom
 Kurs messen Werkzeug angezeigt wird.
The global options can be overridden at the project level, here for measurement units and here for coordinate and bearing formatting.
Identify tool
This group offers some options regarding the behavior of the Identify tool.
Mit Suchradius für die Objektidentifikation und zur Anzeige von Kartenhinweisen kann der Abstand eingestellt werden, innerhalb dessen das Identifizierungswerkzeug Ergebnisse anzeigt.
Mit der Hervorhebungsfarbe kann eingestellt werden, wie abgefragte Objekte angezeigt werden sollen.
Puffer legt die Größe des Puffers fest, mit der die Hervorhebung dargestellt wird.
Minimalbreite legt fest, wie dick die Umrisslinie eines hervorgehobenen Objektes sein soll.
Messwerkzeug
Definieren Sie die Gummibandfarbe für das Messwerkzeug.
Messwerkzeugkopiereinstellungen
Mit diesen Einstellungen können Sie das Verhalten der Schaltfläche Kopieren im Fenster  Linie messen steuern. Sie können Kopf einschließen auswählen, um die Spaltennamen beizubehalten, und Sie können auch ein Trennzeichen Ihrer Wahl verwenden. Sie können auch das Kontrollkästchen Immer Dezimalpunkt verwenden aktivieren, um Ihre in die Zwischenablage kopierten Koordinaten mit einem Punkt als Dezimaltrennzeichen beizubehalten, selbst wenn Ihre Spracheinstellungen in den QGIS-Optionen auf die Verwendung eines Kommas eingestellt sind. Wenn Sie in diesem Fall die Option Immer Dezimalpunkt verwenden nicht aktiviert haben, können Sie kein Komma als Feldtrennzeichen auswählen.
Zoomen
Sie können einen Zoomfaktor für Zoom-Werkzeuge und Mausrad festlegen.
- Mausradzoom umkehren ermöglicht es Ihnen, die Scrollrichtung des Mausrades anzupassen.
Vordefinierte Maßstäbe
Hier finden Sie eine Liste vordefinierter Maßstäbe, die standardmäßig in den maßstabsbezogenen Dropdown-Menüs angezeigt werden (z. B. in der Maßstab Statusleiste, in der Auswahl der Sichtbarkeitsmaßstäbe oder in den Einstellungen für weitere 2D-Kartenansichten). Mit den Schaltflächen und können Sie Ihre eigenen Maßstäbe hinzufügen oder entfernen. Sie können die Liste auch in eine XML-Datei exportieren oder daraus importieren. Auf der rechten Seite steht eine Schaltfläche zur Verfügung, um die Liste wieder auf die Standardeinträge zurückzusetzen.
Im Dialogfeld der Projekteigenschaften können Sie auch eine eigene Liste von Maßstäben festlegen, die diese globale Liste in den Dropdown-Menüs überschreibt.
5.1.8.1. Digitalisieren
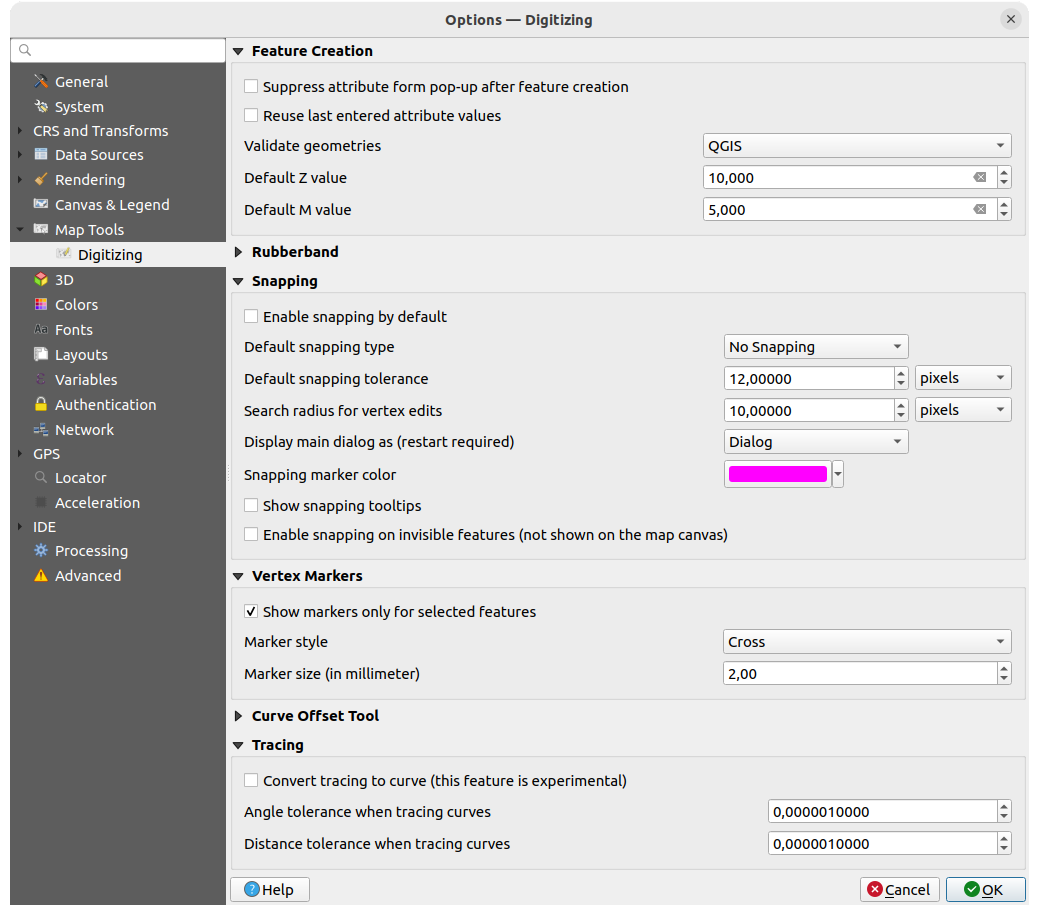
Abb. 5.15 Digitalisieren
Hier können Sie grundsätzlich Einstellungen für die Bearbeitung eines Vektorlayers festlegen (Geometrien und Attribute).
Objekterzeugung
Mit
Attributeingabeformular bei der Objekterstellung unterdrücken können Sie verhindern, dass das Attributeingabeformular automatisch bei der Erstellung eines neuen Objekts erscheint (Achtung: diese Auswahl kann für jeden Layer in den Layer-Eigenschaften überschrieben werden!).- Letzte Attributwerteingaben wiederverwenden: Speichert den zuletzt verwendeten Wert jedes Attributs und verwendet ihn als Standardwert für das nächste zu digitalisierende Objekt. Funktioniert innerhalb eines Layers. Dieses Verhalten kann auch pro Feld gesteuert werden (siehe Einstellung der Feldfunktionsweisen).
Validate geometries. Editing complex lines and polygons with many nodes can result in very slow rendering. This is because the default validation procedures in QGIS can take a lot of time. To speed up rendering, it is possible to select GEOS geometry validation or to switch it off. GEOS geometry validation is much faster, but the disadvantage is that only the first geometry problem will be reported.
Beachten Sie, dass je nach Auswahl, die Berichte über Geometriefehler unterschiedlich ausfallen können (s. Types of error messages and their meanings)
Der Z-Vorgabewert wenn neue 3D Objekte erstellt werden kann hier festgelegt werden.
Gummiband
Hier können Sie die Linienstärke, Linienfarbe and die Füllfarbe festlegen.
Gummiband bei der Stützpunktbearbeitung nicht aktualisieren.
Einrasten
Mit
Einrasten voreinstellen legen Sie fest, dass die Einrastfunktion aktiviert ist, wenn ein Projekt geöffnet wird.Sie können den Vorgabeeinrasttyp
festlegen: (‚Stützpunkt‘, ‚Segment‘, ‚Fläche‘, ‚Zentroid‘, ‚Segmentmitte‘, ‚Linienendpunkte‘)Definieren Sie die Einrasttoleranzvorgabe in Karteneinheiten oder Pixeln.
Definieren Sie den Suchradius für Stützpunktbearbeitung in Karteneinheiten oder Pixeln.
Mit Hauptfenster anzeigen in (erfordert Neustart) können Sie festlegen, ob das Einrasten-Fenster als ‚Dialog‘ oder als ‚Dock‘ angezeigt wird.
Die Einrastmarkierfarbe kann ausgewählt werden.
Wenn
Einrasthinweise anzeigen aktiviert ist, wird z.B. der Name des Layers angezeigt, an den gefangen wird. Das ist hilfreich, wenn mehrere Layer übereinander liegen.Sie können auch das
Einrasten auf verborgene (nicht auf der Karte sichtbare) Objekte aktivieren.
Stützpunktmarkierungen
Sie können
Markierungen nur für gewählte Objekte anzeigen lassen.Legen Sie für die Stützpunktmarker den Markierungsstil
(‚Kreuz‘ (standard), ‚Teiltransparenter Kreis‘ oder ‚Keine‘) festDefinieren Sie die Markierungsgröße (in Millimeter)
Werkzeug zum Versetzen von Linien
Die nächsten Optionen beziehen sich auf das Werkzeug  Linie versetzen in Erweiterte Digitalisierung. Durch die verschiedenen Einstellungen kann die Form des Linienversatzes beeinflusst werden.
Verbindungsstil: Legt fest, ob beim Versetzen von Ecken die Verbindungen „rund“, „eckig“ oder „abgefast“ sein sollen.
Quadrantensegmente: Steuert die Anzahl der Liniensegmente, die zur Annäherung an einen Viertelkreis beim Erstellen abgerundeter Versätze verwendet werden sollen.
Eckgrenze: Legt den maximalen Abstand von der versetzten Geometrie fest, der beim Erstellen einer Gehrungsverbindung als Faktor des Versatzabstands verwendet werden soll (gilt nur für Gehrungsverbindungen).
Endstil: Legt fest, wie Zeilenenden behandelt werden; sie können „rund“, „flach“ oder „quadratsich“ sein.
Spurverfolgung
Wenn Spurverfolgung in Kurve umwandeln aktiviert ist, können Sie während der Digitalisierung automatisch Kurvensegemente erstellen. Bitte beachten Sie, dass es sich um eine experimentelle Funktion handelt und dass der Datenanbieter/Datentyp, den Sie verwenden, diese Funktion unterstützen muss.
5.1.9. Höhe
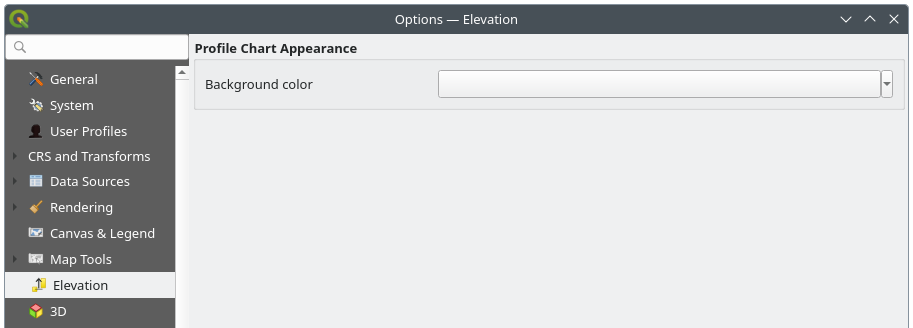
Abb. 5.16 Höhe
In  Elevation menu, you can set a specific color
to use as the Background color for elevation profiles.
This can make the chart more readable for certain datasets, e.g., point clouds with RGB coloring,
where the default background color is too similar to point colors to be easily discernible.
If unchanged, the elevation profiles will continue to display using the standard system background color.
Elevation menu, you can set a specific color
to use as the Background color for elevation profiles.
This can make the chart more readable for certain datasets, e.g., point clouds with RGB coloring,
where the default background color is too similar to point colors to be easily discernible.
If unchanged, the elevation profiles will continue to display using the standard system background color.
5.1.10. 3D-Einstellungen
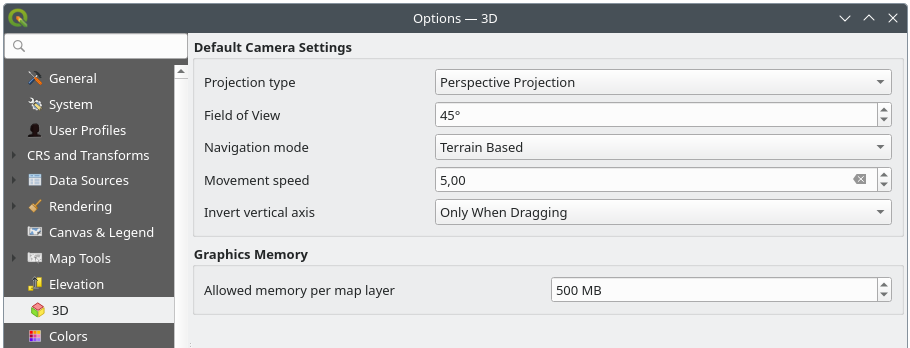
Abb. 5.17 3D-Einstellungen
Der  3D Reiter hilft Ihnen, einige Standardeinstellungen für 3D Kartenansichten zu konfigurieren. Dies sind:
Kameravoreinstellungen:
Projektionstyp: ermöglicht die Betrachtung der 3D-Kartenansicht in einer:
Perspektivische Projektion (Standard): Parallele Linien scheinen sich in der Ferne zu treffen. Objekte scheinen zu schrumpfen, je weiter sie von der Kamera entfernt sind.
oder eine Orthogonale Projektion: Parallele Linien erscheinen parallel. Objekte erscheinen unabhängig von der Entfernung in der gleichen Größe.
Sichtfeld der Kamera (nur bei perspektivischer Projektion relevant): legt einen Wert für das vertikale Sichtfeld in Grad an und bestimmt dadurch, wie viel der Ansicht für die Kamera sichtbar ist. Der Standardwert ist 45°.
Navigationsmodus: bietet verschiedene Möglichkeiten zur Interaktion mit der 3D-Kartenansicht. Verfügbare Modi sind:
Gelände basierend: Die Kamera folgt einer festen Position auf der Oberfläche des Geländes, während durch die Ansicht navigiert wird.
Gehmodus (Erste Person)
Je nach gewähltem Modus unterscheiden sich die Navigationsbefehle.
Bewegungsgeschwindigkeit
Vertikale Achse invertieren: Legt fest, ob die Bewegungen der vertikalen Achse gegenüber ihrem normalen Verhalten invertiert werden sollen. Wirkt sich nur auf Bewegungen im Gehmodus aus. Die möglichen Einstellungen sind:
Nie
Nur beim Ziehen: bewirkt, dass die vertikale Bewegung nur dann invertiert wird, wenn eine Kameradrehung durch Klicken und Ziehen durchgeführt wird.
and Immer: bewirkt, dass die Bewegungen invertiert werden, sowohl beim Klicken und Ziehen als auch wenn die Kamerabewegung an den Cursor gebunden ist (durch Drücken der ~-Taste ).
Unter Grafikspeicher können Sie mit der Option Gestatteter Speicher pro Kartenlayer das GPU-Speicherlimit für jeden Layer festlegen. Dies kann nützlich sein, wenn Sie 3D-Kartenansichten mit großem GPU-Speicherbedarf erstellen. Wenn das eingestellte Limit erreicht wird, wird eine Warnung angezeigt, die bei der Problemlösung helfen soll.
5.1.11. Farben
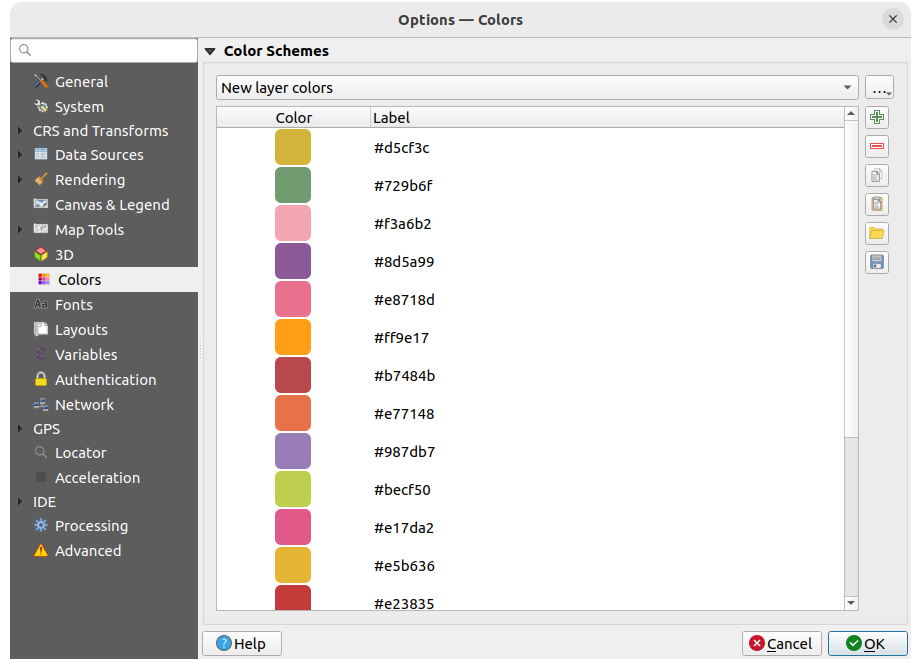
Abb. 5.18 Farben
Mit diesem Menü können Sie Farbpaletten erstellen oder verändern, die in der gesamten Anwendung über die Farbauswahl aufgerufen werden können. Über das Dropdownmenü können Sie die folgenden Farbschemata aufrufen:
Zuletzt verwendete Farben zeigt eben diese
:guilabel:`Standardfarben“
Projektfarben, eine Reihe von Farben, die für das aktuelle Projekt festgelegt sind (siehe Stile für weitere Details)
Farben für neue Layer, ein Farbschema, das standardmäßig verwendet wird, wenn neue Layer zu QGIS hinzugefügt werden
oder benutzerdefinierte Palette(n), die Sie mit der Schaltfläche … neben der Dropdown-Menü erstellen oder importieren können.
Die Paletten Zuletzt verwendete Farben, Standardfarben und Projektfarben können nicht entfernt werden und erscheinen immer als Farbknöpfe im Dropdown-Menü der Farbauswahl. Über die Option Anzeigen in Farbschaltflächen können auch benutzerdefinierte Paletten an dieser Stelle zur Verfügung gestellt werden.
Für jede der Paletten können Sie die Liste der Farben mit den Werkzeugen auf der rechten Seite verwalten:
Eine
Farbe hinzufügen oder eine Farbe entfernenEine
Farbe kopieren oder eine  Farbe einfügen
Die ganze Farbpalette als
.gplDatei Importieren oder
  Exportieren.
Doppelklicken Sie auf eine Farbe in der Liste, um sie mit dem Farbauswahl Dialog zu ändern. Mit einem Doppelklick in die Spalte Beschriftung können Sie die Farbe auch benennen bzw. umbenennen.
5.1.12. Schriftarten
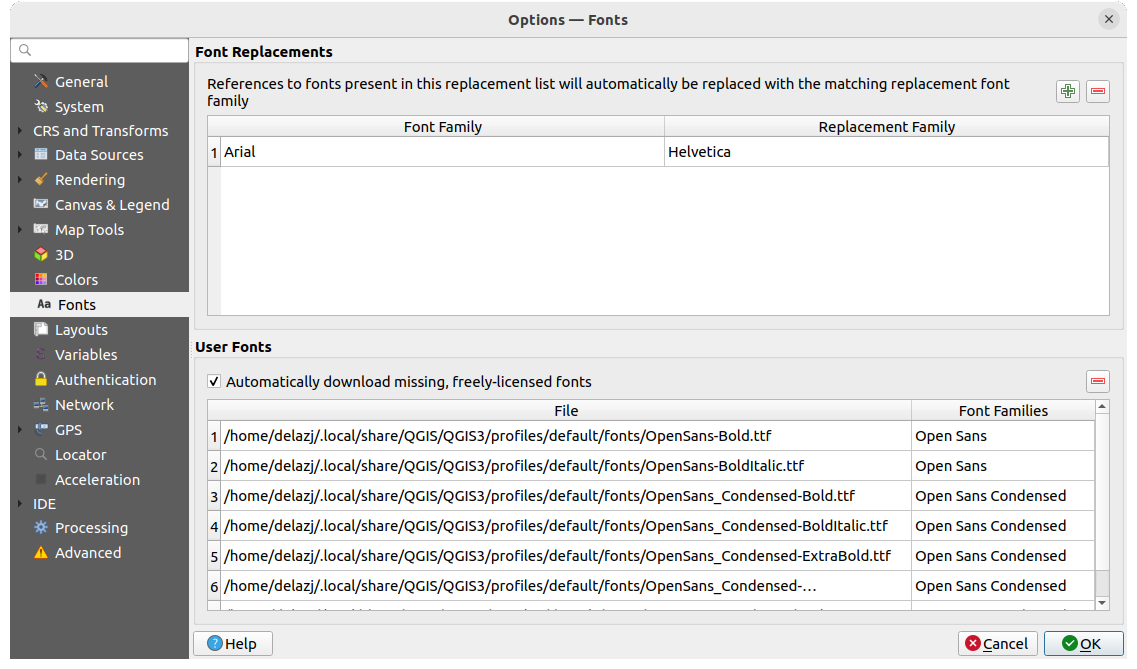
Abb. 5.19 Der Schriftarten-Reiter
Der Schriftarten Reiter bietet Unterstützung bei der Verwaltung der projektübergreifend verwendeten Schriftarten:
Schriftartenersetzungen: Ermöglicht das Erstellen einer Liste mit automatischen Schriftartersetzungen, die beim Laden von Projekten oder Stilen angewendet werden, wodurch Projekte und Stile, die auf verschiedenen Betriebssystemen verwendet werden, besser unterstützt werden (z. B. Ersetzen von „Arial” durch „Helvetica”).
Benutzerschriftarten: Ermöglicht es Ihnen, TTF- oder OTF-Schriftarten im Unterordner
fontsdes Benutzerprofils abzulegen. Diese Schriftarten können beim Start von QGIS automatisch geladen werden. Auf diese Weise können Sie Schriftarten verwenden, ohne dass sie auf Betriebssystemebene installiert sein müssen, was in Unternehmensumgebungen häufig blockiert wird. Das Fenster listet alle installierten Benutzerschriften auf und ermöglicht Ihnen die Verwaltung (d. h. das Entfernen) zuvor installierter Benutzerschriften.Es ist auch möglich, das Kontrollkästchen „Automatisch fehlende frei lizenzierte Schriftarten herunterladen“ zu aktivieren: Wenn Sie beispielsweise ein Projekt oder einen Stil öffnen oder versuchen, eine Vektorkachel-Ebene zu laden, die auf derzeit nicht verfügbare Schriftarten verweist, wird eine fest codierte Liste frei lizenzierter Schriftarten zum Herunterladen über eine URL konsultiert, um festzustellen, ob die Schriftart automatisch in das Schriftartenverzeichnis des Benutzerprofils heruntergeladen werden kann (mit Benachrichtigung über die Schriftartlizenz).
5.1.13. Layouts
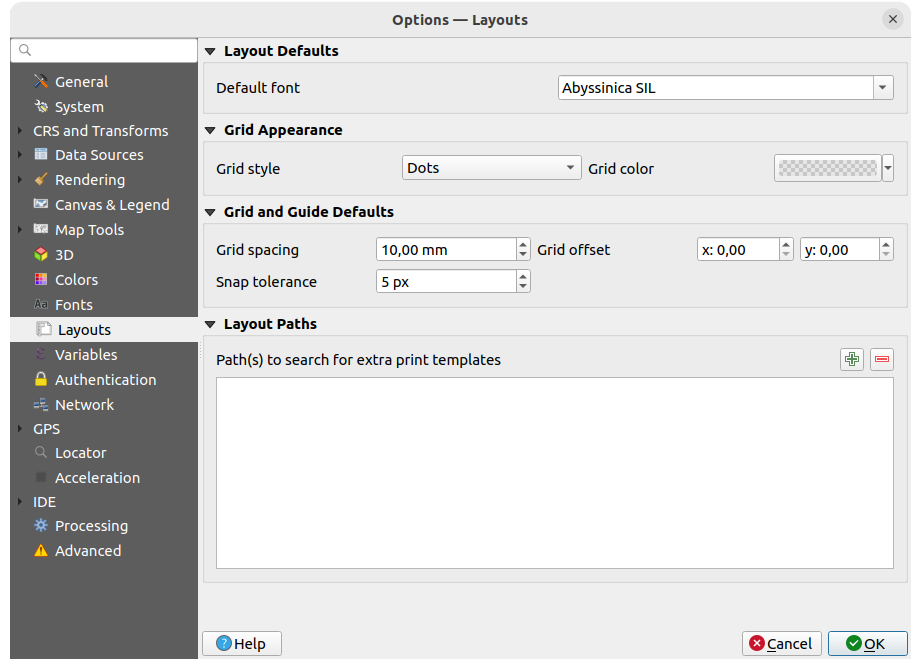
Abb. 5.20 Layouts
Layoutvorgaben
Sie können die Vorgabeschriftart definieren, die für Kartenlayouts verwendet wird.
Gitterdarstellung
Definieren Sie den Gitterstil, die möglichen Optionen sind ‚Ausgefüllt‘, ‚Punkte‘ (Standard) und ‚Kreuze‘.
Sie können auch die Gitterfarbe defnieren.
Gitter- und Führungsvoreinstellungen
Definieren Sie den Gitterabstand
Definieren Sie den Gitterversatz jeweils für die x- und die y-Achse getrennt
Definieren Sie die Einrasttoleranz, mit der am Gitter gefangen wird
Layoutpfade
Sie können Pfad(e), um nach zusätzlichen Druckvorlagen zu suchen: hinzufügen; wenn Sie die Layout-Verwaltung öffnen, werden auch die Dateien, die sich in den hinzugefügten Ordnern befinden, als Vorlagen angezeigt.
5.1.14. Variablen
Der Reiter Variablen listet alle auf der globalen Ebene verfügbaren Variablen auf.
Es ist auch möglich, eigene Variablen zu definieren. Klicken Sie auf die Schaltfläche , um eine neue benutzerdefinierte Variable auf globaler Ebene hinzuzufügen. Wenn Sie eine benutzerdefinierte Variable aus der Liste auswählen, können Sie diese bearbeiten oder mit der Schaltfläche wieder entfernen.
Mehr Informationen über Variable erhalten sie im Abschnitt Speichern von Werten in Variablen.
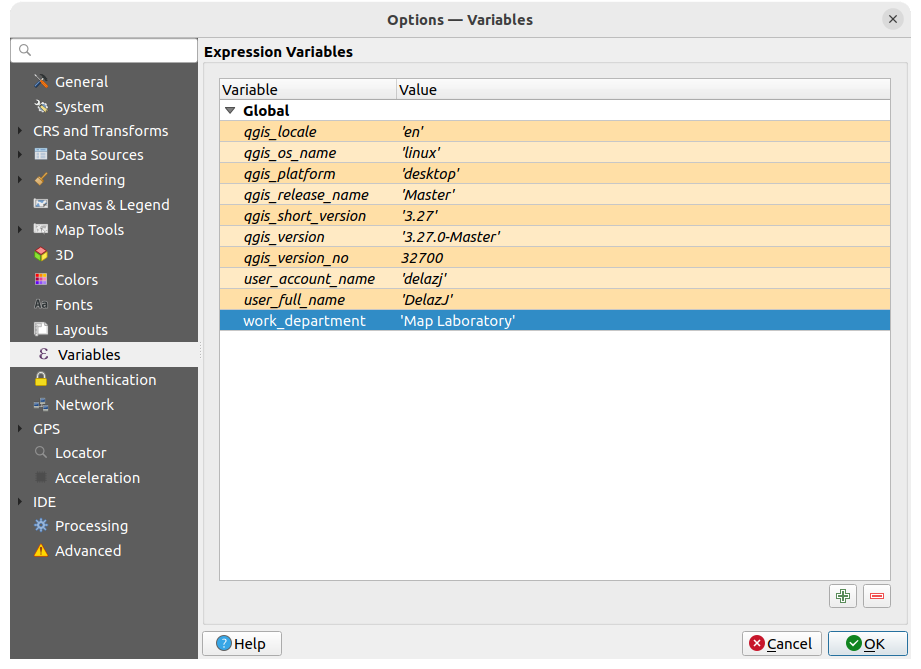
Abb. 5.21 Variablen
5.1.15. Authentifizierung
Auf dem Reiter Authentifizierung können Sie Authentifikationskonfigurationen vornehmen und PKI Zertifikate verwalten. Für mehr Details siehe Authentifizierungssystem.
Zur Verwaltung der Authentifizierungen können Sie die Liste der Werkzeuge neben dem Rahmen verwenden:
- Neue Authentifizierungskonfiguration hinzufügen
- Gewählte Authentifizierungskonfiguration löschen
 Gewählte Authentifizierungskonfiguration bearbeiten

Abb. 5.22 Authentifizierung
5.1.16. Netzwerk
Allgemein
Definieren Sie die Zeitüberschreitung bei Netzwerkanfragen (ms) - der Standardwert ist 60.000ms.
Definieren Sie die Verfallszeitraumvorgabe für WMS-Eigenschaften (Stunden) - der Standardwert ist 24 Stunden.
Definieren sie die Verfallszeitraumvorgabe für WMS-C-/WMTS-Kacheln (Stunden) - der Standardwert ist 24 Stunden.
Definieren Sie die Max. Wiederholungen bei Kachel- oder Objektabfragefehlern - der Standardwert ist 3.
Definieren Sie User-Agent-Präfix, dessen Standardwert
Mozilla/5.0lautet. Dieser Wert wird sowohl der QGIS- als auch der Betriebssystemversion vorangestellt, z. B.Mozilla/5.0 QGIS/33801/Ubuntu 22.04.4 LTS, um den User-Agent zu formen.
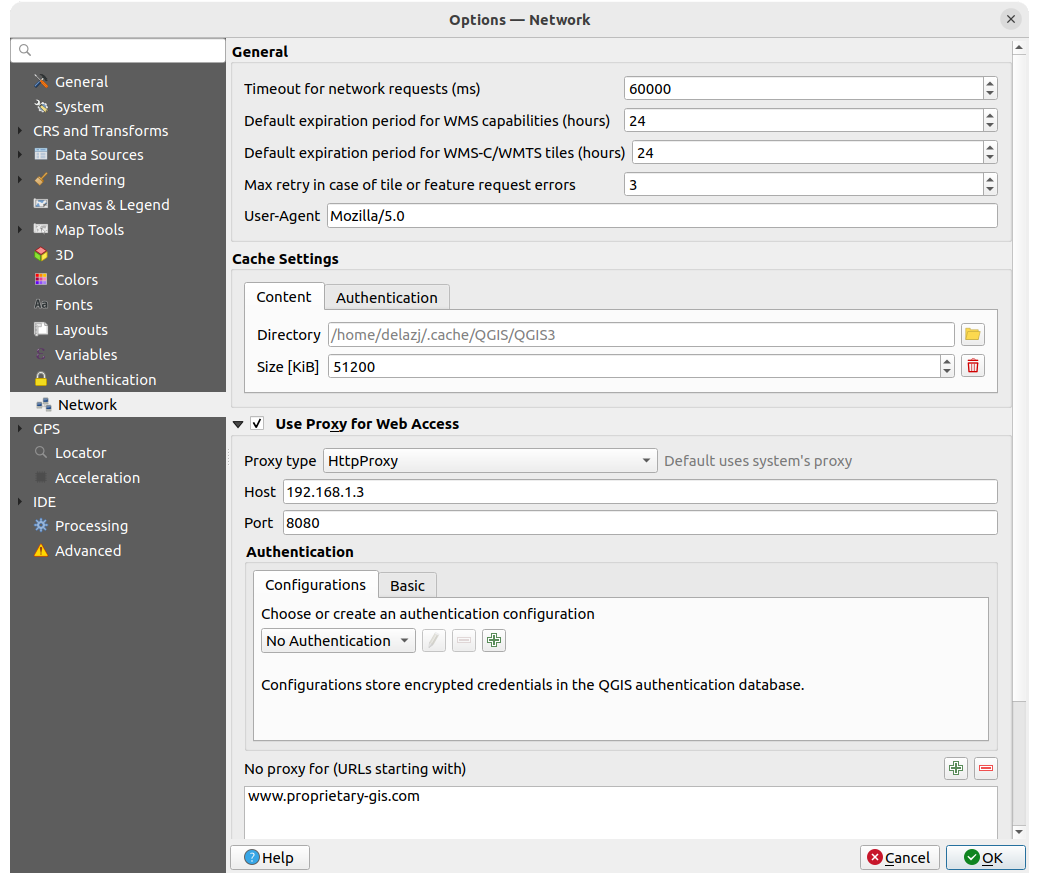
Abb. 5.23 Optionen auf dem Netzwerk-Reiter
Cache-Einstellungen
Definiert das Verzeichnis und eine Größe für den Cache in Megabyte. Sie können den Wert löschen, um die Option Angepaßte Cachegröße zu aktivieren, die die maximale Cachegröße basierend auf dem verfügbaren Speicherplatz festlegt. Bietet außerdem Tools zum automatischen Löschen des Verbindungsauthentifizierungs-Caches bei SSL-Fehlern (empfohlen).
Proxy-Einstellungen
- Proxy für Webzugriff verwenden
Stellen Sie den Proxytyp
entsprechend Ihren Bedürfnissen ein und definieren Sie ‚Host‘ und ‚Port‘. Verfügbare Proxy-Typen sind:: Der Proxy wird auf der Grundlage des System-Proxys bestimmt
: Proxy für jede Art von Verbindung. Unterstützt TCP, UDP, Bindung an einen Port (eingehende Verbindungen) und Authentifizierung.
: Umgesetzt mit dem „CONNECT“-Befehl, unterstützt nur ausgehende TCP-Verbindungen; unterstützt Authentifizierung.
: Umgesetzt mit normalen HTTP Befehlen ist dies nur im Zusammenhang mit HTTP Befehlen sinnvoll einzusetzen.
: Mit einem FTP-Proxy umgesetzt ist dies nur sinnvoll im Zusammenhang mit FTP-Anforderungen anzuwenden
Die Berechtigungsnachweise des Proxys werden mit dem Authentifizierungs-Werkzeug gesetzt.
Im Textfeld unter den Proxy-Einstellungen kann der Ausschluss bestimmter URLs eingetragen werden (siehe Abb. 5.23). Es wird kein Proxy verwendet, wenn die Ziel-URL mit einer der in diesem Textfeld aufgeführten Zeichenfolgen beginnt.
Wenn Sie detailliertere Informationen über die verschiedenen Proxy-Einstellungen benötigen, lesen Sie bitte das Handbuch der zugrundeliegenden QT-Bibliotheksdokumentation unter https://doc.qt.io/archives/qt-5.9/qnetworkproxy.html#ProxyType-enum.
Tipp
Proxy richtig anwenden
Die Verwendung von Proxys kann manchmal schwierig sein. Es ist sinnvoll, im Zweifel die oben genannten Proxy-Typen auszuprobieren, um herauszufinden, ob sie in Ihrem Fall funktionieren.
5.1.17. GPS
Der  GPS Reiter hilft Ihnen bei der Konfiguration der Verbindungen mit GPS-Geräten und dem Einlesen von GPS-Daten. Er bietet auch Einstellungen für GPS-Tracking und Daten-Digitalisierung.
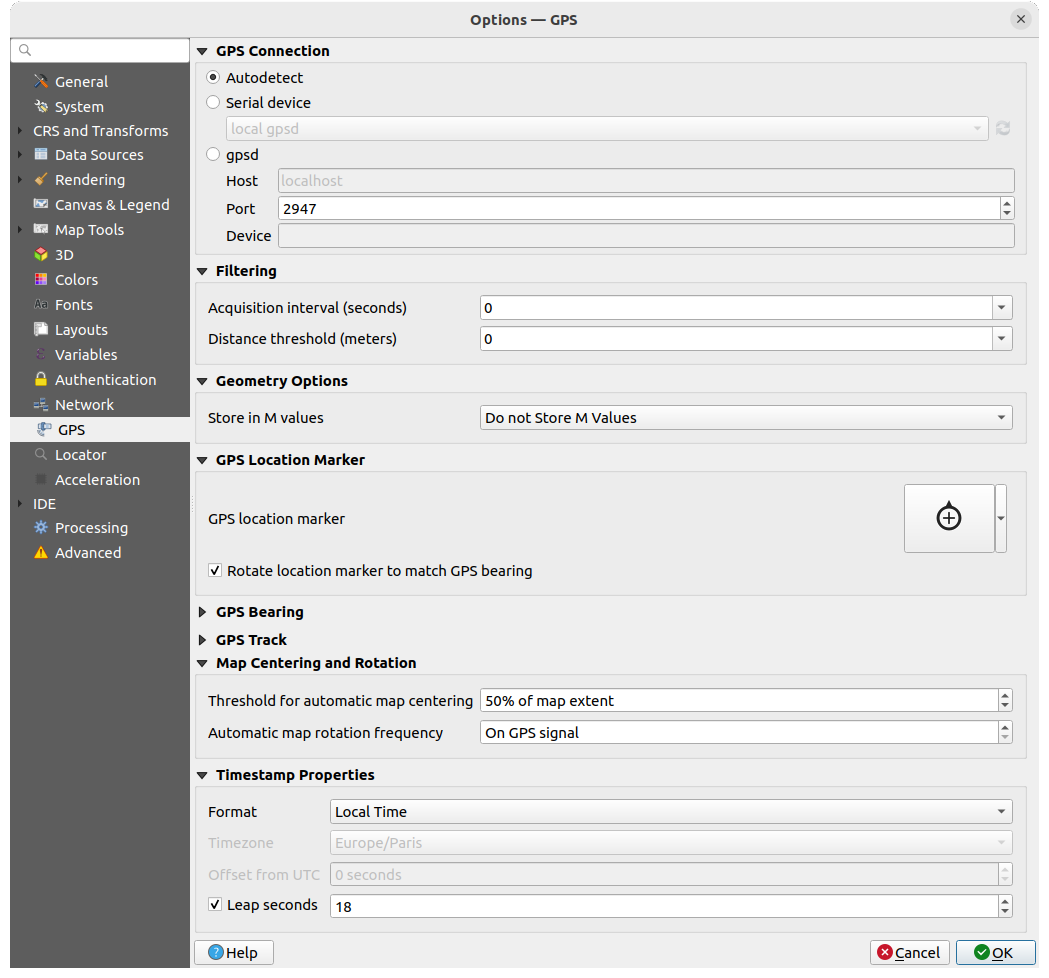
Abb. 5.24 GPS
Es gibt die folgenden Optionen:
GPS-Verbindungen bietet verschiedene Möglichkeiten, das Gerät mit QGIS zu verbinden:
- Automatisch feststellen
- Serielles Gerät erfordert ein Neuladen, wenn ein neues GPS-Gerät angeschlossen wird.
- gpsd: Wählen Sie den Host und den Port aus, mit denen Ihr GPS verbunden ist; Sie können auch einen Namen für das Gerät eingeben.
Im Falle von Verbindungsproblemen können Sie versuchen, die Verbindungsart zu wechseln.
Filterung: Sie können einen Akquisitionsintervall (Sekunden) und/oder eine Abstandsschwelle (Meter) einstellen, um den Cursor auch dann aktiv zu halten, wenn sich der Empfänger in einem statischen Zustand befindet.
Unter Geometrieoptionen können mithilfe von In M-Werte speichern die M-Werten aus den eingebauten GPS-Logging-Tools übernommen werden. Dies gilt sowohl für Features, die aus GPS-Logs digitalisiert wurden, als auch für die In Geopackage/SpatiaLite protokollieren… Funktionalität. Die Möglichkeiten zur Speicherung von M-Werten sind u.a. die Speicherung von Zeitstempeln (in ms seit Epoche), Geschwindigkeit über Grund, Höhen, Peilungen und Genauigkeitskomponenten.
GPS-Positionsmarkierung
Sie können das Symbol für den GPS-Standortmarker konfigurieren, das die aktuelle GPS-Position angibt.
Mit
Positionsmarkierung in GPS-Kurs drehen können Sie auswählen, ob das Markierungssymbol entsprechend der GPS-Richtung gedreht werden soll.
GPS-Kurs:
Sie können einen Kurslinienstil unter der Verwendung der QGIS Liniensymboleigenschaften konfigurieren.
Wenn die Option
Richtung aus Reiserichtung berechnen aktiviert ist, wird die vom GPS-Gerät gemeldete Peilung ignoriert und die Peilung wird stattdessen anhand des Winkels zwischen den beiden vorherigen GPS-Positionen berechnet.
Unter GPS-Spur können Sie ein Symbol für den Spurlinienstil setzen.
Im Bereich Kartenzentrierung und -drehung können sie festlegen, wann die Kartenansicht aktualisiert wird:
Schwelle für automatische Kartenzentrierung: definiert die minimale Abweichung der GPS-Position von der Kartenmitte, um eine automatische Kartenzentrierung auszulösen.
Frequenz der automatischen Kartendrehung: legt fest, wie oft die Karte gedreht wird, um mit der GPS-Peilung übereinzustimmen; dies kann für eine benutzerdefinierte Dauer (in Sekunden) oder bei GPS-Signal erfolgen.
Unter Zeitstempeleigenschaften können sie konfigurieren, wie Zeitwerte in den Daten angezeigt und gespeichert werden. Die Einstellungen umfassen das Format, für welches es die folgenden Optionen gibt:
Lokale Zeit
UTC
UTC mit Versatz: damit ist es möglich, Sommerzeitverschiebungen oder anderen komplexen Zeitzonenproblemen zu berücksichtigen
Zeitzone: es kann eine bestimmte Zeitzone ausgewählt werden
Mit der Option Schaltsekunde können die Zeiten korrigiert werden, indem die Sekunden zum GPS-Zeitstempel addiert werden.
5.1.17.1. GPSBabel
Mit GPSBabel können Wegpunkte, Tracks und Routen zwischen gängigen GPS-Empfängern wie Garmin oder Magellan und Kartenprogrammen wie Google Earth oder Basecamp konvertiert werden. Von GPSBabel werden sehr viele GPS-Empfänger und Programme unterstützt. QGIS greift auf die GPSBabel Datenbank zurück, um mit den Geräten zu kommunizieren und die Daten zu bearbeiten.
Einzelheiten zur Vorgehensweise finden Sie unter Laden auf oder von einem Gerät.
5.1.18. Suche
Auf dem Suche Reiter können Sie die <locator_bar> konfigurieren, die sich unten in der Statusleiste befindet. Es gibt die folgenden Standardfilter, für welche Sie verschiedene Einstellungen (s.u.) vornehmen können (in Klammern jeweils der Präfix):
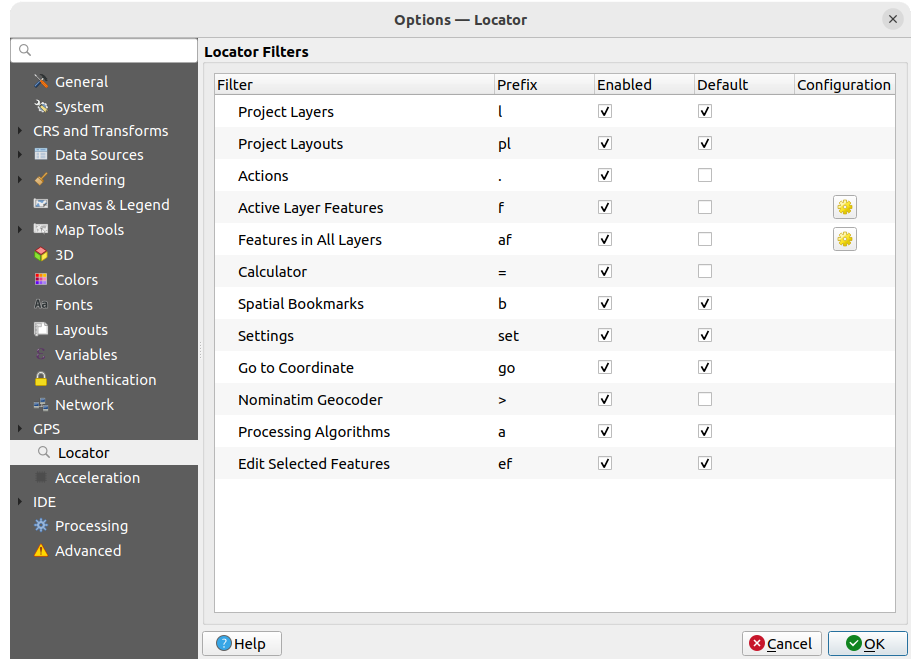
Abb. 5.25 Suche
Projektlayer (
l): sucht einen Layer im Layer Bedienfeld und wählt ihn aus.Projektlayouts (
pl): findet und öffnet ein Drucklayout.Aktionen (
.): findet und führt eine QGIS-Aktion aus; Aktionen können jedes Werkzeug oder Menü in QGIS sein, z.B. auch das Aktivieren eines Bedienfeldes.Objekte des aktiven Layers (
f): sucht nach übereinstimmenden Attributen in allen Feldern des aktiven Layers und zoomt dann auf das ausgewählte Objekt. Drücken Sie am Ende der Zeile, um die Anzahl der maximal angezeigten Ergebnisse einzustellen.
Objekte in allen Layern (
af): sucht nach übereinstimmenden Attributen in allen Feldern aller durchsuchbarer Layer und zoomt dann auf das ausgewählte Objekt. Drücken Sie am Ende der Zeile, um die Anzahl der maximal angezeigten Ergebnisse und die maximale Anzahl von Ergebnissen pro Layer einzustellen.Rechner (
=): ermöglicht die Evaluation eines beliebigen QGIS-Ausdrucks und bietet die Möglichkeit, das Ergebnis in die Zwischenablage zu kopieren, wenn es gültig ist.Räumliche Lesezeichen (
b): sucht in den räumlichen Lesezeichen und zoomt dann auf den entsprechenden Bereich.Einstellungen (
set): durchsucht und öffnet projekt- und anwendungsweite Eigenschaftsdialoge.Zu Koordianten gehen (
go): schwenkt die Kartenansicht zu einem Punkt, der angegeben wird durch x- und y-Koordinaten (getrennt durch Komma oder Leerzeichen) oder eine formatierte URL (z.B. OpenStreetMap, Leaflet, OpenLayer, Google Maps, …). Die Koordinaten werden in WGS 84 (epsg:4326) und/oder im KBS der Karte erwartet.Nominatim Geocoder (
>): geocodes using the Nominatim geocoding service of the OpenStreetMap Foundation. Press to limit results to one or more countries using list of country codes.
This helps narrow down the search to specific countries, avoiding ambiguous results from other locations.
For example, entering DEorDE,FRrestricts results to Germany or Germany and France, respectively.Verarbeitungsalgorithmen (
a): durchsucht die Verarbeitungsalgorithmen und öffnet den entsprechenden Dialog.Ausgewählte Objekte bearbeiten (
ef): bietet Schnellzugriff auf kompatible insitu Verarbeitungsalgorithmen des aktiven Layers.
Im Dialog können Sie:
den Filter anpassen mit Prefix, d. h. das Schlüsselwort, mit dem der Filter ausgelöst werden soll.
Festlegen, ob der Filter Eingeschaltet ist: der Filter kann bei der Suche verwendet werden und eine Verknüpfung ist im Menü der Suchleiste verfügbar.
Voreinstellung aktivieren/deaktivieren: Eine Suche, bei der kein Filter-Präfix vorangestellt wird, liefert nur Ergebnisse aus den Kategorien, bei denen hier ‚Voreinstellung‘ aktiviert ist.
Einige Filter bieten die Möglichkeit, die Anzahl der Ergebnisse einer Suche zu begrenzen.
Der Umfang der Standard-Suchleisten-Filter kann durch Plugins erweitert werden, z.B. für OSM-Nominatim-Suchen, direkte Datenbanksuchen, Layer-Katalog-Suchen, usw.
5.1.19. Beschleunigung
OpenCL-Beschleunigungseinstellungen.
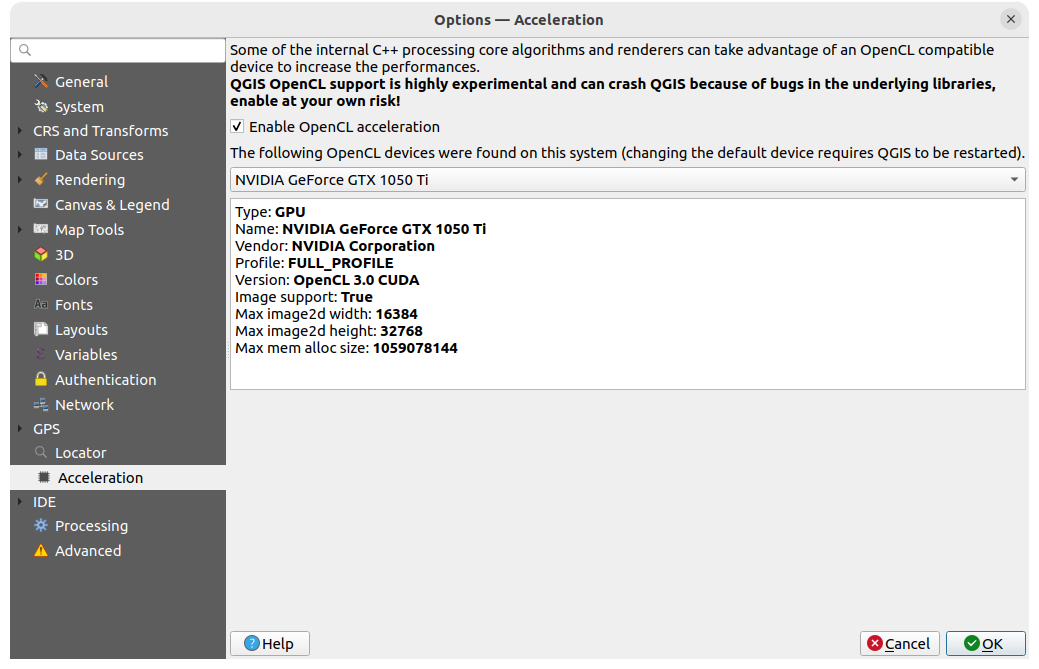
Abb. 5.26 Beschleunigung
Abhängig von Ihrer Hard- und Software müssen Sie möglicherweise zusätzliche Bibliotheken installieren, um die OpenCL-Beschleunigung aktivieren zu können.
5.1.20. IDE
Unter GitHub-Zugriffstoken können Sie ein persönliches Token generieren, mit dem Sie Codeausschnitte aus dem Python-Code-Editor heraus teilen können. Weitere Details zur GitHub-Authentifizierung
5.1.20.1. Code-Editor
Auf dem  Code Editor Reiter können Sie das Aussehen und Verhalten der Code-Editor-Fenster (interaktive Python-Konsole und -Editor, Ausdrucksgenerator, Funktions-Editor, …) steuern.
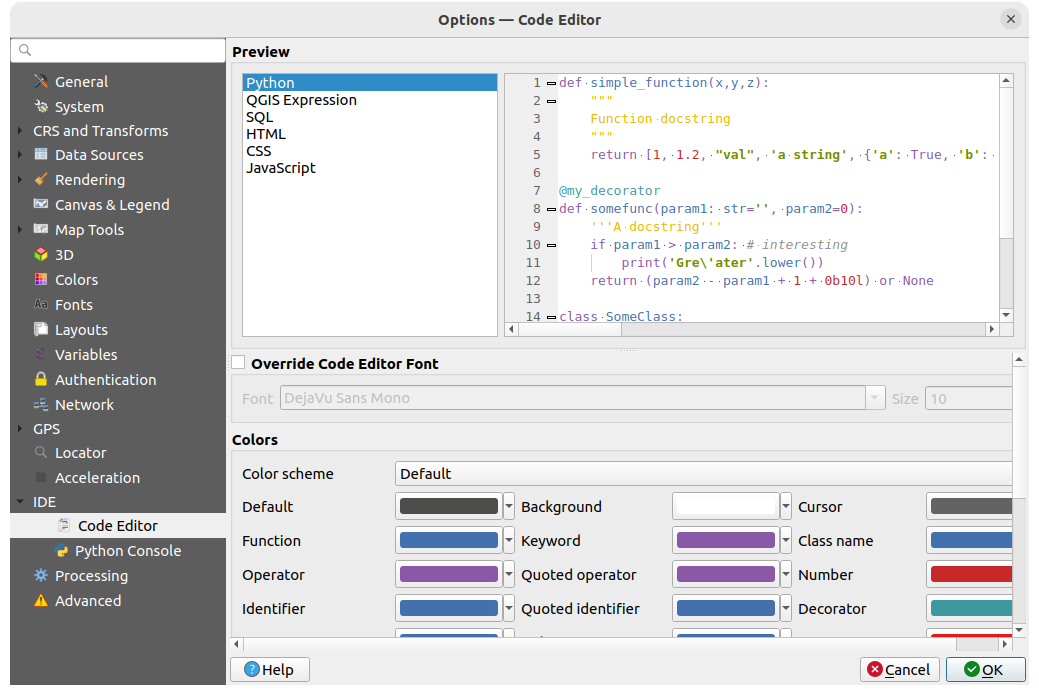
Abb. 5.27 Code-Editor
Am oberen Rand des Reiters bietet ein Fenster eine Live-Vorschau der aktuellen Einstellungen in verschiedenen Programmiersprachen (Python, QGIS-Expression, HTML, SQL, JavaScript).
Aktivieren Sie Code-Editorschriftart übersteuern, um die Schriftart und die Size zu ändern.
Im Bereich Farben haben Sie die folgenden Einstellungsmöglichkeiten:
Wählen Sie ein Farbschema: Vordefinierte Schemata sind
Voreinstellungen,Solarized (Dunkel)undSolarized (Hell). EinBenutzerdefiniertesSchemata wird aktiviert, sobald Sie eine Farbe ändern und kann durch Auswahl eines vordefinierten Schemas zurückgesetzt werden.Ändern Sie die Farbe für jedes Element beim Schreiben von Code, z.B. für Kommentare, Anführungszeichen, Funktionen, Hintergrund, usw.
5.1.20.2. Python
Die Einstellungen unter  Python helfen Ihnen bei der Verwaltung und Steuerung des Verhaltens der Python-Editoren (interaktive Konsole, Code-Editor, Projektmakros, benutzerdefinierte Ausdrücke, …). Diese Einstellungen können auch über die Optionen…-Schaltfläche an den folgenden Stellen aufgerufen werden:
der Python-Konsole Werkzeugleiste,
über das Kontextmenü der Python-Konsole,
über das Kontextmenü des Code-Editors.
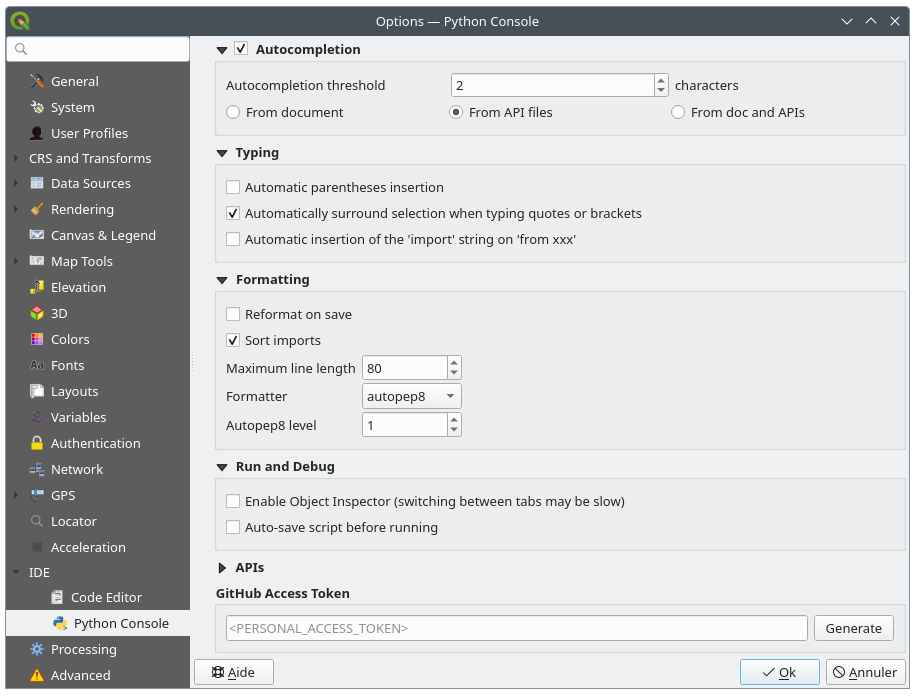
Abb. 5.28 Python
Es gibt die folgenden Optionen:
- Autocompletion: Enables code completion. You can get
autocompletion from the current document, the installed API files or both.
Autocompletion threshold: Sets the threshold for displaying the autocompletion list (in number of characters)
Tippen
- Automatisch Klammern einfügen: Wenn kein Text ausgewählt ist, wird bei der Eingabe eines öffnenden Zeichens (Klammern, Anführungszeichen, eckige Klammern, …) das passende schließende Zeichen direkt hinter dem Cursor eingefügt. Beachten Sie, dass dieses Verhalten deaktiviert ist, wenn sich der aktuelle Cursor innerhalb einer Zeichenfolge oder eines Kommentars befindet.
- Auswahl automatisch beim Tippen von Anführungszeichen oder Klammern umschließen: Wenn ein öffnendes Zeichen eingegeben wird, wird der ausgewählte Text in das öffnende/schließende Paar eingeschlossen. Die Auswahl bleibt erhalten, sodass es möglich ist, ein ausgewähltes Wort zu zitieren und es in Klammern zu setzen, indem man einfach
"und dann(eingibt.Sonderfall für mehrzeilige Auswahl mit Anführungszeichen und doppelten Anführungszeichen: Auswahl wird in dreifache einfache/doppelte Anführungszeichen eingeschlossen.
- Automatisches Einfügen der Zeichenkette ‚import‘ bei ‚from xxx‘: Aktiviert das Einfügen von ‚import‘ bei der Angabe von Importen.
Contextual Help (F1) provides options to control QGIS behavior when requesting help on a PyQGIS or Qt object in a Python code sample. When pressing F1, QGIS will open the API page (or a search results page) matching:
the selected text if any OR
the word at the mouse position (if
F1 works on hovered words is enabled) ORthe word at the text cursor position
This works for both Qt and PyQGIS API documentation. The page is opened either in QGIS, as an Embedded webview (developer tools), or in the Default system web browser.
unter Formatierung können Sie Werkzeuge einstellen, um den von Ihnen geschriebenen Code automatisch zu formatieren:
- Beim Speichern neuformatieren: Formatierung wird unmittelbar vor dem Speichern des Codes angewendet
- Importe sortieren: sortiert ‚import‘-Anweisungen unter Verwendung der isort-Bibliothek
Maximale Zeilenlänge: steuert, wie der Formatierer die Zeilen umbricht, und steuert das Editor-Lineal
Formatierer: unterstützte Werkzeuge sind autopep8 und black, mit jeweils eigenen Option:
Autopep8-Stufe - weitere Einzelheiten unter „Autopep8 advanced usage <https://pypi.org/project/autopep8/#more-advanced-usage>“.
- Anführungszeichen normieren: ersetzt alle einfachen Anführungszeichen durch doppelte Anführungszeichen, wenn möglich
Ausführen und Fehler suchen
- Objektinspektor einschalten (Umschaltung zwischen Reitern kann langsam sein)
- Skript vor Ausführung automatisch speichern: Speichert das Skript automatisch bei der Ausführung. Bei dieser Aktion wird eine temporäre Datei (im Systemverzeichnis) gespeichert, die nach der Ausführung automatisch gelöscht wird.
Under APIs, you can specify which APIs your code should rely on:
- Using preloaded APIs file: You can choose if you would
like to use the preloaded API files. By default, supported APIs are:
Python
PyQGIS
PyQt
QScintilla2
osgeo-gdal-ogr
osgeo-geos
You can also choose to add specific API files.
- Vorbereitete API-Dateien benutzen: Wenn aktiviert, wird die gewählte
*.pap-Datei für die Code-Vervollständigung verwendet. Um eine vorbereitete API-Datei zu generieren, müssen Sie mindestens eine*.api-Datei laden und diese dann durch Anklicken der Schaltfläche Compile APIs… kompilieren.
Die Gruppe Externer Editor ermöglicht es Ihnen, Befehlszeilenanweisungen zum Starten eines externen Python-Code-Editors unter Angabe eines Dateinamens, einer Zeilen- und Spaltennummer zu geben. Wenn dieses Feld leer ist, wird der Standard-Systemeditor verwendet.
5.1.21. Verarbeitung
Die Registerkarte  Verarbeitung enthält allgemeine Einstellungen für Werkzeuge und Datenanbieter, die im QGIS-Verarbeitungsumgebung verwendet werden. Weitere Informationen finden Sie unter Konfigurieren der Verarbeitungsumgebung.
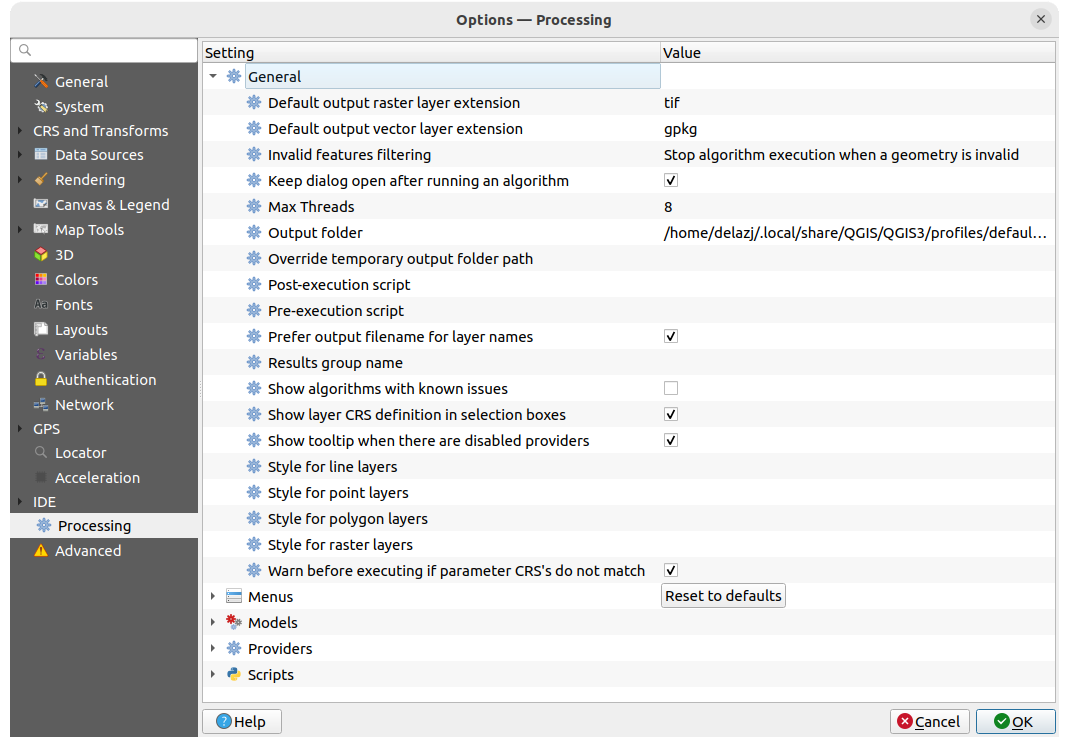
Abb. 5.29 Verarbeitung
5.1.22. Erweitert
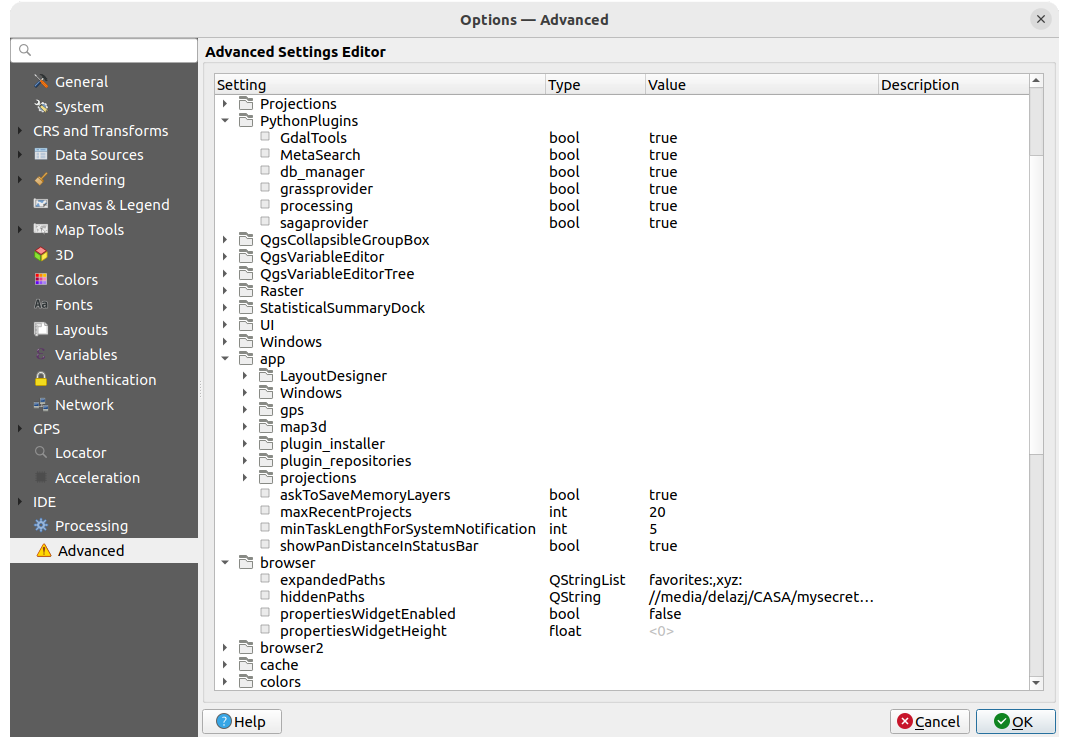
Abb. 5.30 Erweitert
Alle Einstellungen in Bezug auf QGIS (Benutzeroberfläche, Werkzeuge, Datenanbieter, Verarbeitungskonfigurationen, Standardwerte und -pfade, Plugin-Optionen, Ausdrücke, Geometrieprüfungen…) werden in der Datei QGIS/QGIS3.ini im Verzeichnis für das aktuelle Benutzerprofil gespeichert. Durch das Kopieren und Einfügen dieser Datei können die Einstellungen auf anderen Installationen übertragen werden.
Der Reiter Erweitert bietet die Möglichkeit, diese Einstellungen über die Erweiterte Einstellungsbearbeitung zu verwalten. Nachdem Sie bestätigt haben, vorsichtig zu sein, werden in dem Bereich alle vorhandenen Einstellungen angezeigt und Sie können deren Werte bearbeiten. Wenn Sie mit der rechten Maustaste auf eine Einstellung oder eine Gruppe klicken, können Sie sie löschen (um eine Einstellung oder Gruppe hinzuzufügen, müssen Sie die Datei QGIS3.ini bearbeiten). Änderungen werden automatisch in der Datei QGIS3.ini gespeichert.
Warnung
Verwenden Sie die Erweiterte Einstellungsbearbeitung nicht leichtfertig
Bitte seien Sie vorsichtig beim Ändern von Elementen in diesem Dialog, da die Änderungen sofort übernommen werden. Änderungen an Werten, über deren Funktion Sie sich nicht ganz sicher sind, können Ihre QGIS-Installation unbrauchbar machen!
5.2. Arbeiten mit Benutzerprofilen
5.2.1. Das Konzept
Das Menü bietet Funktionen zum Einrichten und Aufrufen von verschiedenen Benutzerprofilen. Ein Benutzerprofil ist eine standardisierte Anwendungskonfiguration, mit der die folgenden Einstellungen zusammen in einem Ordner gespeichert werden können:
Alle Einstellungen Optionen, einschließlich Gebietsschema, Projektionen, Authentifizierungseinstellungen, Farbpaletten, Tastaturkürzel…
GUI-Konfigurationen und :ref:`Anpassungen <sec_customization> `
Grid-Dateien und andere Projektions-Hilfsdateien, die für die Datentransformation installiert würden
Installierte Plugins und ihre Konfigurationen
Projektvorlagen und der Verlauf der gespeicherten Projekte mit Bildvorschau
Verarbeitungs-Einstellungen, Log-ins, Skripte, Modelle
Standardmäßig gibt es in QGIS nur ein Benutzerprofil namens default. Sie können aber so viele Benutzerprofile anlegen, wie Sie möchten:
Klicken Sie auf .
Sie werden aufgefordert, einen Profilnamen anzugeben; dadurch wird auch ein gleichnamiger Ordner unter
~/<UserProfiles>/angelegt, wobei~für das HOME-Verzeichnis steht, das unter Windows standardmäßig
 C:\Users\ <username>ist;und
<UserProfiles>steht für den Hauptordner der Profile, d.h.:
.local/share/QGIS/QGIS3/profiles/-
AppData\Roaming\QGIS\QGIS3\profiles\ 
Library/Application Support/QGIS/QGIS3/profiles/
Der Benutzerprofilordner kann von QGIS aus mit dem Open Active Profile Folder geöffnet werden.
Eine neue Instanz von QGIS mit der Standard Start-Konfiguration wird gestartet. Sie können dann Ihre eigenen Konfigurationen festlegen.
Wenn Sie mindestens ein weiteres Profil angelegt haben, wird der Name des jeweils aktiven Profils in der Titelleiste von QGIS in eckigen Klammern angezeigt.
Da für jedes Benutzerprofil die Einstellungen, Plugins und der Verlauf getrennt gespeichert werden, eignen sich Benutzerprofile sehr gut für unterschiedliche Arbeitsabläufe, Demos, Benutzer desselben Rechners, zum Testen von Einstellungen, usw. Sie können von einem zum anderen wechseln, indem Sie im Menü das entsprechende auswählen. Sie können QGIS auch mit einem bestimmten Benutzerprofil über die Befehlszeile starten.
Tipp
Führen Sie QGIS unter einem neuen Benutzerprofil aus, um die Fehlerpersistenz zu überprüfen
Fehler, die bei Funktionen in QGIS auftreten können, können mit Konflikten bei den Einstellungen zusammenhängen. Wenn Sie QGIS unter einem anderen Benutzerprofil ausführen, können Sie diese Fehler möglicherweise beheben oder die Ursache des Problems überprüfen. Im Allgemeinen empfiehlt es sich, QGIS unter einem neuen Benutzerprofil zu starten, um eine sauberere Konfiguration zu erhalten, und die Befehle erneut auszuführen
Wenn der Fehler Sie daran hindert, ein neues Benutzerprofil über das Menü zu erstellen, haben Sie folgende Möglichkeiten:
Benennen Sie im Datei-Explorer den „beschädigten” Benutzerprofilordner im Ordner
QGIS3/profilesum und starten Sie QGIS neu. Ein neues Standardbenutzerprofil wird erstellt und ausgeführt.Starten Sie QGIS über die Befehlszeile mit dem Profilname-Argument:
qgis-ltr --profile newprofilename
5.2.2. Benutzerprofil einstellen
Standardmäßig öffnet QGIS eine neue Sitzung mit dem Profil der letzten geschlossenen Sitzung. Dies kann, neben anderen Einstellungen, unter  angepasst werden:
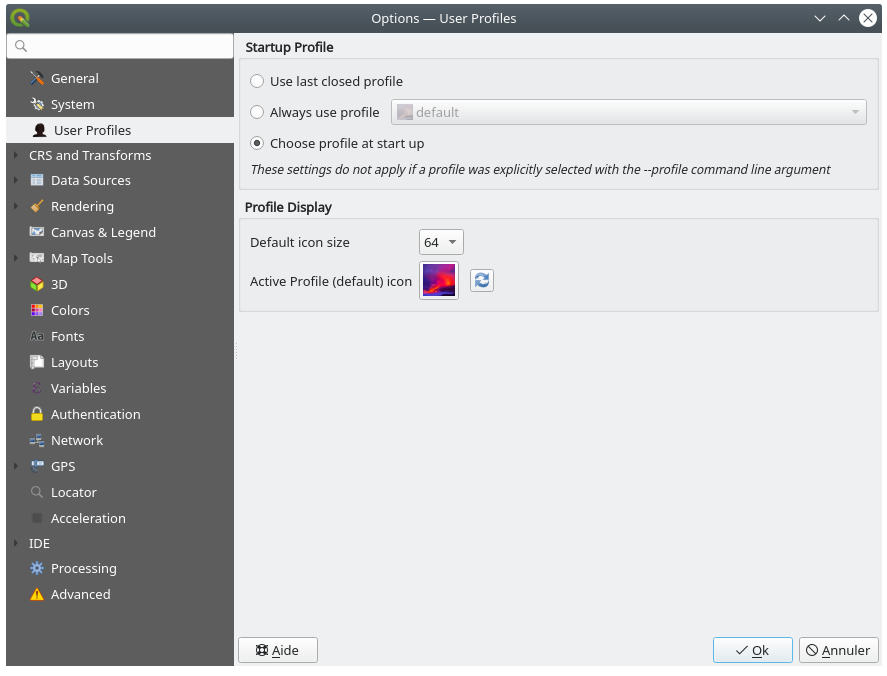
Abb. 5.31 Benutzerprofile-Reiter
Startprofil: gibt das Benutzerprofil an, das beim Start einer QGIS-Sitzung verwendet werden soll. Die Optionen sind:
Letztes gewähltes Profil verwenden
ein bestimmtes Benutzerprofil, das aus dem Dropdown-Menü Immer Profil verwenden auszuwählen ist
Profil beim Starten wählen: Öffnet beim Start von QGIS das Dialogfeld Benutzerprofilauswahl, mit einer Liste der verfügbaren Benutzerprofile. Doppelklicken Sie auf einen Eintrag oder wählen Sie ein Profil und drücken Sie OK, um dieses Benutzerprofil für die Startsitzung zu verwenden. Mit Neues Profil hinzufügen können Sie ein Profil direkt neu erstellt und damit die Sitzung starten.
Im Bereich Profilanzeige können Sie:
Die Größe der Symbole einstellen, die bei der Auswahl eines Profils im Dialogfeld Benutzerprofilauswahl angezeigt werden.
Ein Symbol auswählen, das neben dem jeweiligen Profil im Menü oder im Dialog Benutzerprofilauswahl angezeigt wird. Drücken Sie
 Icon zurücksetzen, um benutzerdefinierte Änderungen zu entfernen.
5.3. Projekteigenschaften
Im Eigenschaftsfenster des Projekts unter können Sie projektspezifische Optionen einstellen. Die Einstellungen überschreiben ggf. ihre Entsprechung im Dialog Optionen.
5.3.1. Allgemein
Im Bereich Allgemeine Einstellungen des Reiters  Allgemein haben Sie die folgenden Optionen:
Den Speicherort der Projektdatei einsehen.
Den Ordner für das Projektheimatverzeichnis festlegen. Der Pfad kann relativ zu dem Ordner der Projektdatei (geben Sie ihn ein) oder absolut sein. Das Projektverzeichnis kann zum Speichern von Daten und anderen für das Projekt nützlichen Inhalten verwendet werden. Dies ist praktisch, wenn Datensatz und Projektdateien nicht am selben Ort gespeichert sind. Wenn das Feld Projektheimatverzeichnis nicht ausgefüllt ist, wird standardmäßig der Ordner der Projektdatei verwendet.
Einen Titel für das Projekt vergeben.
Die Auswahlfarbe für markierte Objekte festlegen.
Eine Hintergrundfarbe einstellen, die in der Kartenansicht verwendet wird.
Sie können festlegen, ob der Pfad zu den Layern im Projekt als absoluter (vollständiger) oder als relativer Pfad zum Speicherort der Projektdatei gespeichert werden soll. Ein relativer Pfad ist z.B. dann sinnvoll, wenn Layer und/oder Projektdateien verschoben werden soll oder wenn der Zugriff auf das Projekt von verschiedenen Computern erfolgt.
Sie können auswählen, dass versucht werden soll, Artefakte bei der Darstellung von Kartenkacheln zu vermeiden. Beachten Sie, dass die Aktivierung dieser Option zu Leistungseinbußen führen kann.
Attributtabellenfenster und Docks zwischen Sitzungen merken: Wenn diese Option aktiviert ist, werden alle geöffneten Attributtabellen (als Fenster oder Dock) gespeichert und beim Laden des Projekts direkt wiederhergestellt. Dies kann Arbeitsabläufe erleichtern, wenn Sie in einem Projekt mit einer bestimmten Konfiguration der Attributtabellen arbeiten und das erneute Einrichten aufwendig wäre.
Die Berechnung von Flächen und Entfernungen ist eine häufige Aufgabe im GIS. Die ermittelten Werte sind aber abhängig von den zugrundeliegenden Einstellungen. Im Bereich Messungen können Sie diese Parameter steuern. Sie können auswählen:
das Ellipsoid, auf dem alle Entfernungs-, Flächen- und Winkelberechnungen basieren; es kann sein:
None/Planimetric: die zurückgegebenen Werte sind in diesem Fall kartesische Maße. Diese Option kann als Standard für neue Projekte über das Menü
gesetzt werden.Angepasst: Sie müssen die Werte für die Hauptachse und die Nebenachse selbst festlegen.
oder aus einer Liste mit vordefinierten Ellipsoiden ausgewählt werden (Clarke 1866, Clarke 1880 IGN, New International 1967, WGS 84…).
the Units for distance measurements for length and perimeter, and the Units for area measurements. These settings default to their corresponding global options and can be manually changed for the current project. They are used in:
dem Aktualisierungsfeld in Attributtabellen
Feldrechner Berechnungen
Objekte abfragen Werkzeug : Werte für Länge, Umfang und Fläche
Bemerkung
Um sicherzustellen, dass die Maßeinheiten (für Entfernung und Fläche) immer die Einheiten des aktuellen KBS des Projekts widerspiegeln, wählen Sie für diese Optionen Karteneinheiten.
the Scale calculation method: when working on large map extents, especially with geographic CRS, the scale bar may not reflect actual distance measurement depending on the latitude at which the calculation is done. This setting helps you define the area you want the calculation to be taken from:
Average top, middle and bottom scales
Calculate along top of map
Calculate along middle of map (the default)
Calculate along bottom of map
Always calculate at equator, regardless of the actual visible map extent. It can be used to provide a consistent, static scale for maps in geographic reference systems, regardless of the latitudes actually visible in the map (permitting consistent appearance of these maps when rendering relies on scale based visibility or calculations). Otherwise a project in e.g.
EPSG:4326which uses scale based visibility of layers and symbols will see layers and features „randomly“ disappear as the map is panned, even though you have not zoomed in or out of the map.Bemerkung
This method is only applicable when calculating scales with a degree based reference system, and while it ensures that the scale remains constant and does not change as the map is panned, it will calculate misleading scales when the map extent is not close to the equator.
Changing the scale calculation method has the following impacts:
New layout scale bars will default to the project’s scale calculation method
The scale calculations for the status bar widget and map renders will be changed (including flow on impacts like the value of
@map_scalevariable, scale based visibility of layers and symbols)This also affects QGIS server map rendering
Processing algorithms which render maps will respect the project’s scale calculation method
Bemerkung
Symbology sizes in map units are NOT affected by this setting.
Im Bereich Koordinaten- und Kursanzeige haben Sie die Möglichkeit, die Anzeige für die folgenden Werte anzupassen:
Koordinaten, die in der QGIS-Statusleiste und im Bereich Abgeleitet in den Ergebnissen des
Objekte abfragen Werkzeugs angezeigt werden,Peilungswerte, die in der Statusleiste oder bei Abfragen mit dem
Kurs Messen Werkzeug angezeigt werden.
Folgende Parameter sind verfügbar:
Koordianten anzeigen in:
Karteneinheiten (Meter), basierend auf dem für das Projekt eingestellten KBS„Kartengeografisch (Grad)“: basiert auf dem Projekt-KBS, wenn es sich um einen geografischen Typ handelt, andernfalls wird das zugehörige geografische KBS verwendet. Dies ist beispielsweise für nicht zur Erde gehörende Himmelskörper hilfreich.
Benutzerprojektionseinheit: ermöglicht es, jedes beliebige KBS für die Anzeige der Koordinaten zu verwenden
Im Feld Koordinaten KBS wird, je nach oben gewähltem Modus, das KBS verwendete KBS angezeigt oder Sie können eins auswählen.
Unter Koordinatenformat können Sie mit Ändern…`einstellen, ob die Werte in ``Dezimalgrad`,
Grad, MinutenoderGrad, Minuten, Sekundenangezeigt werden sollen. Darüber hinaus haben sie folgende Optionen:- Richtungsendung anzeigen
- Führende Nullen für Minuten und Sekunden anzeigen
- Führende Nullen bei Grad anzeigen
- Nullen am Ende anzeigen
Koordinatengenauigkeit: die Anzahl der Dezimalstellen kann automatisch (abgeleitet vom Typ des KBS) oder manuell eingestellt werden
Koordinatenreihenfolge: Sie können wählen, ob die Koordinaten in der nativen Reihenfolge des KBS (
Voreinstellung) angezeigt werden sollen, in der ReihenfolgeOstwert, Nordwert (Länge, Breite)oder in der ReihenfolgeNordwert, Ostwert (Breite, Länge).Unter Kursformat können Sie mit der Schaltfläche Anpassen einstellen, ob der Kurs von
0 bis 180° mit O/W-Zusatz, von-180 bis +180°oder von0 bis 360°angezeigt wird. Darüber hinaus können sie Anzahl der Dezimalstellen festlegen und die Option Nullen am Ende anzeigen auswählen.
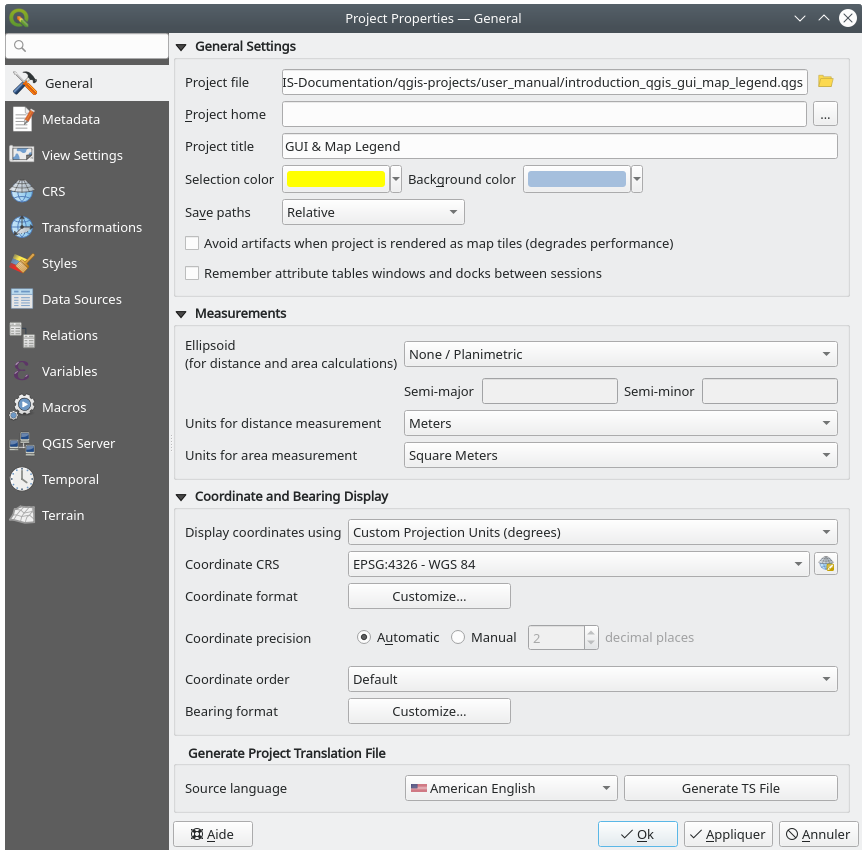
Abb. 5.32 Der Allgemein-Reiter der Projekteigenschaften
5.3.2. Metadaten
The  Metadata tab provides you with options
to create and edit a metadata report on your project.
See Metadaten for more information.
Metadata tab provides you with options
to create and edit a metadata report on your project.
See Metadaten for more information.
5.3.3. Ansichtseinstellungen
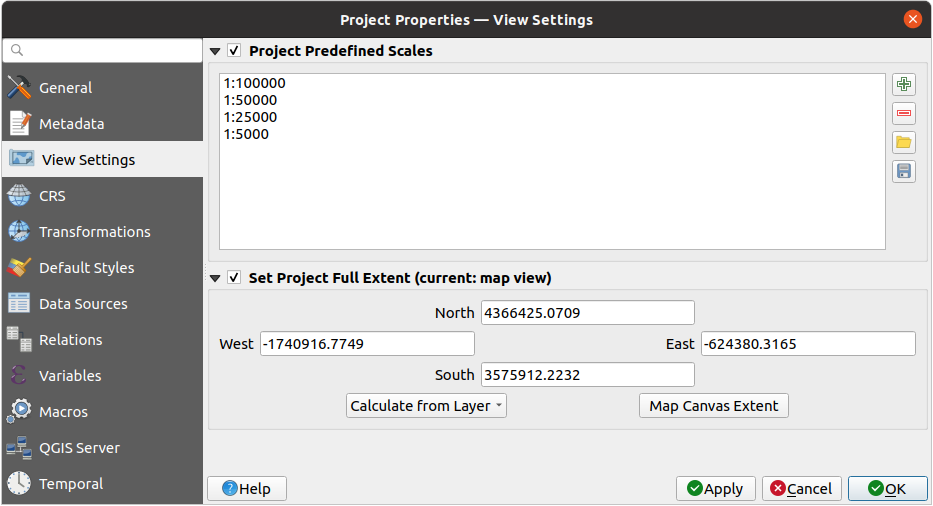
Abb. 5.33 Der Reiter Ansichtseinstellungen der Projekteigenschaften
Der Reiter  Ansichtseinstellungen bietet Möglichkeiten zur Steuerung der Kartenansicht des Projekts. Sie haben die folgenden Optionen:
Vordefinierte Projektmaßstäbe: eine Liste von Maßstäbe, die in Maßstabs-Drop-Down-Listen angezeigt werden sollen, wie z.B. im Maßstab der Statusleiste oder den Einstellungen einer zweiten Kartenansicht. Wenn hier Vordefinierte Projektmaßstäbe aktiviert ist, werden die globalen vordefinierte Maßstäbe überschrieben und nur die hier definierten angezeigt.
Volle Projektausmaße setzen: diese Ausdehnung wird anstelle der Ausdehnung aller Layer beim Zoomen auf die volle Kartenausdehnung (
 ) verwendet. Dies kann genutzt werden, wenn ein Projekt Web-Layer/nationale Layer/globale Layer enthält, das eigentliche Interessengebiet des Projekts jedoch ein kleineres geografisches Gebiet ist. Die Koordinaten für die volle Ausdehnung des Projekts können mit dem Widget extent selector 1 festgelegt werden.
5.3.4. KBS
Bemerkung
Für weitere Informationen darüber, wie QGIS mit Projektionen arbeitet, lesen Sie bitte den entsprechenden Abschnitt unter Arbeiten mit Projektionen.
Auf dem Reiter KBS können Sie das Koordinatenbezugssystem festlegen, das in diesem Projekt verwendet werden soll. Die Optionen sind:
- Kein KBS (oder unbekannte/nicht-Erd-Projektion): Layer werden auf der Grundlage ihrer ursprünglichen, also nicht projizierten, Koordinaten gezeichnet
Ein vorhandenes Koordinatenbezugssystem, das geografisch, projiziert oder benutzerdefiniert sein kann. Dem Projekt hinzugefügte Layer werden on-the-fly in dieses KBS übersetzt, um sie unabhängig von ihrem ursprünglichen KBS zu überlagern.
5.3.5. Transformationen
Auf dem Reiter „Transformationen“ können Sie die Einstellungen für die Reprojektion von Layern steuern, indem Sie die Datentransformationen festlegen, die für das aktuelle Projekt gelten sollen. Die Einstellungen hier haben Vorrang vor den entsprechenden globalen Einstellungen. Siehe Datumstransformationen für weitere Details.
5.3.6. Stile
Unter dem Reiter Stile können Sie Symbole und Farben konfigurieren, die spezifisch für das jeweilige Projekt genutzt werden.
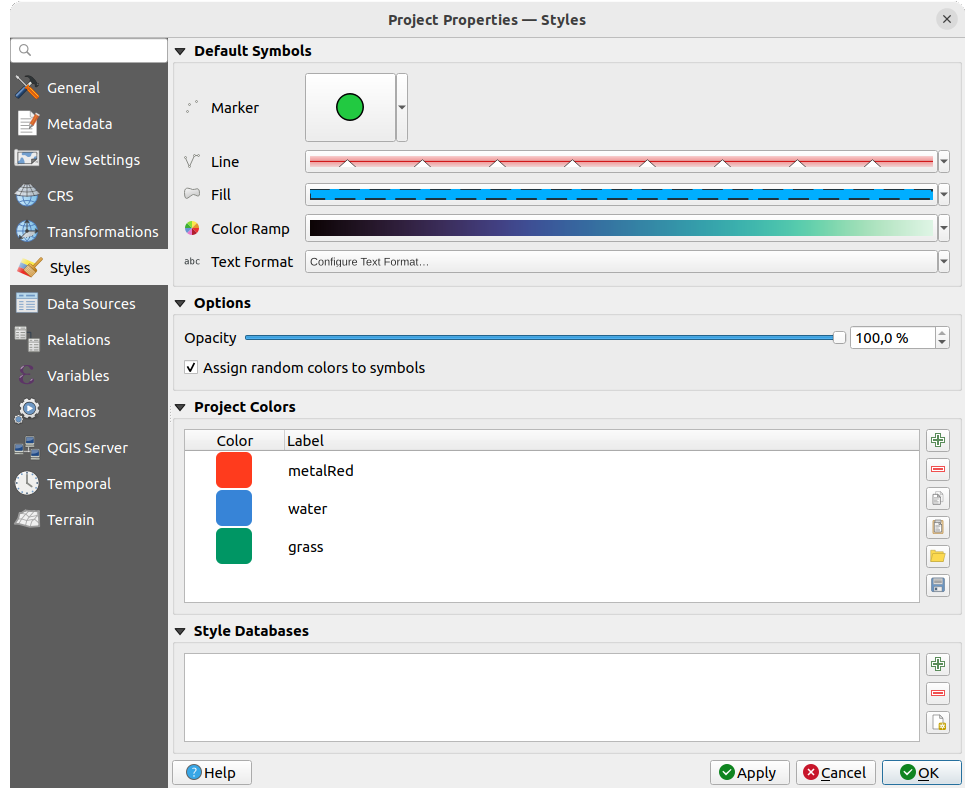
Abb. 5.34 Der Stile-Reiter
5.3.6.1. Vorlagesymbole
Mit der Gruppe Vorlagesymbole können Sie steuern, wie neue Layer im Projekt gezeichnet werden (wenn für sie kein Vorgabestil definiert ist). Sie können Markierung, Linie und Füllung je nach Geometrietyp der Ebene sowie die Standardwerte für Farbverlauf und Textformat (z. B. beim Aktivieren der Beschriftung) festlegen. Alle diese Elemente können über den Eintrag Aktuelles Symbol leeren im entsprechenden Dropdown-Widget zurückgesetzt werden.
5.3.6.2. Symboloptionen
In der Gruppe Symboloptionen können Sie:
Die Deckkraft eines neu hinzugefügten Layers einstellen
Das Kästchen
Den Symbolen zufällige Farben zuordnen aktivieren, damit nicht alle Layer mit derselben Farbe dargestellt werden.
5.3.6.3. Stildatenbanken
Eine Stildatenbank in QGIS ist spezielle Datei zum Speichern von Symbolen, Textformaten und anderen Stilelementen. Sie dient als zentraler Ort, an dem Sie Ihre Symbologieressourcen effizient organisieren und verwalten können. Sie können z. B. eine eigene Stildatenbank für einen bestimmten Kunden erstellen, in der Symbole gespeichert werden, die auf die Bedürfnisse dieses Kunden zugeschnitten sind. Dies gewährleistet einen sauberen und organisierten Ansatz, ohne die Standard-Stil-Datenbank zu überladen. Oder in Mehrbenutzerumgebungen ist es möglich, projektspezifische Stile an einem gemeinsamen Ort zu speichern. Durch die Verknüpfung eines Projekts mit diesen Stilen erhalten alle Benutzer Zugriff auf eine gemeinsame Symbolik, wodurch der manuelle Import oder die Aktualisierung der einzelnen lokalen Stildatenbanken entfällt. Dieser Ansatz ermöglicht es, dass andere Benutzer, die an demselben Projekt arbeiten, sofort nach dem Laden des Projekts Zugang zu allen erforderlichen Symbolen haben.
Im Bereich Stildatenbank können Sie wählen zwischen Hinzufügen oder Entfernen einer Stil-Datenbank oder Sie können eine  Neue Stildatenbank erzeugen. Wenn Sie in diesem Abschnitt eine Stildatenbank hinzufügen oder entfernen, werden die Änderungen automatisch in den
  Symbology Properties übernommen.
5.3.7. Farben
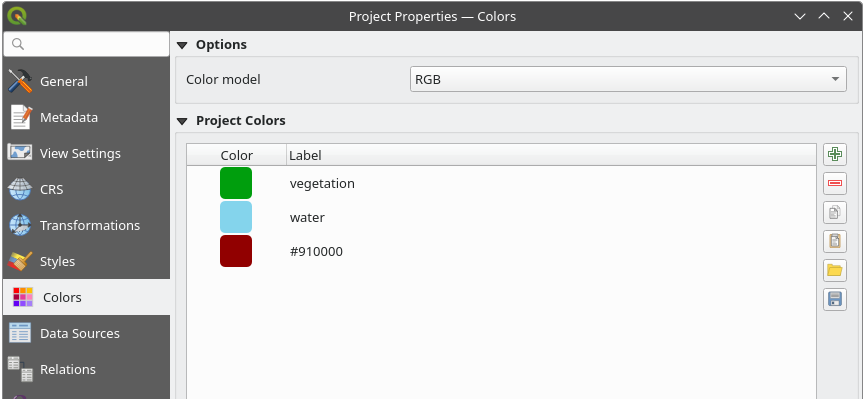
Abb. 5.35 Der Farben-Reiter
Auf dem Reiter  Farben können Sie das Farbmodell auswählen, d. h. ob die Auswahl einer Farbe standardmäßig als
 RGB oder CMYK definiert werden soll. Alle Farben, die in einem anderen als dem hier angegebenen Farbmodell definiert sind, werden beim Exportieren eines Layouts in dieses Farbmodell konvertiert.
Additionally, an option is available for selecting an ICC Profile
which allows you to Load a specific ICC profile that defines the color space
for your project. After you load the ICC profile, you can choose to Save ICC Profile
to a file on disk or to  Remove selected ICC Profile.
Once applied, QGIS will enforce the selected color model to ensure
consistent color representation.
Remove selected ICC Profile.
Once applied, QGIS will enforce the selected color model to ensure
consistent color representation.
Bemerkung
Note that the ICC Profile option will only be visible if QGIS is built with Qt 6.8.0 or higher.
Es gibt auch einen zusätzlichen Abschnitt, in dem Sie spezifische Farben für das laufende Projekt definieren können. Wie bei den globalen Einstellungen für Farben, können Sie:
Eine
Farbe hinzufügen oder eine Farbe entfernenEine
Farbe kopieren oder eine Farbe einfügenDie ganze Farbpalette als
.gplDatei Importieren oder Exportieren.
Doppelklicken Sie auf eine Farbe in der Liste, um sie mit dem Farbauswahl Dialog zu ändern. Mit einem Doppelklick in die Spalte Beschriftung können Sie die Farbe auch benennen bzw. umbenennen.
Diese Liste wird als Projektfarben bezeichnet und bei der Farbauswahl als eigene Palette aufgeführt.
Tipp
Verwenden Sie Projektfarben, um Farbwidgets schnell zuzuweisen und zu aktualisieren
Project colors can be referred to using their label and the color widgets they are used in are bound to them. This means that instead of repeatedly setting the same color for many properties and, to avoid a cumbersome update you can:
Definieren Sie eine Farbe als Projektfarbe
Klicken Sie danach an einer beliebigen Stelle in QGIS, an der Sie diese Farbe verwenden wollen, auf das Feld Datendefinierte Übersteuerung am Ende der Farbauswahlzeile
Bewegen Sie dann den Mauszeiger über den Menüeintrag Farbe und wählen Sie Ihre definierte Projektfarbe aus. Der Eigenschaft wird dann der Ausdruck
project_color('Name_der_Farbe')zugewiesen und die Farbauswahl zeigt die entsprechende Farbe an.Wiederholen Sie die Schritte 2 und 3 für so viele Farben, wie Sie benötigen.
Wenn Sie jetzt die Projektfarbe in den Projekteigenschaften ändern, wird die Änderung an allen Stellen, an denen Sie die Farbe wie oben beschrieben festgelegt haben, automatisch übernommen.
5.3.8. Datenquellen
Auf dem Reiter  Datenquellen stehen die folgenden Optionen zur Verfügung:
Transaktionsmodus, definiert, wie Bearbeitungen an den Datenanbieter gesendet werden:
Lokaler Bearbeitungspuffer: Bearbeitungen werden lokal zwischengespeichert und an den Datenanbieter gesendet, wenn der Layer-Bearbeitungsmodus umgeschaltet oder auf Layeränderungen speichern geklickt wird.
Automatische Transaktionsgruppen: Bei unterstützten Datenquellen (Postgres- und GeoPackage-Datenbanken) wird der Bearbeitungsstatus aller Tabellen, die aus der gleichen Datenbank stammen, synchronisiert und in einer serverseitigen Transaktion ausgeführt. Anstatt Änderungen lokal zu puffern, werden sie direkt an eine Transaktion an die Datenbank gesendet und beim Umschalten des Layer-Bearbeitungsmodus oder beim Klicken auf Layeränderungen speichern nur noch bestätigt.
Gepufferte Transaktionsgruppen: alle bearbeitbaren Layer, egal von welchem Anbieter, werden synchron umgeschaltet und alle Bearbeitungen in einem lokalen Bearbeitungspuffer gespeichert. Das Speichern von Änderungen wird in einer einzigen Transaktion auf allen Layern (pro Anbieter) durchgeführt.
Beachten Sie, dass Sie diese Option nur ändern können, wenn sich kein Layer im Projekt im Bearbeitungsmodus befindet.
- Vorgabewerte auf Anbieterseite auswerten: Beim Hinzufügen neuer Objekte in einer PostgreSQL-Tabelle werden Felder für die Vorgabewertebeschränkung bestehen („constraint“) beim Anlegen des Objekts ausgewertet und ausgefüllt, und nicht erst bei der Übergabe/Speicherung. Das bedeutet, dass z. B. im Attribut-Formular anstelle eines Ausdrucks wie
nextval('serial')der zu erwartende Wert (z.B.25) anzeigt wird. - Bearbeitungsstatus zwischen Sitzungen merken: Wenn diese Option aktiviert ist, werden alle Layer, die beim Schließen und Speichern des Projekts auf bearbeitbar gestellt waren, auch wieder in den Bearbeitungsmodus gesetzt, wenn das Projekt erneut geöffnet wird.
Sie können die Layereigenschaften konfigurieren:
Legen Sie fest (oder deaktivieren Sie), welcher Layer „abfragbar“ ist, d. h. auf das Identifizierungswerkzeug reagiert. Standardmäßig sind Layer abfragbar eingestellt.
Legen Sie fest, ob ein Layer
schreibgeschütztsein soll, was bedeutet, dass er vom Benutzer nicht bearbeitet werden kann, unabhängig von den Möglichkeiten des Datenanbieters. Auch wenn es sich hier um einen schwachen Schutz handelt, da er einfach wieder aufgehoben werden kann, bietet er doch eine schnelle und praktische Möglichkeit, um unbeabsichtigte Änderungen an den Daten zu verhindern.Legen Sie fest, welcher Layer „durchsuchbar“ ist, d. h. mit dem Suchen-Widget abgefragt werden kann. Standardmäßig sind Layer durchsuchbar.
Legen Sie fest, welche Layer als
erforderlichdefiniert sind. Markierte Layer in dieser Liste sind vor versehentlichem Entfernen aus dem Projekt geschützt.Legen Sie fest, welcher Layer als „privat“ gekennzeichnet werden soll, d. h. im :guilabel:„Layer“-Bedienfeld ausgeblendet wird. Dies ist für Zusatzlayer gedacht (Grundkarte, Verknüpfungen, Nachschlagen von Wertbeziehungen, höchstwahrscheinlich nicht-räumliche Layer usw.), die Sie in einem Projekt weiterhin benötigen, die aber nicht die Legendenstruktur und andere Layerauswahl-Tools überladen sollen. Wenn sie als sichtbar eingestellt sind, werden sie weiterhin in der Kartenansicht angezeigt und in der Legende des Drucklayouts gerendert. Verwenden Sie die Option
 :menuselection:„Legende filtern –> Private Ebenen anzeigen“ in der oberen Symbolleiste des :guilabel:„Layer“-Bedienfelds, um sie vorübergehend für Interaktionen zu aktivieren
Darüber hinaus bietet die Tabelle der Layereigenschaften einige nützliche Möglichkeiten:
Sie können mehrere Zellen (nicht Zeilen!) markieren, indem Sie einfach in den Bereich hinter das Kontrollkästchen klicken; wenn Sie jetzt unten auf Auswahl umschalten klicken, wird der Status aller ausgewählten Kontrollkästchen geändert;
Sie können sich in der Liste
Nur räumliche Layer anzeigen lassen;Mit der Funktion
 Layer filtern… können Sie schnell einen gewünschten Layer finden.
Im Bereich Erweiterte Einstellungen können Sie die Option Projekt vertrauen, wenn Datenquelle keine Metadaten hat auswählen (standardmäßig nicht markiert), um das Laden von Projekten zu beschleunigen, indem Datenprüfungen übersprungen werden. Nützlich im QGIS Server Kontext oder in Projekten mit großen Datenbankansichten/materialisierten Ansichten. Die Ausdehnung der Layer wird aus der QGIS Projektdatei gelesen (statt aus den Datenquellen) und bei Verwendung des PostgreSQL Providers wird die Primärschlüssel-Unität für Views und Materialized Views nicht geprüft.
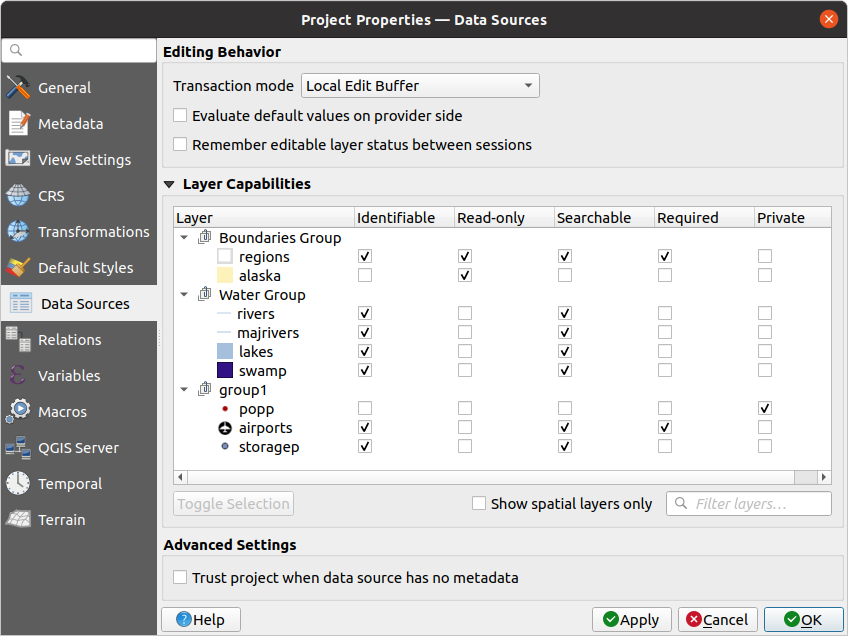
Abb. 5.36 Der Datenquellen Reiter
5.3.9. Beziehungen
Die Registerkarte  Beziehungen dient zur Definition von Beziehungen zwischen Layern. Die Beziehungen können vom Typ 1:1, viele-zu-viele oder polymorph sein. Sie werden im Dialogfeld „Projekteigenschaften“ definiert. Sobald Beziehungen für eine Ebene existieren, listet ein neues Element der Benutzeroberfläche in der Formularansicht (z. B. beim Identifizieren eines Elements und Öffnen seines Formulars) die zugehörigen Entitäten auf. Dies bietet eine leistungsstarke Möglichkeit, um beispielsweise die Inspektionshistorie einer Rohrleitung oder eines Straßenabschnitts darzustellen. Weitere Informationen zur Unterstützung von Beziehungen finden Sie im Abschnitt Festlegung von Beziehungen zwischen mehreren Layern.
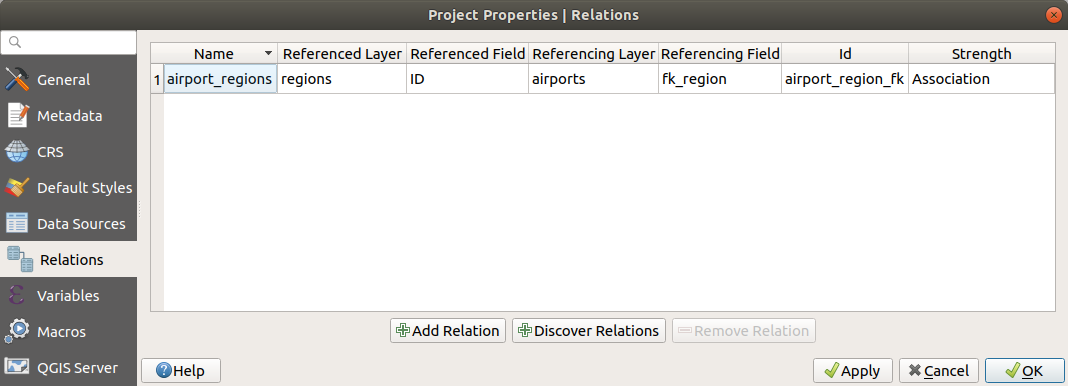
Abb. 5.37 Der Beziehungen-Reiter
5.3.10. Variablen
Der Reiter  Variablen listet alle auf Projektebene verfügbaren Variablen auf (einschließlich aller globaler Variablen). Darüber hinaus können sie hier mit der Schaltfläche eine neue, benutzerdefinierte Variable hinzuzufügen. Wenn Sie eine benutzerdefinierte Variable aus der Liste auswählen, können Sie diese mit der Schaltfläche wieder entfernen. Weitere Informationen zur Verwendung von Variablen finden Sie im Kapitel Allgemeine Werkzeuge im Abschnitt Speichern von Werten in Variablen.
5.3.11. Makros
Der Reiter  Makros dient der Bearbeitung von Python-Makros für das Projekt. Bei neuen Projekten sind standardmäßig drei Makros angelegt, die mit Inhalten gefüllt werden können:
 openProject(), aveProject() und closeProject().
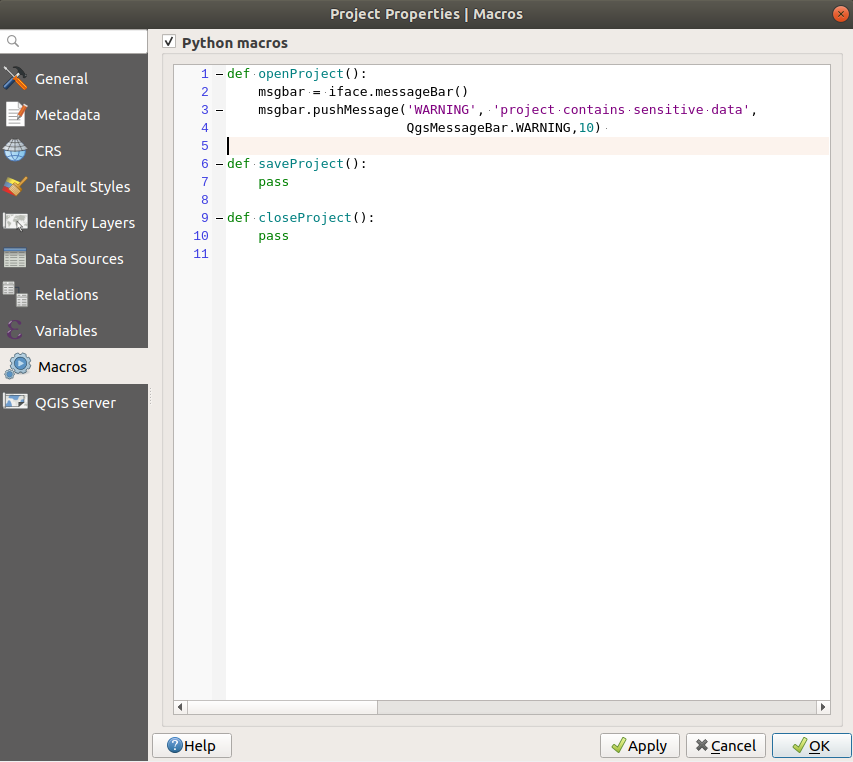
Abb. 5.38 Der Makro Reiter
5.3.12. QGIS Server
Der Reiter QGIS Server ermöglicht es Ihnen, Ihr Projekt zu konfigurieren, wenn es online veröffentlicht werden soll. Hier können Sie Informationen über die WMS- und WFS-Fähigkeiten des QGIS-Servers, den Umfang und die KBS-Einschränkungen festlegen. Weitere Informationen finden Sie im QGIS Server Handbuch im Abschnitt Erstellen von WMS aus dem Projekt und nachfolgende.
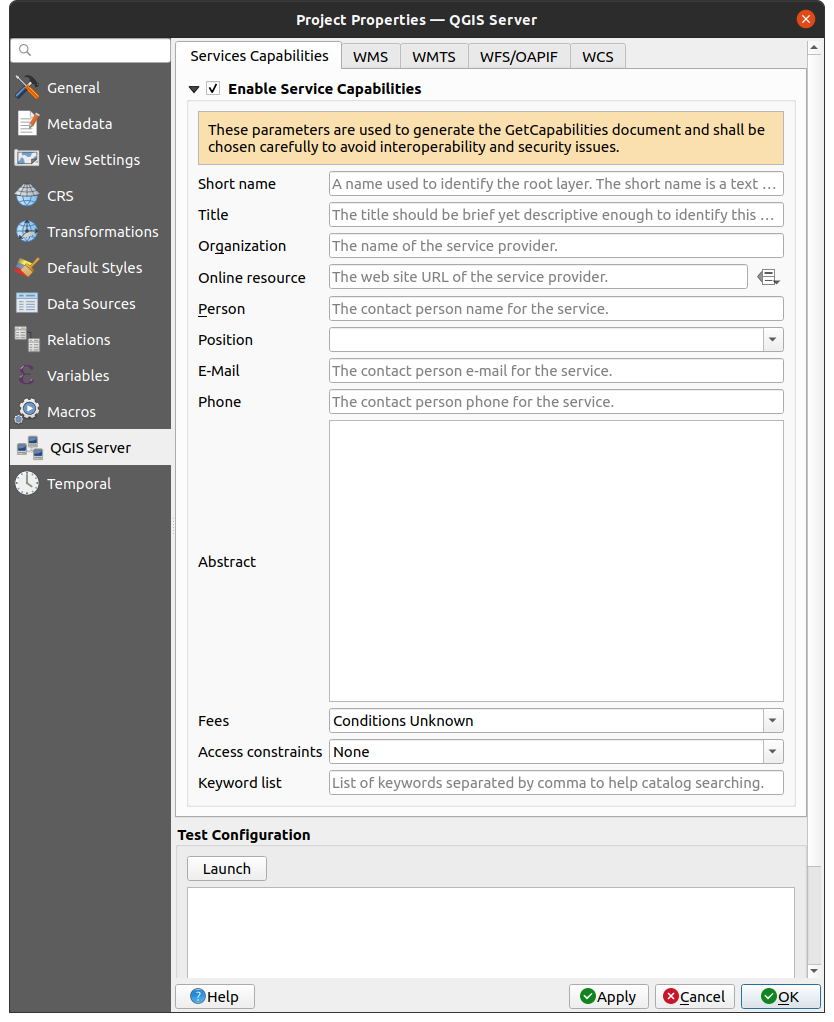
Abb. 5.39 Der QGIS Server Reiter
5.3.13. Zeitlich
Auf dem Reiter Zeitlich können Sie einen zeitlichen Bereich für Ihr Projekt festzulegen, entweder durch manuelle Eingabe von einem Startdatum und einem Enddatum oder durch Analysieren der zeitlichen Layer des Projekts mit Aus Layern berechnen. Der Zeitbereich des Projekts kann dann im Bedienfeld Zeitsteuerung verwendet werden, um die Kartenansicht zeitlich darzustellen; s. auch <maptimecontrol> .
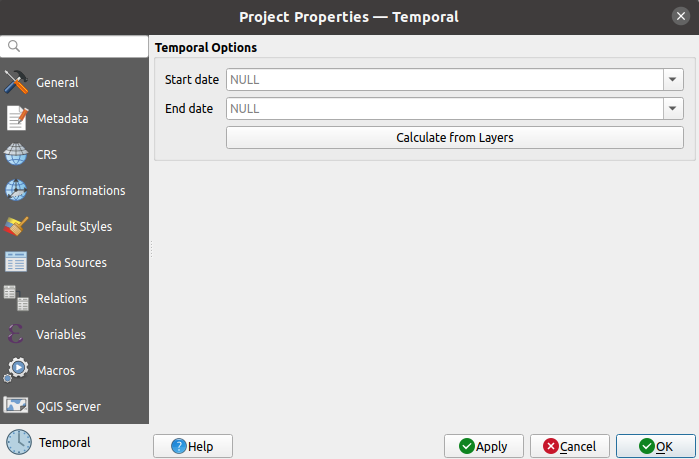
Abb. 5.40 Der Zeitlich-Reiter
5.3.14. Geländehöhe
Die Registerkarte  Geländehöhe hilft Ihnen bei der Konfiguration der Standardeinstellungen für das Gelände und die Höhe. Wenn eine neue 3D-Karte im Projekt erstellt wird, verwendet die Karte standardmäßig dieselben Geländeeinstellungen, die für das Projekt definiert sind. Die Höheneinstellungen des Projekts werden auch beim Geländehöhenprofil berücksichtigt.
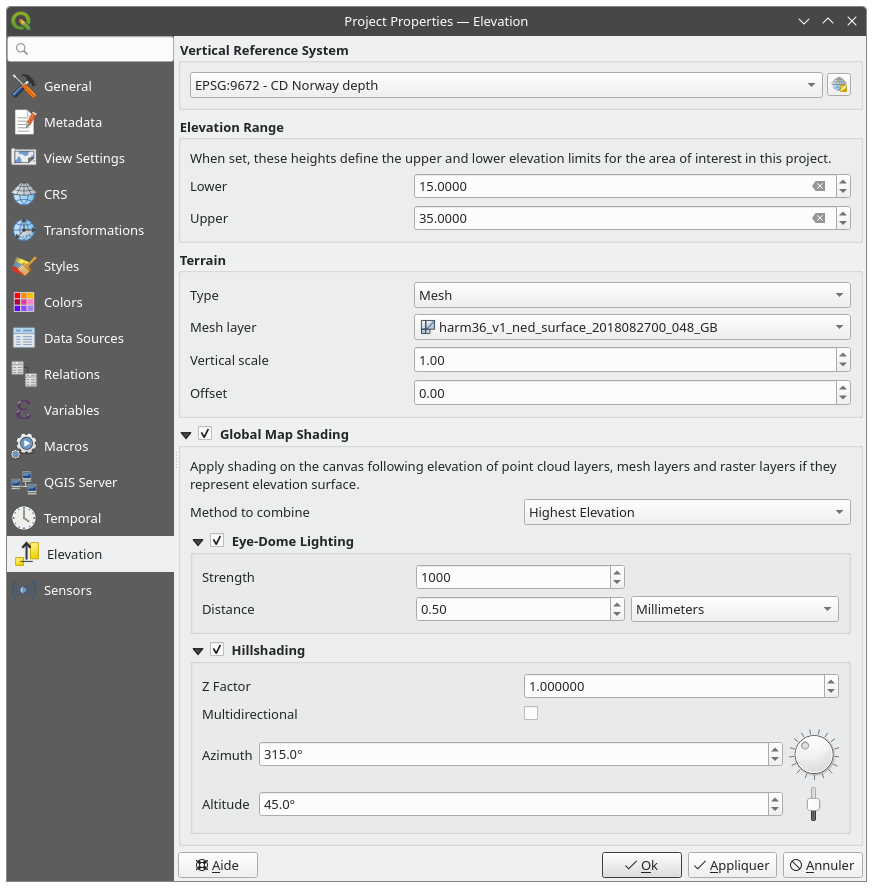
Abb. 5.41 Der Geländehöhen-Reiter
Vertikales Bezugssystem: Wenn das KBS Ihres Projekts ein dreidimensionales ist, also auch eine Z-Komponente enthält, dann ist auch das für das Projekt verwendete vertikale KBS diese Z-Komponente. Wenn Ihr Projekt-KBS horizontal ist, können Sie ein bestimmtes vertikales KBS auswählen, indem Sie auf
 KBS wählen klicken oder eines aus der Favoritenliste auswählen.
Geländehöhenbereich: Hilft Ihnen dabei, die Untere und Obere Grenze für die Höhensteuerung im Projekt festzulegen.
Im Bereich Gelände können sie zwischen den folgenden Typen wählen:
Flaches Gelände mit der Einstellung für die Geländehöhe;
DHM (Rasterlayer) mit der Möglichkeit den entsprechenden DHM-Layer auszuwählen, einen Vertikal Maßstab für die Bandwerte und einen vertikalen Versatz anzugeben;
Netz mit der Möglichkeit, den entsprechenden Netzlayer auszuwählen, einen Vertikalen Maßstab, der auf den Z-Wert der Eckpunkte angewendet wird und einen vertikalen Versatz anzugeben.
Diese Einstellungen können mit dem Konfigurieren… Dialog einer 3D-Kartenansicht überschrieben werden.
Mit der Einstellung
Globale Kartenschattierung legen Sie für Ihr Projekt einen Schattierungseffekt fest, der auf der Höhe aller aktiven Layer der folgenden Typen basiert:Methode zur Kombination: um den Höhenwert an einer bestimmten Position zu ermitteln, werden alle relevanten Layer berücksichtigt, wobei einer der folgenden Möglichkeiten gewählt werden kann:
Höchste Erhebung: der höchste Wert aller Layer wird verwendet;
Basierend auf der Layerreihenfolge: die Höhe auf dem obersten Layer im Layer-Baum wird verwendet.
Unterstützte Schattierungsoptionen sind:
- Eye-dome-Lighting: wendet Schattierungseffekte auf die Kartenansicht an, um eine bessere Tiefenwiedergabe zu erreichen. Die folgenden Parameter können gesteuert werden:
Stärke: erhöht den Kontrast und ermöglicht eine bessere Tiefenwahrnehmung
Abstand: stellt den Abstand der verwendeten Pixel vom mittleren Pixel dar und bewirkt, dass die Ränder dicker werden.
- Schummerung generiert Reliefs auf der Karte mithilfe von Schattierungen (Graustufen):
Z-Faktor: Skalierungsfaktor für den Höhenwert
- Mehrgerichtet: Sie können festlegen, ob eine multidirektionale Schattierung verwendet werden soll.
Azimut: Der Azimut der fiktiven Lichtquelle
Höhenlage: Der Neigungswinkel der fiktiven Lichtquelle
Bemerkung
Über das Bedienfeld Layergestaltung steht eine Verknüpfung zu den Eigenschaften von Globale Kartenschattierung zur Verfügung.
5.3.15. Sensoren
Der Reiter  Sensoren dient dazu, Sensoren zu konfigurieren und ihren Verbindungsstatus umzuschalten. Wenn sie aktiv sind, sammeln die Sensoren passiv Daten im Hintergrund und stellen ihre neuesten Daten für Ausdrücke und Python-Skripte zur Verfügung.
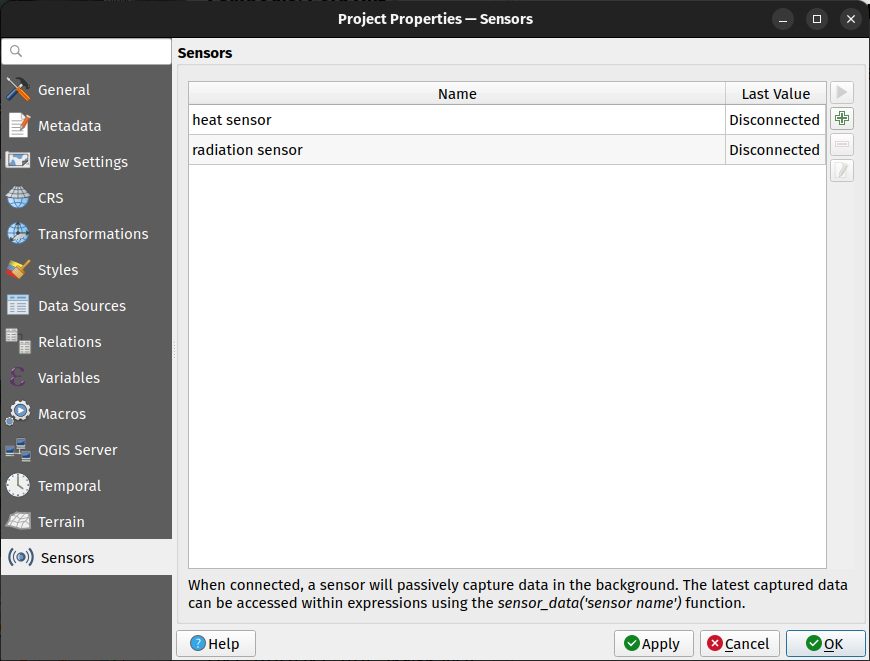
Abb. 5.42 Der Sensor Reiter
Um einen neuen Sensor hinzuzufügen, klicken Sie auf die Schaltfläche. Es öffnet sich ein Bedienfeld, in dem Sie die folgenden Einstellungen vornehmen können:
Name des Sensors: wird verwendet, um Sensorwerte in Ausdrücken und Python-Skripten abzurufen;
Sensortyp: TCP, UDP oder serielle Schnittstelle;
zusätzliche typspezifische Details (z. B. Hostname und Port).
Für Sensoren mit serieller Schnittstelle stehen Kombinationsfelder mit den verfügbaren seriellen Schnittstellen des Systems und der Verbindungsbaudrate zur Auswahl. Ein Data frame delimiter kann zum Parsen der zurückgegebenen Daten verwendet werden. Wenn im letzten vom seriellen Port übertragenen Datenblock mehrere Datenframes gefunden werden, werden alle Datenframes zurückgegeben. Sie können dann einen Ausdruck verwenden, um den zurückgegebenen letzten Datenwert des Sensors in einzelne Frames aufzuteilen (z. B. mit der Funktion string_to_array).
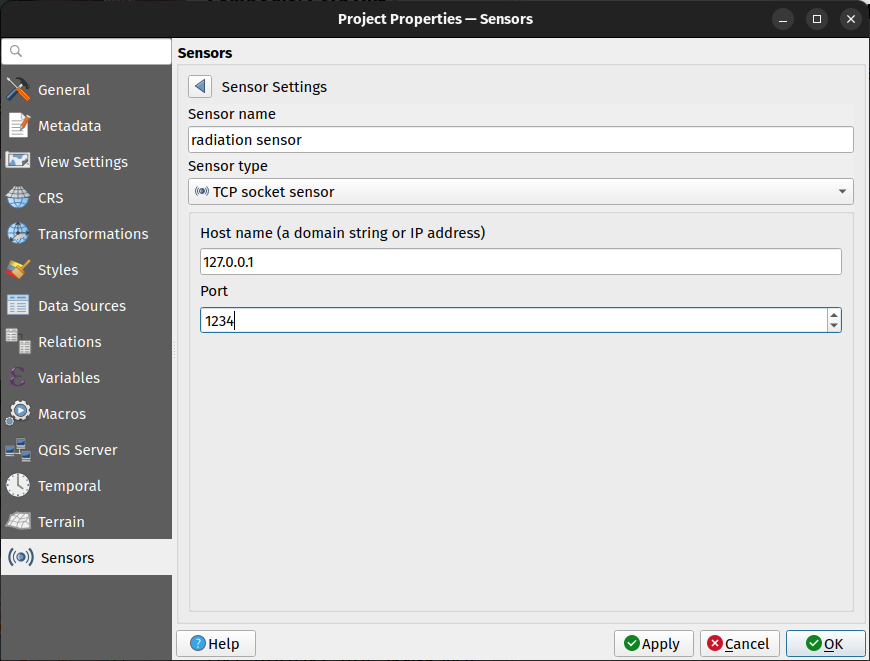
Abb. 5.43 Das Sensor-Einstellungen Fenster
Sobald ein Sensor konfiguriert ist, können Sie mit der Schaltfläche  Sensorverbindungsstatus umschalten die Verbindung mit dem Sensor herstellen. Wenn die Verbindung aktiv ist, werden die zuletzt erfassten Daten in der Spalte Letzter Wert der Sensortabelle angezeigt.
5.4. Anpassung
Mit dem Dialog Oberflächenanpassung im Menü Einstellungen können Sie fast jedes Element der QGIS-Benutzeroberfläche (de)aktivieren. Dies kann sehr nützlich sein, wenn Sie Ihren Endbenutzern eine „Light“-Version von QGIS zur Verfügung stellen möchten, die nur die Symbole, Menüs oder Bedienfelder enthält, die sie benötigen.
Bemerkung
Bevor die Änderungen an der Benutzeroberfläche übernommen werden, müssen Sie QGIS neu starten.
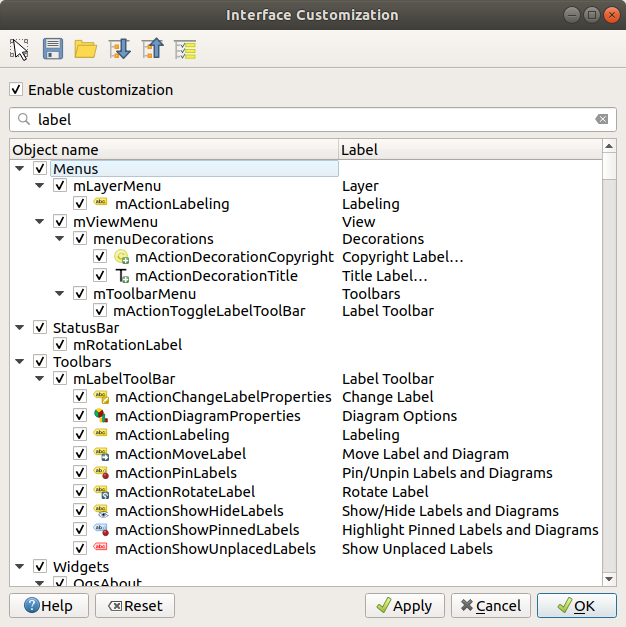
Abb. 5.44 Der Anpassung Dialog
Bevor Sie Änderungen an der Oberfläche vornehmen können, müssen Sie Anpassung aktivieren anklicken. Dies aktiviert die Werkzeugleiste und das Widget-Panel, hier können Sie einige QGIS Elemente unsichtbar schalten.
Die deaktivierbaren Elemente können sein:
aus dem Menu ein kompletter Eintrag oder ein Untermenü (s. Menüleiste);
ein komplettes Panel (s. Bedienfelder und Werkzeugkästen);
die Statusleiste oder Teile davon (s. Statusleiste);
im Browser angezeigte Dateitypen;
ein beliebiges Element („Widget“) aus einem beliebigen QGIS Dialog: Beschriftung, Knöpfe, Komboboxen…
Mit  Umschalten um Bedienelemente in der Hauptanwendung zu fangen können Sie auf ein Element in der QGIS-Oberfläche klicken, das ausgeblendet werden soll, und QGIS deaktiviert automatisch die Markierung des entsprechenden Eintrags im Anpassungsdialog. Sie können auch das Feld Suchen verwenden, um Elemente anhand ihres Namens oder ihrer Bezeichnung zu finden.
Wenn Sie Ihre Einstellungen vorgenommen haben, klicken Sie auf Anwenden oder OK, um Ihre Änderungen zu bestätigen. Die Einstellungen werden ab dem nächsten Start von QGIS standardmäßig verwendet.
Die Modifikationen können mit Als Datei speichern in einer .ini Datei gesichert werden. Mit dieser Option kann auch eine bestimmte Konfiguration für mehrere Benutzer eingerichtet werden. Mit Aus Datei laden kann die``.ini`` Datei auf anderen Rechnern importiert werden. Sie können auch verschiedene Einstellungen für verschiedene Anwendungsfälle speichern und diese dann beim Start von QGIS über die Kommandozeile aufrufen
Tipp
Standardeinstellungen einfach wiederherstellen
Mit einer der unten aufgeführten Methoden kann die standardmäßige QGIS GUI-Konfiguration wiederhergestellt werden:
deaktivieren Sie
Anpassung aktivieren oder klicken Sie auf  Alle anhaken;
drücken Sie im Menü auf dem Reiter System im Bereich Einstellungen auf die Zurücksetzen Schaltfläche;
starten Sie QGIS über die Eingabeaufforderung mit dem Befehl
qgis --nocustomization;setzen Sie im Menü auf dem Reiter Erweitert den Wert der Variablen auf
false(Beachten Sie die Warnung).
In den meisten Fällen müssen Sie QGIS neu starten, damit die Änderung übernommen werden.
5.5. Tastenkürzel
QGIS bietet Standard-Tastaturkürzel für viele Funktionen, Sie finden diese im Abschnitt Menüleiste. Über den Menüpunkt können Sie die Standard-Tastaturkürzel ändern und neue hinzufügen.
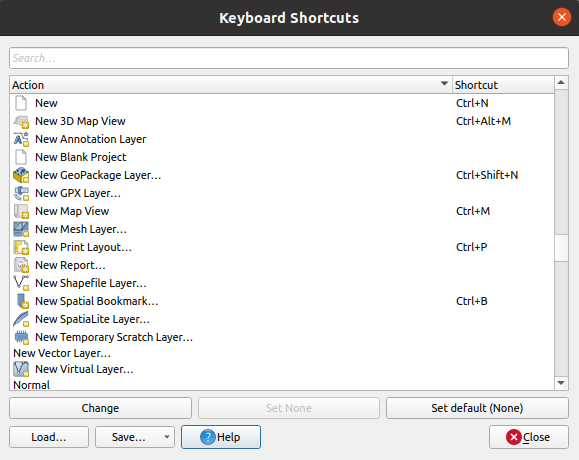
Abb. 5.45 Das Fenster der Tastenkürzel
Die Konfiguration ist sehr einfach. Verwenden Sie das Suchfeld oben im Dialogfeld, um eine bestimmte Aktion zu finden, wählen Sie diese in der Liste aus und klicken dann auf:
Ändern und drücken Sie die neue Kombination, die Sie als neuen Shortcut zuweisen möchten;
Leer setzen um eine zugewiesene Verknüpfung zu löschen;
oder Voreinstellung um die Verknüpfung auf ihren ursprünglichen Standardwert zurückzusetzen.
Verfahren Sie wie oben für alle anderen Aktionen, die Sie anpassen möchten. Wenn Sie Ihre Konfiguration abgeschlossen haben, schließen Sie einfach den Dialog, um die Änderungen zu übernehmen. Sie können die Änderungen auch Speichern…, entweder als .XML-Datei nur mit den benutzerdefinierten Tastenkürzeln oder mit allen Tastenkürzeln oder als .PDF-Datei mit allen Tastenkürzeln. Ebenso können sie benutzerdefinierte Einstellungen aus einer Datei Laden….
5.6. QGIS mit erweiterten Einstellungen ausführen
5.6.1. Eingabeaufforderung und Umgebungsvariablen
Wir haben gesehen, dass der Start von QGIS wie bei jeder anderen Anwendung auf Ihrem Betriebssystem funktioniert. QGIS bietet Befehlszeilenoptionen für fortgeschrittenere Anwendungsfälle (in einigen Fällen können Sie anstelle der Befehlszeilenoption eine Umgebungsvariable verwenden). Um eine Liste der Optionen zu erhalten, geben Sie qgis --help in die Befehlszeile ein, woraufhin Folgendes angezeigt wird:
QGIS is a user friendly Open Source Geographic Information System.
Usage: /usr/bin/qgis.bin [OPTION] [FILE]
  OPTION:
        [-v, --version]     display version information and exit
        [-s, --snapshot filename]   emit snapshot of loaded datasets to given file
        [-w, --width width] width of snapshot to emit
        [-h, --height height]       height of snapshot to emit
        [-l, --lang language]       use language for interface text (changes existing override)
        [-p, --project projectfile] load the given QGIS project
        [-e, --extent xmin,ymin,xmax,ymax]  set initial map extent
        [-n, --nologo]      hide splash screen
        [-V, --noversioncheck]      don't check for new version of QGIS at startup
        [-P, --noplugins]   don't restore plugins on startup
        [-B, --skipbadlayers]     don't prompt for missing layers
        [-C, --nocustomization]     don't apply GUI customization
        [-z, --customizationfile path]      use the given ini file as GUI customization
        [-g, --globalsettingsfile path]     use the given ini file as Global Settings (defaults)
        [-a, --authdbdirectory path] use the given directory for authentication database
        [-f, --code path]   run the given python file on load
        [-F, --py-args arguments]   arguments for python. These arguments will be available for each python execution via 'sys.argv' including the file specified by '--code'. All arguments till '--' are passed to python and ignored by QGIS.
        [-d, --defaultui]   start by resetting user ui settings to default
        [--hide-browser]        hide the browser widget
        [--dxf-export filename.dxf]     emit dxf output of loaded datasets to given file
        [--dxf-extent xmin,ymin,xmax,ymax]      set extent to export to dxf
        [--dxf-symbology-mode none|symbollayer|feature] symbology mode for dxf output
        [--dxf-scale-denom scale]       scale for dxf output
        [--dxf-encoding encoding]       encoding to use for dxf output
        [--dxf-map-theme maptheme]      map theme to use for dxf output
        [--take-screenshots output_path]        take screen shots for the user documentation
        [--screenshots-categories categories]   specify the categories of screenshot to be used (see QgsAppScreenShots::Categories).
        [--profile name]        load a named profile from the user's profiles folder.
        [-S, --profiles-path path]  path to store user profile folders. Will create profiles inside a {path}\profiles folder
        [--version-migration]   force the settings migration from older version if found
        [--openclprogramfolder]         path to the folder containing the sources for OpenCL programs.
        [--help]                this text
        [--]            treat all following arguments as FILEs

  FILE:
    Files specified on the command line can include rasters,
    vectors, and QGIS project files (.qgs and .qgz):
     1. Rasters - supported formats include GeoTiff, DEM
        and others supported by GDAL
     2. Vectors - supported formats include ESRI Shapefiles
        and others supported by OGR and PostgreSQL layers using
        the PostGIS extension
Tipp
Beispiel für die Verwendung von Kommandozeilen-Argumenten
Sie können eine oder mehrere Dateien direkt beim Start von QGIS laden, indem Sie diese in der Kommandozeile angeben. Wenn Sie sich zum Beispiel im Verzeichnis qgis_sample_data befinden, können Sie QGIS mit einem Vektor-Layer und einer Rasterdatei starten, indem Sie den folgenden Befehl verwenden: qgis ./raster/landcover.img ./gml/lakes.gml
5.6.1.1. --version
Diese Option liefert QGIS Versionsinformationen.
5.6.1.2. --snapshot
Mit dieser Option können Sie ein Bildschirmfoto im PNG-Format von der aktuellen Ansicht erstellen. Dies ist z.B. praktisch, wenn Sie Bildschirmfotos desselben Projekts mit verschiedenen Daten erstellen müssen.
Ohne weitere Angaben wird eine PNG-Datei mit 800x600 Pixeln erzeugt. Die Größe kann mit den Argumenten --width und --height angepasst werden. Der Dateiname kann nach --snapshot hinzugefügt werden. Zum Beispiel:
qgis --snapshot my_image.png --width 1000 --height 600 --project my_project.qgs
5.6.1.3. --width
Diese Option gibt die Breite des auszugebenden Schnappschusses an (wird zusammen mit -snapshot verwendet`).
5.6.1.4. --height
Diese Option gibt die Höhe des auszugebenden Schnappschusses an (wird zusammen mit -snapshot verwendet).
5.6.1.5. --lang
Mit dieser Option kann für die QGIS Lokale (Sprache der Oberfläche, Zahlenformat, etc) eine von der ursprünglichen Installation abweichende Auswahl getroffen werden. Zum Beispiel startet qgis --lang it QGIS in der italienischen Lokalisierung.
5.6.1.6. --project
Es ist auch möglich, QGIS mit einer bestehenden Projektdatei zu starten. Fügen Sie einfach die Kommandozeilenoption --project gefolgt von Ihrem Projektnamen hinzu und QGIS wird mit dem entsprechenden Projekt gestartet.
5.6.1.7. --extent
Verwenden Sie diese Option, um mit einem bestimmten Kartenausschnitt zu beginnen. Sie müssen die Angaben für den Ausschnitt Ihres Bereichs in der folgenden Reihenfolge durch ein Komma getrennt hinzufügen:
--extent xmin,ymin,xmax,ymax
Diese Möglichkeit kann gut mit der Option --project kombiniert werden, um ein bestimmtes Projekt in der gewünschten Größe zu öffnen.
5.6.1.8. --nologo
Diese Option blendet den Startbildschirm aus, wenn Sie QGIS starten.
5.6.1.9. --noversioncheck
Damit überspringen Sie die Suche nach einer neuen Version von QGIS beim Starten.
5.6.1.10. --noplugins
Wenn Sie beim Start Probleme mit Plugins haben, können Sie mit dieser Option das Laden der Plugins beim Start unterbinden. Sie sind danach immer noch über den Plugin-Manager verfügbar.
5.6.1.11. --nocustomization
Mit dieser Option werden alle vorgenommene Oberflächen Anpassungen beim Start ignoriert. Das bedeutet, dass QGIS mit allen Standardeinstellungen, wie bei einer Neuinstallation gestartet wird. Dies ist keine permanente Änderung, die Anpassungen werden wieder angewendet, wenn QGIS ohne diese Option gestartet wird.
Diese Option ist nützlich, um vorübergehend den Zugriff auf Werkzeuge zu ermöglichen, die durch Anpassung entfernt wurden.
5.6.1.12. --skipbadlayers
Mit dieser Option können Sie vermeiden, dass QGIS beim Start den Dialog Nicht verfügbare Layer behandeln anzeigt. Fehlende Layer werden dann beim Starten eines Projekts als nicht verfügbar gekennzeichnet. Mehr Details zu diesem Thema unter Behandlung von fehlerhaften Dateipfaden.
5.6.1.13. --customizationfile
Mit dieser Option können Sie eine UI-Anpassungsdatei definieren, die beim Start verwendet wird.
5.6.1.14. --globalsettingsfile
Die entsprechende Umgebungsvariable ist QGIS_GLOBAL_SETTINGS_FILE.
Mit dieser Option können Sie den Pfad zu einer .ini-Datei mit globalen Einstellungen (auch Standardeinstellungen genannt) angeben. Die Definitionen in der angegebenen Datei ersetzen die ursprünglichen Inline-Standardeinstellungen, wobei die Einstellungen des Benutzerprofils zusätzlich gesetzt werden.
QGIS sucht in der folgenden Reihenfolge nach der globalen Standardeinstellungsdatei, wobei die erste gefundene Datei verwendet wird:
in dem Pfad, der durch diesen Kommandozeilenparameter angegeben wird
in dem Pfad, der durch die Umgebungsvariable angegeben wird
im AppDataLocation-Ordner, in dem persistente Anwendungsdaten gespeichert werden können; dieser wird vom Benutzer oder Systemadministrator verwaltet und wird vom Installationsprogramm nicht verändert und erfordert keine zusätzliche Einrichtung wie die Übergabe von Befehlszeilenparametern oder Umgebungsvariablen. Je nach Betriebssystem ist dieser Ordner:
-
$HOME/.local/share/QGIS/QGIS3/ -
C:\Users\<username>\AppData\Roaming\QGIS\QGIS3\ -
$HOME/Library/Application Support/QGIS/QGIS3/
das Installationsverzeichnis, d. h.:file:Ihr_QGIS_Paketpfad/resources/qgis_global_settings.ini.
Es gibt derzeit keine Möglichkeit, die Einstellungen von QGIS aus in eine Datei zu schreiben; Sie können daher lediglich eine Kopie der ursprünglichen Einstellungsdatei erstellen, diese umbenennen und anpassen.
Das Festlegen des Dateipfads für die Datei qgis_global_setting.ini auf einen gemeinsam genutzten Netzlaufwerksordner ermöglicht es einem Systemadministrator, globale Einstellungen und Standardwerte für mehrere Rechner zu verwalten, indem er nur eine Datei bearbeitet.
5.6.1.15. --authdbdirectory
Diese Option ist ähnlich wie --globalsettingsfile, definiert aber den Pfad zu dem Verzeichnis, in dem die Authentifizierungsdatenbank gespeichert und geladen wird.
5.6.1.16. --code
Diese Option kann verwendet werden, um eine bestimmte Python-Datei direkt nach dem Start von QGIS auszuführen.
Wenn Sie zum Beispiel eine Python-Datei mit dem Namen load_alaska.py mit folgendem Inhalt haben:
from qgis.utils import iface
raster_file = "/home/gisadmin/Documents/qgis_sample_data/raster/landcover.img"
layer_name = "Alaska"
iface.addRasterLayer(raster_file, layer_name)
Angenommen, Sie befinden sich in dem Verzeichnis, in dem sich die Datei load_alaska.py befindet, können Sie QGIS starten, die Rasterdatei landcover.img laden und dem Layer mit dem folgenden Befehl den Namen „Alaska” geben:
qgis --code load_alaska.py
5.6.1.17. --py-args
Diese Option ermöglicht es, Argumente an das Skript über den Parameter –code und allgemeiner an jede Python-Ausführung zu übergeben. Nach --py-args können keine anderen Parameter als – an QGIS übergeben werden. Alle Argumente nach --py-args bis -- werden an den Python-Interpreter übergeben und von QGIS ignoriert.
qgis --code /home/user/test.py --py-args --specialScriptArguments "a text arg" 'and another arg' -- layer1 layer2
Im obigen Code hat test.py folgenden Inhalt in sys.argv: [‚/home/user/test.py‘, ‚–specialScriptArguments‘, ‚a text arg‘, ‚and another arg‘]. layer1 und layer2 werden von QGIS normalerweise als zu ladende Layer behandelt.
5.6.1.18. --defaultui
Setzt beim Laden permanent die Benutzeroberfläche (UI) auf die Standardeinstellungen zurück. Diese Option stellt die Sichtbarkeit, Position und Größe der Bedienfelder und Werkzeugleisten wieder her. Die Standardeinstellungen der Benutzeroberfläche werden in den folgenden Sitzungen verwendet, sofern sie nicht erneut geändert werden.
Beachten Sie, dass diese Option keine Auswirkungen auf GUI-Anpassung hat. Durch die GUI-Anpassung ausgeblendete Elemente (z. B. die Statusleiste) bleiben auch bei Verwendung der Option --defaultui ausgeblendet. Siehe auch die Option --nocustomization.
5.6.1.19. --hide-browser
Blendet beim Laden das Bedienfeld Browser aus der Benutzeroberfläche aus. Das Bedienfeld kann durch einen Rechtsklick auf ein Feld in der Werkzeugleiste oder über die ( in  Linux KDE) aktiviert werden.
Wenn es nicht wieder aktiviert wird, bleibt das Bedienfeld „Browser“ in den folgenden Sitzungen ausgeblendet.
5.6.1.20. --dxf-*
Diese Angabe kann verwendet werden, um ein QGIS-Projekt in eine DXF-Datei zu exportieren. Es sind mehrere Optionen verfügbar:
–dxf-export: gefolgt von dem DXF-Dateinamen, in den die Layer exportiert werden sollen;
–dxf-extent: gefolgt von dem Ausschnitt der exportierten DXF-Datei;
–dxf-symbology-mode: hier können verschiedenen Angaben folgen:
none(keine Symbologie),symbollayer(Symbollayer Symbologie),feature(Objekt Symbologie);–dxf-scale-denom: der Maßstabsnenner der Symbologie;
–dxf-encoding: die Datei-Kodierung;
–dxf-map-theme: Wählen Sie ein vorhandenes Kartenthema aus dem Layer-Bedienfeld, das für den Export verwendet werden soll.
5.6.1.21. --take-screenshots
Nimmt Screenshots für die Benutzerdokumentation auf. Kann zusammen mit --screenshots-categories verwendet werden, um zu filtern, welche Kategorien/Abschnitte der Dokumentations-Screenshots erstellt werden sollen (siehe QgsAppScreenShots::Categories).
5.6.1.22. --profile
Lädt QGIS mit einem bestimmten Profil aus dem Profilordner des Benutzers. Wenn das angegebene Profil nicht existiert, wird es erstellt. Diese Option hat Vorrang vor Benutzerprofil-Starteinstellung.
5.6.1.23. --profiles-path
Mit dieser Option können Sie einen Pfad zum Laden und Speichern der Benutzerprofile wählen. Die Profile werden im Ordner {Pfad}\profiles erstellt, welche Einstellungen, installierte Plugins, Verarbeitungsmodelle und Skripte usw. enthalten.
Das bietet Ihnen die Möglichkeit z. B. alle Ihre Plugins und Einstellungen auf einem externen Laufwerk/USB-Stick mit sich zuführen oder die Einstellungen über einen Dateifreigabedienst zwischen verschiedenen Computern auszutauschen.
Die entsprechende Umgebungsvariable ist QGIS_CUSTOM_CONFIG_PATH.
5.6.1.24. --version-migration
Wenn Einstellungen aus einer älteren Version gefunden werden (z.B., der .qgis2 Ordner von QGIS 2.18), ist es mit dieser Option möglich, diese Einstellungen in das Standard QGIS Profil zu importieren.
5.6.1.25. --openclprogramfolder
Mit dieser Option können Sie einen alternativen Pfad für Ihre OpenCL-Programme angeben. Dies ist für Entwickler nützlich, wenn sie neue Versionen der Programme testen wollen, ohne dabei die vorhandenen Programme ersetzen zu müssen.
Die entsprechende Umgebungsvariable ist QGIS_OPENCL_PROGRAM_FOLDER.
5.6.1.26. --
Mit dieser Option können die folgenden Argumente als Dateien zum Öffnen in QGIS übergeben werden. Dabei kann es sich um unterstützte Raster- oder Vektordateien, QGIS- Layerdefinitionsdateien oder Projektdateien handeln.
qgis -- /home/user/project.qgs /home/user/path_to_data/layer1.gpkg
Der obige Code startet QGIS, öffnet die Datei project und lädt layer1 darin.
5.6.2. Bereitstellen von QGIS innerhalb von Organisationen
Wenn Sie QGIS innerhalb einer Organisation (Unternehmen, Verwaltung, …) mit einer eigenen, benutzerdefinierten Konfigurationsdatei einsetzen möchten, müssen Sie zunächst den Inhalt der Standard-Konfigurationsdatei kopieren/einfügen, die sich in Ihr_QGIS_Installationspfad/resources/qgis_global_settings.ini befindet. Diese Datei enthält bereits einige Blöcke zu verschiedenen Bereichen, die jeweils durch einen entsprechenden Begriff in eckigen Klammern gekennzeichnet sind, z.B. [digitizing]. Wir empfehlen, dass Sie diese Standardwerte beibehalten und Ihre eigenen Abschnitte am Ende der Datei hinzufügen. Wenn ein Abschnitt in der Datei doppelt vorhanden ist, wird QGIS den letzten Abschnitt von oben nach unten übernehmen.
Sie können hier z.B. auch allowVersionCheck=false ändern, um die QGIS Versionsprüfung zu deaktivieren.
Wenn Sie das Migrationsfenster nach einer Neuinstallation nicht anzeigen möchten, müssen Sie den folgenden Abschnitt hinzufügen:
[migration]
fileVersion=2
settings=true
Wenn Sie eine benutzerdefinierte Variable hinzufügen möchten, müssen Sie folgendes eingeben:
[variables]
organisation="Your organization"
A lot of settings can be set using the .INI file such as WMS/WMTS, PostgreSQL connections,
proxy settings, maptips, default values for algorithms parameters…
For example, if you want to configure organization wide default values for some algorithms
it would be handy if you could configure it in the prepared ini-file for all users.
If the users then open the toolbox to execute an algorithm, the default values will be there.
To set the default value, e.g., for GRID_SIZE parameter for the native:intersection algorithm,
you could write the following into the .INI file:
[Processing]
DefaultGuiParam\native%3Aintersection\GRID_SIZE=0.01
Nicht alle Optionen der QGIS GUI sind einstellbar, um die Möglichkeiten der .ini-Datei zu entdecken, schlagen wir vor, dass Sie die gewünschte Konfiguration in QGIS einstellen und dann in Ihrer .ini-Datei nach der entsprechenden Einstellung suchen.
Schließlich müssen Sie noch die Umgebungsvariable QGIS_GLOBAL_SETTINGS_FILE auf den Pfad Ihrer angepassten Datei setzen.
Darüber hinaus können Sie auch Dateien wie Python-Makros, Farbpaletten, Layoutvorlagen, Projektvorlagen, … entweder im QGIS-Systemverzeichnis oder im QGIS-Benutzerprofil bereitstellen.
Layout-Vorlagen müssen im Verzeichnis
composer_templatesbereitgestellt werden.Projektvorlagen müssen im Verzeichnis
project_templatesbereitgestellt werden.Benutzerdefinierte Python-Makros müssen im Verzeichnis
pythonbereitgestellt werden.