Ważne
Tłumaczenie jest wysiłkiem społeczności QGISa przyłącz się. Ta strona jest obecnie przetłumaczona w 54.87%.
24.1.15. Raster analysis
24.1.15.1. Cell stack percent rank from value
Calculates the cell-wise percentrank value of a stack of rasters based on a single input value and writes them to an output raster.
At each cell location, the specified value is ranked among the respective values in the stack of all overlaid and sorted cell values from the input rasters. For values outside of the stack value distribution, the algorithm returns NoData because the value cannot be ranked among the cell values.
There are two methods for percentile calculation:
Inclusive linear interpolation (PERCENTRANK.INC)
Exclusive linear interpolation (PERCENTRANK.EXC)
The linear interpolation methods return the unique percent rank for different values. Both interpolation methods follow their counterpart methods implemented by LibreOffice or Microsoft Excel.
The output raster’s extent and resolution is defined by a reference raster.
Input raster layers that do not match the cell size of the reference
raster layer will be resampled using nearest neighbor resampling.
NoData values in any of the input layers will result in a NoData cell output
if the „Ignore NoData values” parameter is not set.
The output raster data type will always be Float32.
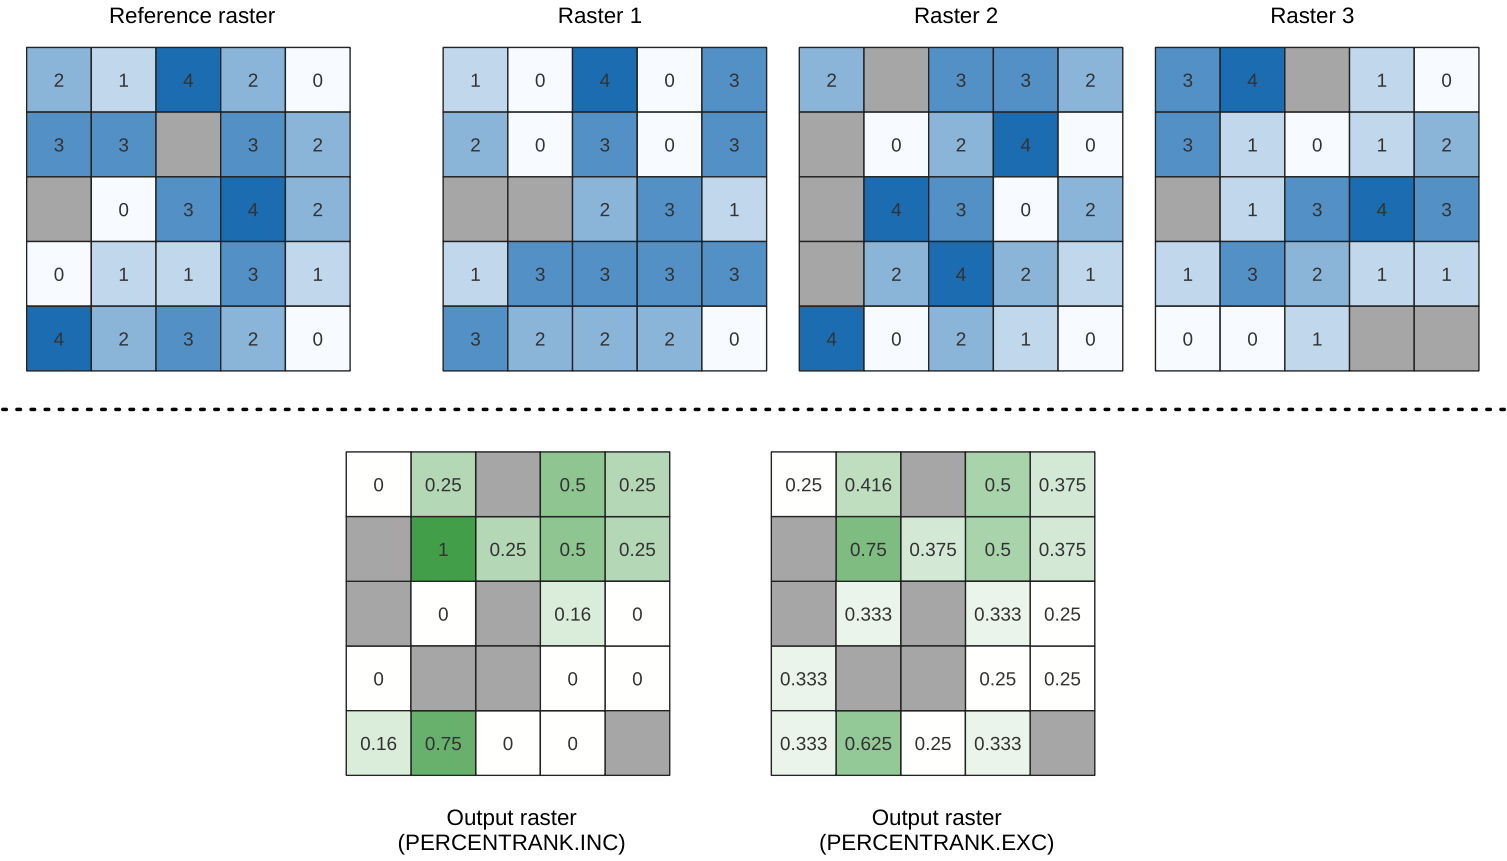
Rys. 24.19 Percent ranking Value = 1. NoData cells (grey) are ignored.
Parametry
Parametry podstawowe
Etykieta |
Nazwa |
Typ |
Opis |
|---|---|---|---|
Warstwy wejściowe |
|
[raster] [lista] |
Raster layers to evaluate. If multiband rasters are used in the data raster stack, the algorithm will always perform the analysis on the first band of the rasters |
Metoda |
|
[wyliczenie] Domyślnie: 0 |
Method for percentile calculation:
|
Wartość |
|
[numeric: double] Domyślnie: 10.0 |
Value to rank among the respective values in the stack of all overlaid and sorted cell values from the input rasters |
Ignore NoData values |
|
[wartość logiczna] Domyślnie: True |
If unchecked, any NoData cells in the input layers will result in a NoData cell in the output raster |
Warstwa referencyjna |
|
[raster] |
The reference layer for the output layer creation (extent, CRS, pixel dimensions) |
Warstwa wynikowa |
|
[same as input] Domyślnie: |
Specification of the output raster. One of:
|
Parametry zaawansowane
Etykieta |
Nazwa |
Typ |
Opis |
|---|---|---|---|
Output NoData value |
|
[numeric: double] Domyślnie: -9999.0 |
Value to use for NoData in the output layer |
Opcje generowania Opcjonalne |
|
[ciąg tekstowy] Domyślnie: «» |
For adding one or more creation options that control the raster to be created (colors, block size, file compression…). For convenience, you can rely on predefined profiles (see GDAL driver options section). Batch Process and Model Designer: separate multiple options with a pipe
character ( |
Wyniki
Etykieta |
Nazwa |
Typ |
Opis |
|---|---|---|---|
Warstwa wynikowa |
|
[raster] |
Output raster layer containing the result |
CRS authority identifier |
|
[ciąg tekstowy] |
The coordinate reference system of the output raster layer |
Zasięg |
|
[ciąg tekstowy] |
The spatial extent of the output raster layer |
Width in pixels |
|
[numeric: integer] |
The number of columns in the output raster layer |
Height in pixels |
|
[numeric: integer] |
The number of rows in the output raster layer |
Total pixel count |
|
[numeric: integer] |
The count of pixels in the output raster layer |
Kod pythona
ID algorytmu: native:cellstackpercentrankfromvalue
import processing
processing.run("algorithm_id", {parameter_dictionary})
The algorithm id is displayed when you hover over the algorithm in the Processing Toolbox. The parameter dictionary provides the parameter NAMEs and values. See Using processing algorithms from the console for details on how to run processing algorithms from the Python console.
24.1.15.2. Cell stack percentile
Calculates the cell-wise percentile value of a stack of rasters and writes the results to an output raster. The percentile to return is determined by the percentile input value (ranges between 0 and 1). At each cell location, the specified percentile is obtained using the respective value from the stack of all overlaid and sorted cell values of the input rasters.
There are three methods for percentile calculation:
Nearest rank: returns the value that is nearest to the specified percentile
Inclusive linear interpolation (PERCENTRANK.INC)
Exclusive linear interpolation (PERCENTRANK.EXC)
The linear interpolation methods return the unique values for different percentiles. Both interpolation methods follow their counterpart methods implemented by LibreOffice or Microsoft Excel.
The output raster’s extent and resolution is defined by a reference raster.
Input raster layers that do not match the cell size of the reference
raster layer will be resampled using nearest neighbor resampling.
NoData values in any of the input layers will result in a NoData cell output
if the „Ignore NoData values” parameter is not set.
The output raster data type will always be Float32.
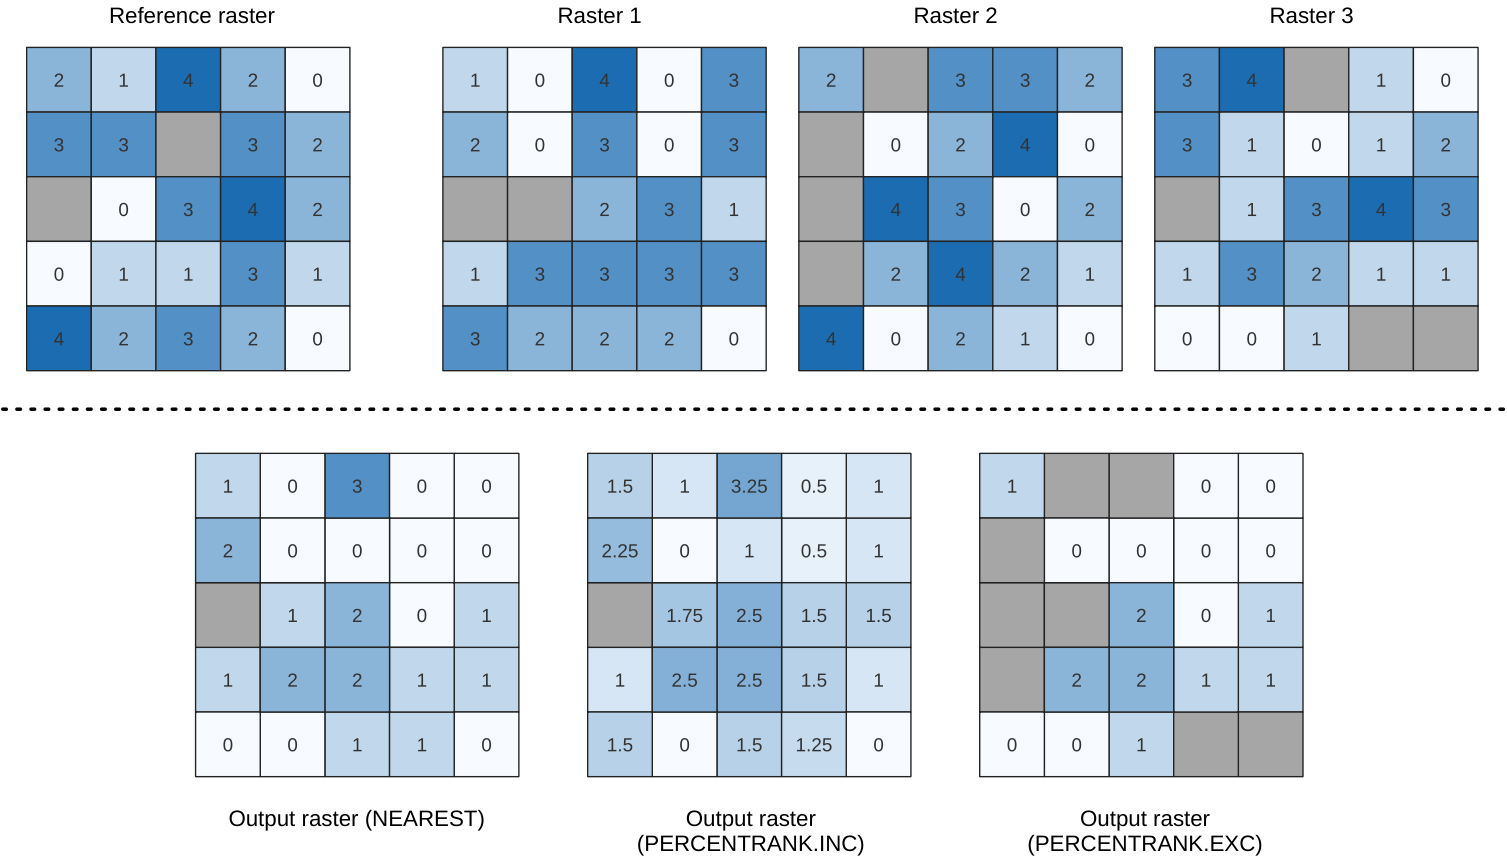
Rys. 24.20 Percentile = 0.25. NoData cells (grey) are ignored.
Parametry
Parametry podstawowe
Etykieta |
Nazwa |
Typ |
Opis |
|---|---|---|---|
Warstwy wejściowe |
|
[raster] [lista] |
Raster layers to evaluate. If multiband rasters are used in the data raster stack, the algorithm will always perform the analysis on the first band of the rasters |
Metoda |
|
[wyliczenie] Domyślnie: 0 |
Method for percentile calculation:
|
Percentile |
|
[numeric: double] Domyślnie: 0.25 |
Value to rank among the respective values in the stack of all overlaid and sorted cell values from the input rasters. Between 0 and 1. |
Ignore NoData values |
|
[wartość logiczna] Domyślnie: True |
If unchecked, any NoData cells in the input layers will result in a NoData cell in the output raster |
Warstwa referencyjna |
|
[raster] |
The reference layer for the output layer creation (extent, CRS, pixel dimensions) |
Warstwa wynikowa |
|
[same as input] Domyślnie: |
Specification of the output raster. One of:
|
Parametry zaawansowane
Etykieta |
Nazwa |
Typ |
Opis |
|---|---|---|---|
Output NoData value |
|
[numeric: double] Domyślnie: -9999.0 |
Value to use for NoData in the output layer |
Opcje generowania Opcjonalne |
|
[ciąg tekstowy] Domyślnie: «» |
For adding one or more creation options that control the raster to be created (colors, block size, file compression…). For convenience, you can rely on predefined profiles (see GDAL driver options section). Batch Process and Model Designer: separate multiple options with a pipe
character ( |
Wyniki
Etykieta |
Nazwa |
Typ |
Opis |
|---|---|---|---|
Warstwa wynikowa |
|
[raster] |
Output raster layer containing the result |
CRS authority identifier |
|
[ciąg tekstowy] |
The coordinate reference system of the output raster layer |
Zasięg |
|
[ciąg tekstowy] |
The spatial extent of the output raster layer |
Width in pixels |
|
[numeric: integer] |
The number of columns in the output raster layer |
Height in pixels |
|
[numeric: integer] |
The number of rows in the output raster layer |
Total pixel count |
|
[numeric: integer] |
The count of pixels in the output raster layer |
Kod pythona
ID algorytmu: native:cellstackpercentile
import processing
processing.run("algorithm_id", {parameter_dictionary})
The algorithm id is displayed when you hover over the algorithm in the Processing Toolbox. The parameter dictionary provides the parameter NAMEs and values. See Using processing algorithms from the console for details on how to run processing algorithms from the Python console.
24.1.15.3. Cell stack percentrank from raster layer
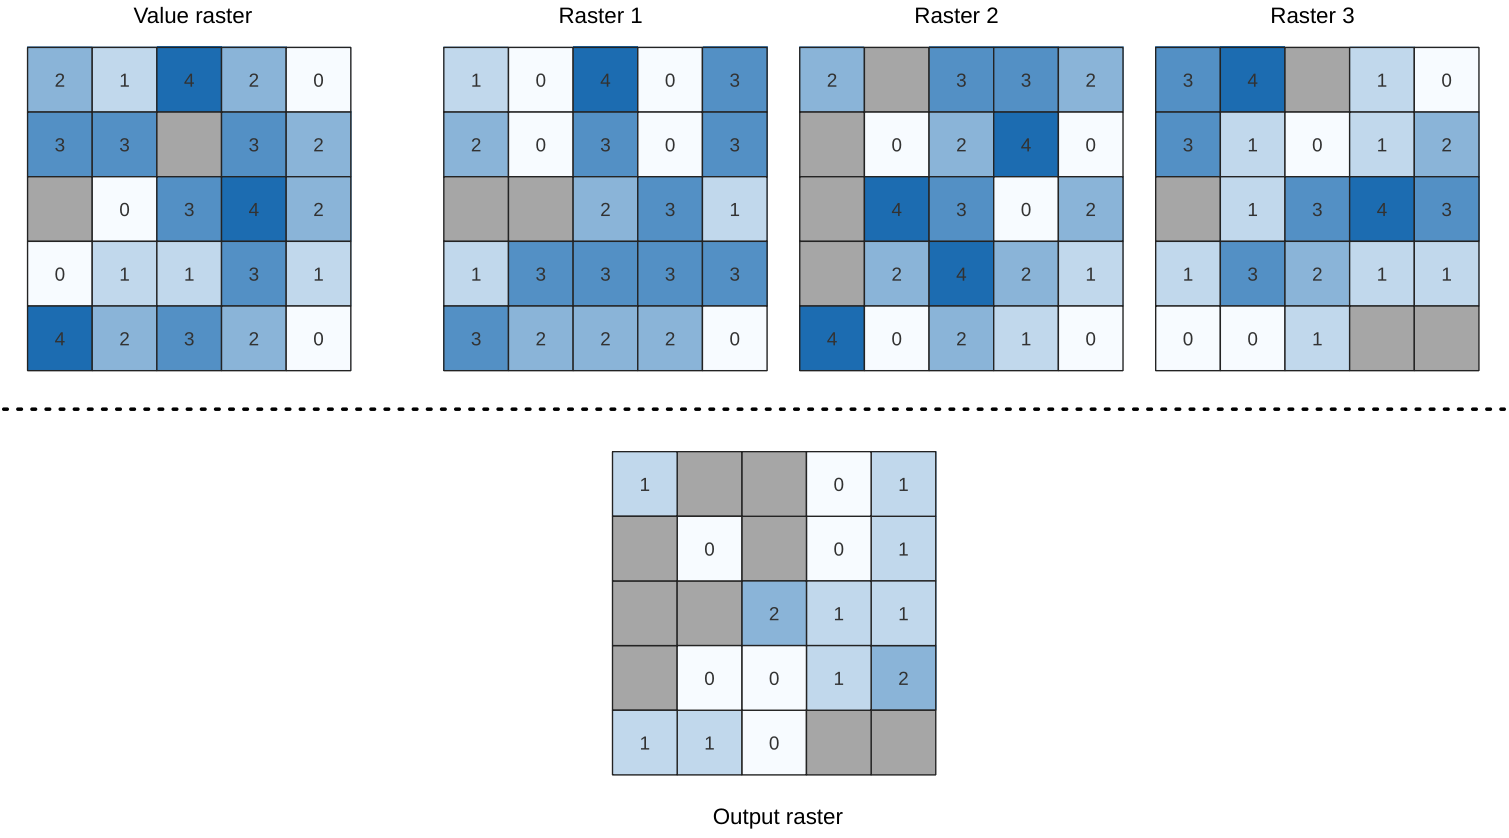
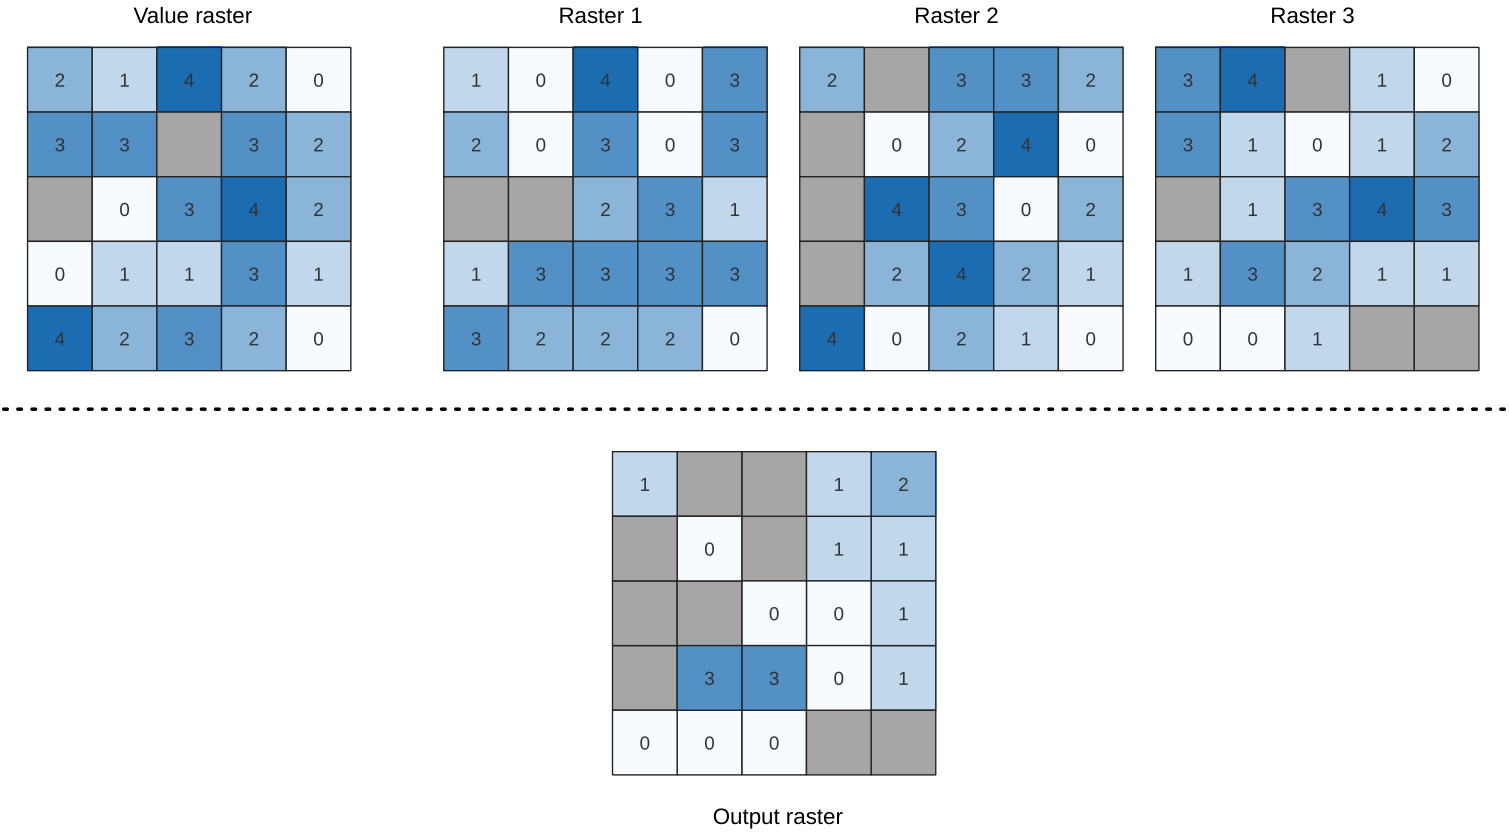
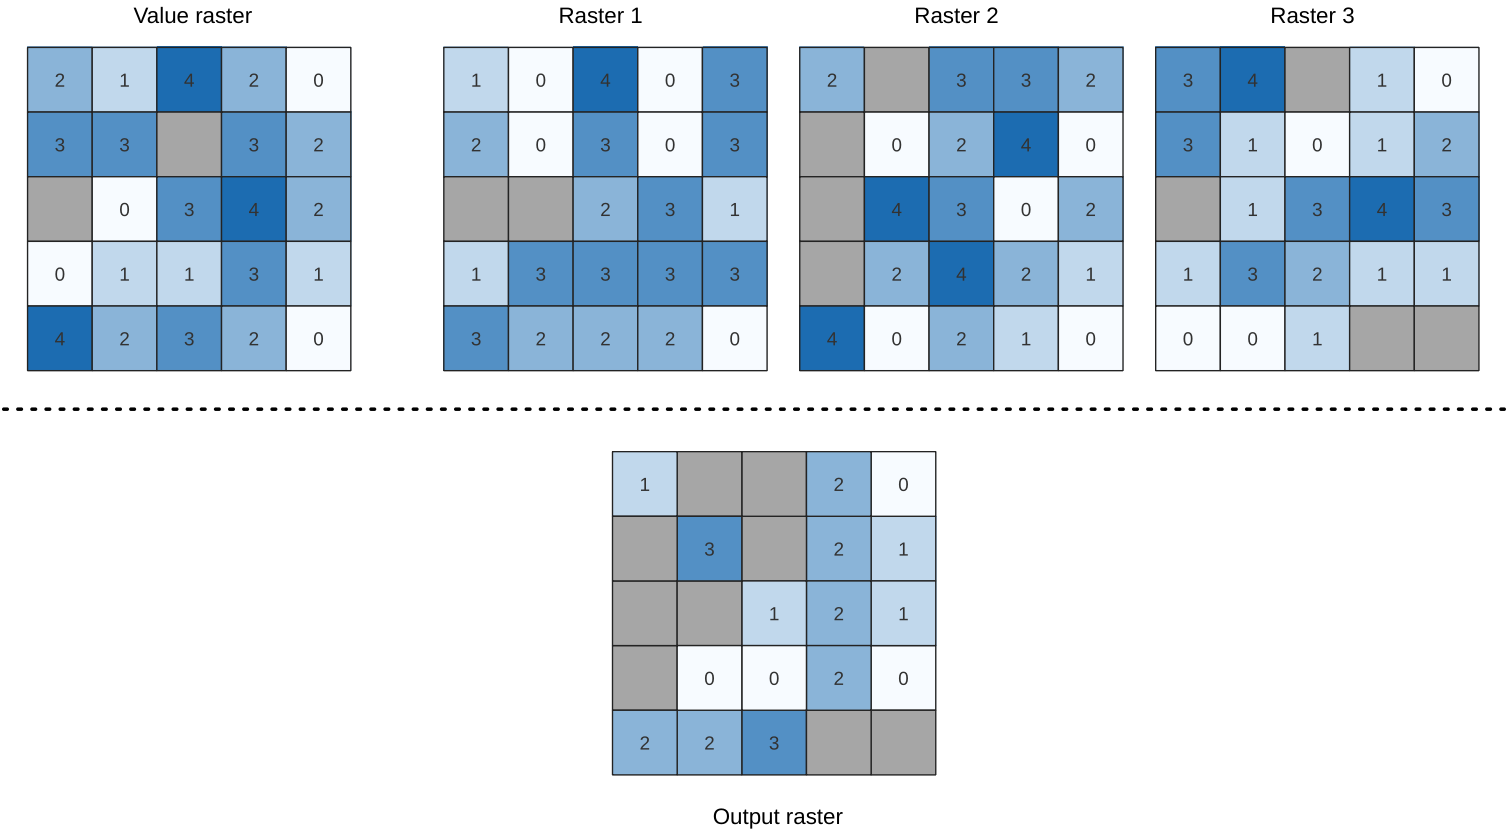
Calculates the cell-wise percentrank value of a stack of rasters based on an input value raster and writes them to an output raster.
At each cell location, the current value of the value raster is ranked among the respective values in the stack of all overlaid and sorted cell values of the input rasters. For values outside of the the stack value distribution, the algorithm returns NoData because the value cannot be ranked among the cell values.
There are two methods for percentile calculation:
Inclusive linear interpolation (PERCENTRANK.INC)
Exclusive linear interpolation (PERCENTRANK.EXC)
The linear interpolation methods return the unique values for different percentiles. Both interpolation methods follow their counterpart methods implemented by LibreOffice or Microsoft Excel.
The output raster’s extent and resolution is defined by a reference raster.
Input raster layers that do not match the cell size of the reference
raster layer will be resampled using nearest neighbor resampling.
NoData values in any of the input layers will result in a NoData cell output
if the „Ignore NoData values” parameter is not set.
The output raster data type will always be Float32.
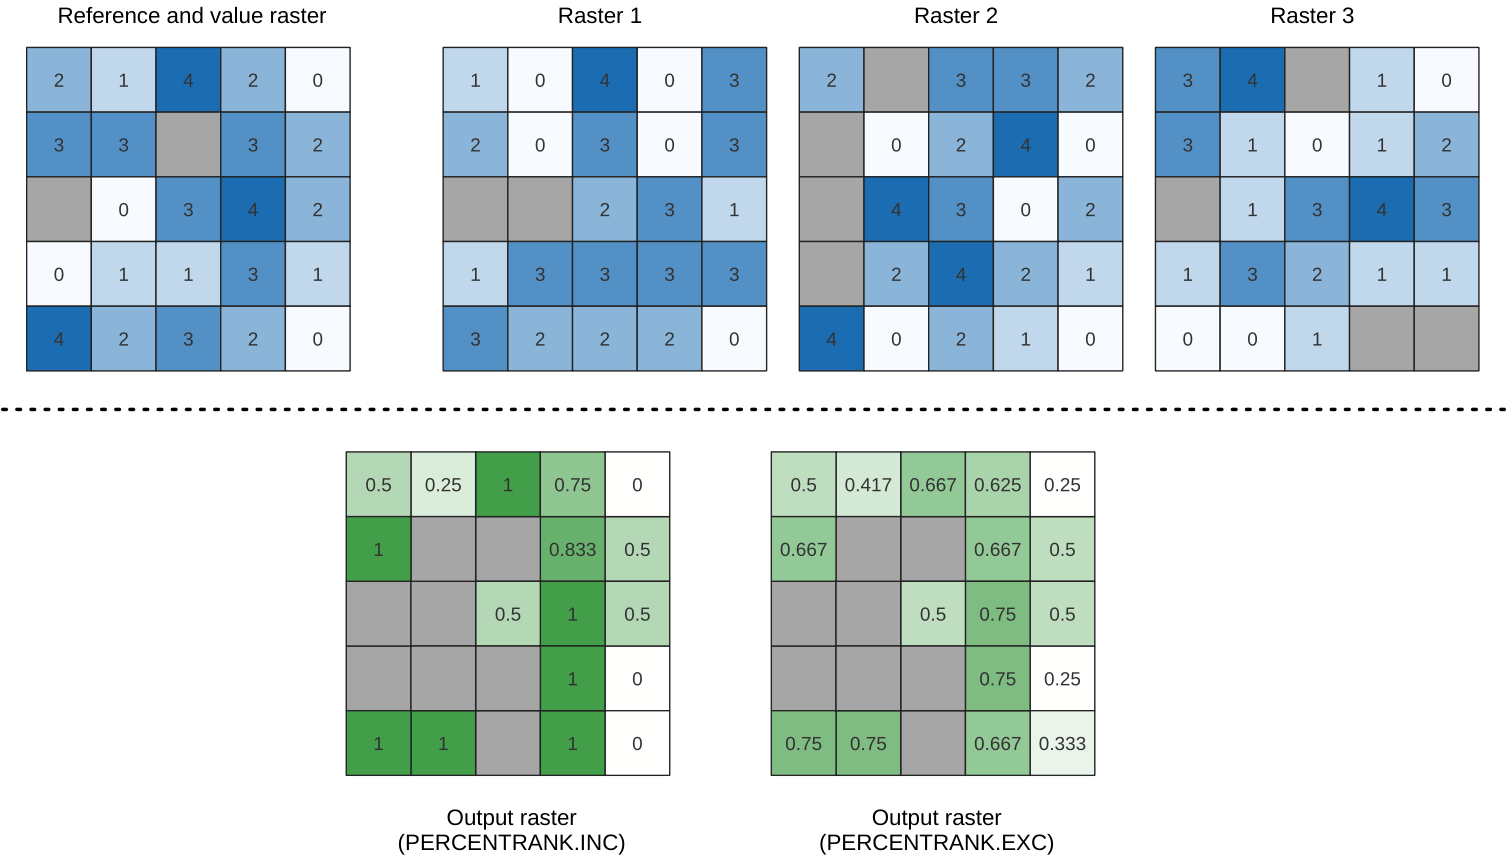
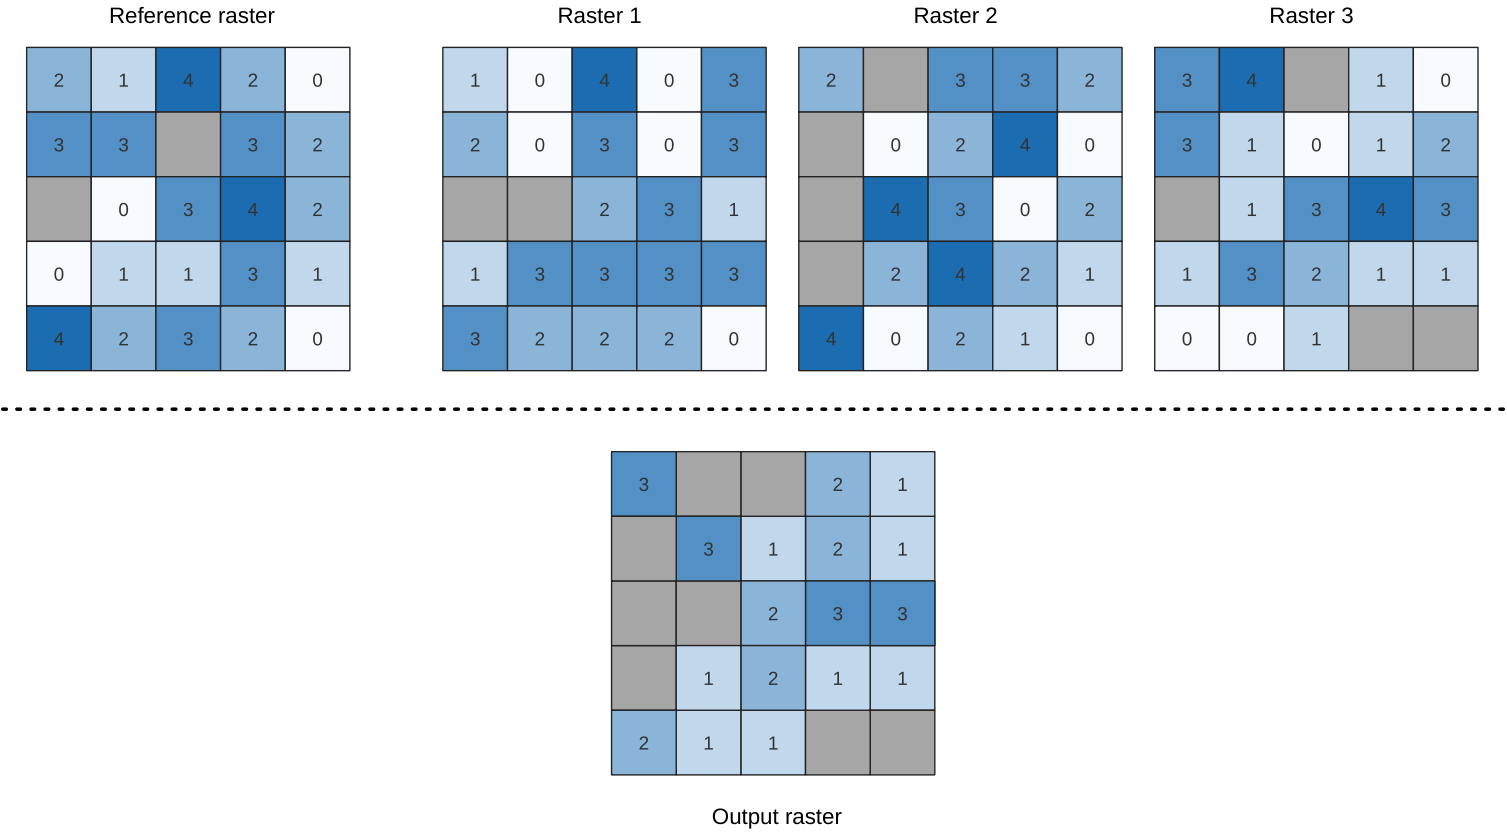
Rys. 24.21 Ranking the value raster layer cells. NoData cells (grey) are ignored.
Zobacz także
Parametry
Parametry podstawowe
Etykieta |
Nazwa |
Typ |
Opis |
|---|---|---|---|
Warstwy wejściowe |
|
[raster] [lista] |
Raster layers to evaluate. If multiband rasters are used in the data raster stack, the algorithm will always perform the analysis on the first band of the rasters |
Value raster layer |
|
[raster] |
The layer to rank the values among the stack of all overlaid layers |
Value raster band |
|
[numeric: integer] Domyślnie: 1 |
Band of the „value raster layer” to compare to |
Metoda |
|
[wyliczenie] Domyślnie: 0 |
Method for percentile calculation:
|
Ignore NoData values |
|
[wartość logiczna] Domyślnie: True |
If unchecked, any NoData cells in the input layers will result in a NoData cell in the output raster |
Warstwa referencyjna |
|
[raster] |
The reference layer for the output layer creation (extent, CRS, pixel dimensions) |
Warstwa wynikowa |
|
[same as input] Domyślnie: |
Specification of the output raster. One of:
|
Parametry zaawansowane
Etykieta |
Nazwa |
Typ |
Opis |
|---|---|---|---|
Output NoData value |
|
[numeric: double] Domyślnie: -9999.0 |
Value to use for NoData in the output layer |
Opcje generowania Opcjonalne |
|
[ciąg tekstowy] Domyślnie: «» |
For adding one or more creation options that control the raster to be created (colors, block size, file compression…). For convenience, you can rely on predefined profiles (see GDAL driver options section). Batch Process and Model Designer: separate multiple options with a pipe
character ( |
Wyniki
Etykieta |
Nazwa |
Typ |
Opis |
|---|---|---|---|
Warstwa wynikowa |
|
[raster] |
Output raster layer containing the result |
CRS authority identifier |
|
[ciąg tekstowy] |
The coordinate reference system of the output raster layer |
Zasięg |
|
[ciąg tekstowy] |
The spatial extent of the output raster layer |
Width in pixels |
|
[numeric: integer] |
The number of columns in the output raster layer |
Height in pixels |
|
[numeric: integer] |
The number of rows in the output raster layer |
Total pixel count |
|
[numeric: integer] |
The count of pixels in the output raster layer |
Kod pythona
ID algorytmu: native:cellstackpercentrankfromrasterlayer
import processing
processing.run("algorithm_id", {parameter_dictionary})
The algorithm id is displayed when you hover over the algorithm in the Processing Toolbox. The parameter dictionary provides the parameter NAMEs and values. See Using processing algorithms from the console for details on how to run processing algorithms from the Python console.
24.1.15.4. Cell statistics
Computes per-cell statistics based on input raster layers and for each cell writes the resulting statistics to an output raster. At each cell location, the output value is defined as a function of all overlaid cell values of the input rasters.
By default, a NoData cell in ANY of the input layers will result in a NoData cell in the output raster. If the Ignore NoData values option is checked, then NoData inputs will be ignored in the statistic calculation. This may result in NoData output for locations where all cells are NoData.
The Reference layer parameter specifies an existing raster layer to use as a reference when creating the output raster. The output raster will have the same extent, CRS, and pixel dimensions as this layer.
Calculation details:
Input raster layers that do not match the cell size of the reference
raster layer will be resampled using nearest neighbor resampling.
The output raster data type will be set to the most complex
data type present in the input datasets except when using the
functions Mean, Standard deviation and Variance (data type is always
Float32 or Float64 depending on input float type) or Count
and Variety (data type is always Int32).
Count: The count statistic will always result in the number of cells without NoData values at the current cell location.Median: If the number of input layers is even, the median will be calculated as the arithmetic mean of the two middle values of the ordered cell input values.Minority/Majority: If no unique minority or majority could be found, the result is NoData, except all input cell values are equal.
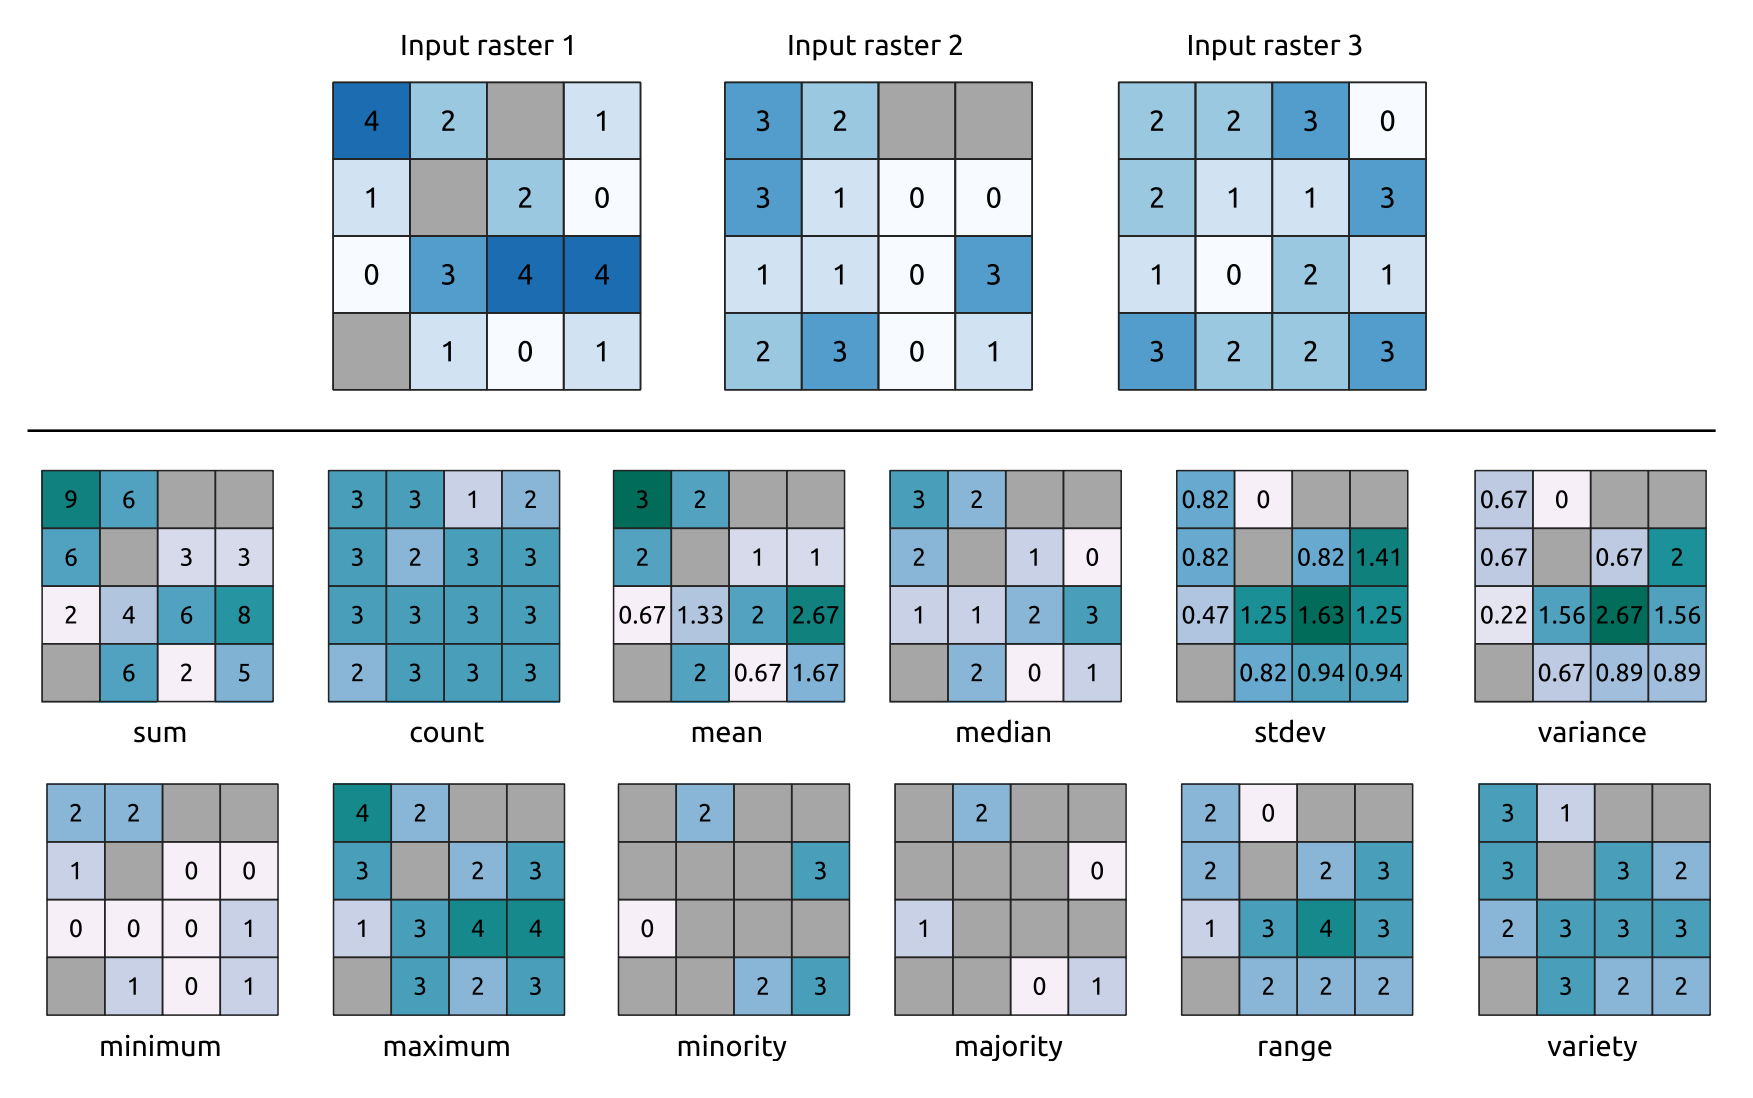
Rys. 24.22 Example with all the statistic functions. NoData cells (grey) are taken into account.
Parametry
Parametry podstawowe
Etykieta |
Nazwa |
Typ |
Opis |
|---|---|---|---|
Warstwy wejściowe |
|
[raster] [lista] |
Input raster layers |
Statistic |
|
[wyliczenie] Domyślnie: 0 |
Available statistics. Options:
|
Ignore NoData values |
|
[wartość logiczna] Domyślnie: True |
Calculate statistics also for all cells stacks, ignoring NoData occurrence. |
Warstwa referencyjna |
|
[raster] |
The reference layer to create the output layer from (extent, CRS, pixel dimensions) |
Warstwa wynikowa |
|
[same as input] Domyślnie: |
Specification of the output raster. One of:
|
Parametry zaawansowane
Etykieta |
Nazwa |
Typ |
Opis |
|---|---|---|---|
Output NoData value Opcjonalne |
|
[numeric: double] Domyślnie: -9999.0 |
Value to use for NoData in the output layer |
Opcje generowania Opcjonalne |
|
[ciąg tekstowy] Domyślnie: «» |
For adding one or more creation options that control the raster to be created (colors, block size, file compression…). For convenience, you can rely on predefined profiles (see GDAL driver options section). Batch Process and Model Designer: separate multiple options with a pipe
character ( |
Wyniki
Etykieta |
Nazwa |
Typ |
Opis |
|---|---|---|---|
CRS authority identifier |
|
[układ współrzędnych] |
The coordinate reference system of the output raster layer |
Zasięg |
|
[ciąg tekstowy] |
The spatial extent of the output raster layer |
Height in pixels |
|
[numeric: integer] |
The number of rows in the output raster layer |
Raster wyjściowy |
|
[raster] |
Output raster layer containing the result |
Total pixel count |
|
[numeric: integer] |
The count of pixels in the output raster layer |
Width in pixels |
|
[numeric: integer] |
The number of columns in the output raster layer |
Kod pythona
ID algorytmu: native:cellstatistics
import processing
processing.run("algorithm_id", {parameter_dictionary})
The algorithm id is displayed when you hover over the algorithm in the Processing Toolbox. The parameter dictionary provides the parameter NAMEs and values. See Using processing algorithms from the console for details on how to run processing algorithms from the Python console.
24.1.15.5. Equal to frequency
Evaluates on a cell-by-cell basis the frequency (number of times) the values
of an input stack of rasters are equal to the value of a value layer.
The output raster extent and resolution are defined by the input raster layer
and is always of Int32 type.
If multiband rasters are used in the data raster stack, the algorithm will always perform the analysis on the first band of the rasters - use GDAL to use other bands in the analysis. The output NoData value can be set manually.
Rys. 24.23 For each cell in the output raster, the value represents the number of times
that the corresponding cells in the list of rasters are the same as the value raster.
NoData cells (grey) are taken into account.
Zobacz także
Parametry
Parametry podstawowe
Etykieta |
Nazwa |
Typ |
Opis |
|---|---|---|---|
Input value raster |
|
[raster] |
The input value layer serves as reference layer for the sample layers |
Value raster band |
|
[raster band] Default: The first band of the raster layer |
Select the band you want to use as sample |
Input raster layers |
|
[raster] [lista] |
Raster layers to evaluate. If multiband rasters are used in the data raster stack, the algorithm will always perform the analysis on the first band of the rasters |
Ignore NoData values |
|
[wartość logiczna] Domyślnie: False |
If unchecked, any NoData cells in the value raster or the data layer stack will result in a NoData cell in the output raster |
Warstwa wynikowa |
|
[same as input] Domyślnie: |
Specification of the output raster. One of:
|
Parametry zaawansowane
Etykieta |
Nazwa |
Typ |
Opis |
|---|---|---|---|
Output NoData value Opcjonalne |
|
[numeric: double] Domyślnie: -9999.0 |
Value to use for NoData in the output layer |
Opcje generowania Opcjonalne |
|
[ciąg tekstowy] Domyślnie: «» |
For adding one or more creation options that control the raster to be created (colors, block size, file compression…). For convenience, you can rely on predefined profiles (see GDAL driver options section). Batch Process and Model Designer: separate multiple options with a pipe
character ( |
Wyniki
Etykieta |
Nazwa |
Typ |
Opis |
|---|---|---|---|
Warstwa wynikowa |
|
[raster] |
Output raster layer containing the result |
CRS authority identifier |
|
[ciąg tekstowy] |
The coordinate reference system of the output raster layer |
Zasięg |
|
[ciąg tekstowy] |
The spatial extent of the output raster layer |
Count of cells with equal value occurrences |
|
[numeric: integer] |
|
Height in pixels |
|
[numeric: integer] |
The number of rows in the output raster layer |
Total pixel count |
|
[numeric: integer] |
The count of pixels in the output raster layer |
Mean frequency at valid cell locations |
|
[numeric: double] |
|
Count of value occurrences |
|
[numeric: integer] |
|
Width in pixels |
|
[numeric: integer] |
The number of columns in the output raster layer |
Kod pythona
ID algorytmu: native:equaltofrequency
import processing
processing.run("algorithm_id", {parameter_dictionary})
The algorithm id is displayed when you hover over the algorithm in the Processing Toolbox. The parameter dictionary provides the parameter NAMEs and values. See Using processing algorithms from the console for details on how to run processing algorithms from the Python console.
24.1.15.6. Fuzzify raster (gaussian membership)
Transforms an input raster to a fuzzified raster by assigning a
membership value to each pixel, using a Gaussian membership function.
Membership values range from 0 to 1.
In the fuzzified raster, a value of 0 implies no membership of the
defined fuzzy set, whereas a value of 1 means full membership.
The gaussian membership function is defined as  ,
where f1 is the spread and f2 the midpoint.
,
where f1 is the spread and f2 the midpoint.
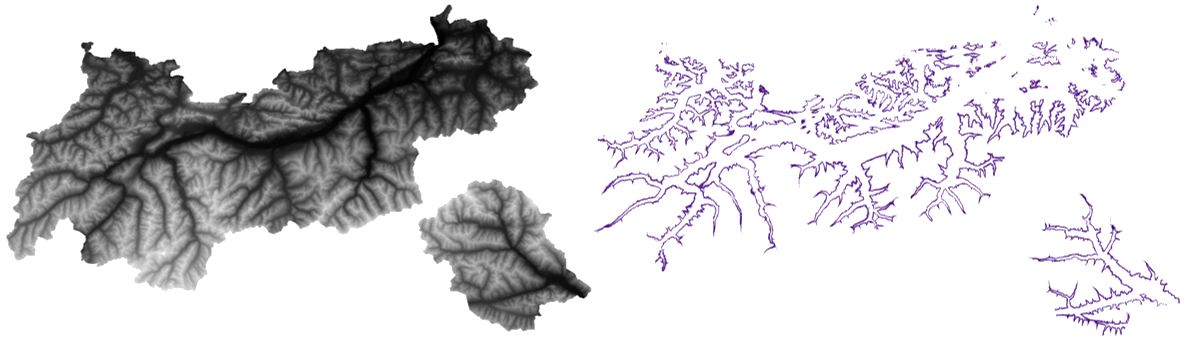
Rys. 24.24 Fuzzify raster example. Input raster source: Land Tirol - data.tirol.gv.at.
Zobacz także
Fuzzify raster (large membership), Fuzzify raster (linear membership), Fuzzify raster (near membership), Fuzzify raster (power membership), Fuzzify raster (small membership)
Parametry
Parametry podstawowe
Etykieta |
Nazwa |
Typ |
Opis |
|---|---|---|---|
Input Raster |
|
[raster] |
Input raster layer |
Band Number |
|
[raster band] Default: The first band of the raster layer |
If the raster is multiband, choose the band that you want to fuzzify. |
Function midpoint |
|
[numeric: double] Domyślnie: 10.0 |
Midpoint of the gaussian function |
Function spread |
|
[numeric: double] Domyślnie: 0.01 |
Spread of the gaussian function |
Fuzzified raster |
|
[same as input] Domyślnie: |
Specification of the output raster. One of:
|
Parametry zaawansowane
Etykieta |
Nazwa |
Typ |
Opis |
|---|---|---|---|
Opcje generowania Opcjonalne |
|
[ciąg tekstowy] Domyślnie: «» |
For adding one or more creation options that control the raster to be created (colors, block size, file compression…). For convenience, you can rely on predefined profiles (see GDAL driver options section). Batch Process and Model Designer: separate multiple options with a pipe
character ( |
Wyniki
Etykieta |
Nazwa |
Typ |
Opis |
|---|---|---|---|
Fuzzified raster |
|
[same as input] |
Output raster layer containing the result |
CRS authority identifier |
|
[układ współrzędnych] |
The coordinate reference system of the output raster layer |
Zasięg |
|
[ciąg tekstowy] |
The spatial extent of the output raster layer |
Width in pixels |
|
[numeric: integer] |
The number of columns in the output raster layer |
Height in pixels |
|
[numeric: integer] |
The number of rows in the output raster layer |
Total pixel count |
|
[numeric: integer] |
The count of pixels in the output raster layer |
Kod pythona
ID algorytmu: native:fuzzifyrastergaussianmembership
import processing
processing.run("algorithm_id", {parameter_dictionary})
The algorithm id is displayed when you hover over the algorithm in the Processing Toolbox. The parameter dictionary provides the parameter NAMEs and values. See Using processing algorithms from the console for details on how to run processing algorithms from the Python console.
24.1.15.7. Fuzzify raster (large membership)
Transforms an input raster to a fuzzified raster by assigning a
membership value to each pixel, using a Large membership function.
Membership values range from 0 to 1.
In the fuzzified raster, a value of 0 implies no membership of the
defined fuzzy set, whereas a value of 1 means full membership.
The large membership function is defined as  ,
where f1 is the spread and f2 the midpoint.
,
where f1 is the spread and f2 the midpoint.
Zobacz także
Fuzzify raster (gaussian membership), Fuzzify raster (linear membership), Fuzzify raster (near membership), Fuzzify raster (power membership), Fuzzify raster (small membership)
Parametry
Parametry podstawowe
Etykieta |
Nazwa |
Typ |
Opis |
|---|---|---|---|
Input Raster |
|
[raster] |
Input raster layer |
Band Number |
|
[raster band] Default: The first band of the raster layer |
If the raster is multiband, choose the band that you want to fuzzify. |
Function midpoint |
|
[numeric: double] Domyślnie: 50.0 |
Midpoint of the large function |
Function spread |
|
[numeric: double] Domyślnie: 5.0 |
Spread of the large function |
Fuzzified raster |
|
[same as input] Domyślnie: |
Specification of the output raster. One of:
|
Parametry zaawansowane
Etykieta |
Nazwa |
Typ |
Opis |
|---|---|---|---|
Opcje generowania Opcjonalne |
|
[ciąg tekstowy] Domyślnie: «» |
For adding one or more creation options that control the raster to be created (colors, block size, file compression…). For convenience, you can rely on predefined profiles (see GDAL driver options section). Batch Process and Model Designer: separate multiple options with a pipe
character ( |
Wyniki
Etykieta |
Nazwa |
Typ |
Opis |
|---|---|---|---|
Fuzzified raster |
|
[same as input] |
Output raster layer containing the result |
CRS authority identifier |
|
[układ współrzędnych] |
The coordinate reference system of the output raster layer |
Zasięg |
|
[ciąg tekstowy] |
The spatial extent of the output raster layer |
Width in pixels |
|
[numeric: integer] |
The number of columns in the output raster layer |
Height in pixels |
|
[numeric: integer] |
The number of rows in the output raster layer |
Total pixel count |
|
[numeric: integer] |
The count of pixels in the output raster layer |
Kod pythona
ID algorytmu: native:fuzzifyrasterlargemembership
import processing
processing.run("algorithm_id", {parameter_dictionary})
The algorithm id is displayed when you hover over the algorithm in the Processing Toolbox. The parameter dictionary provides the parameter NAMEs and values. See Using processing algorithms from the console for details on how to run processing algorithms from the Python console.
24.1.15.8. Fuzzify raster (linear membership)
Transforms an input raster to a fuzzified raster by assigning a
membership value to each pixel, using a Linear membership function.
Membership values range from 0 to 1. In the fuzzified raster, a value
of 0 implies no membership of the defined fuzzy set, whereas a value
of 1 means full membership.
The linear function is defined as  , where a
is the low bound and b the high bound. This equation assigns
membership values using a linear transformation for pixel values
between the low and high bounds.
Pixels values smaller than the low bound are given 0 membership
whereas pixel values greater than the high bound are given 1
membership.
, where a
is the low bound and b the high bound. This equation assigns
membership values using a linear transformation for pixel values
between the low and high bounds.
Pixels values smaller than the low bound are given 0 membership
whereas pixel values greater than the high bound are given 1
membership.
Zobacz także
Fuzzify raster (gaussian membership), Fuzzify raster (large membership), Fuzzify raster (near membership), Fuzzify raster (power membership), Fuzzify raster (small membership)
Parametry
Parametry podstawowe
Etykieta |
Nazwa |
Typ |
Opis |
|---|---|---|---|
Input Raster |
|
[raster] |
Input raster layer |
Band Number |
|
[raster band] Default: The first band of the raster layer |
If the raster is multiband, choose the band that you want to fuzzify. |
Low fuzzy membership bound |
|
[numeric: double] Domyślnie: 0.0 |
Low bound of the linear function |
High fuzzy membership bound |
|
[numeric: double] Domyślnie: 1.0 |
High bound of the linear function |
Fuzzified raster |
|
[same as input] Domyślnie: |
Specification of the output raster. One of:
|
Parametry zaawansowane
Etykieta |
Nazwa |
Typ |
Opis |
|---|---|---|---|
Opcje generowania Opcjonalne |
|
[ciąg tekstowy] Domyślnie: «» |
For adding one or more creation options that control the raster to be created (colors, block size, file compression…). For convenience, you can rely on predefined profiles (see GDAL driver options section). Batch Process and Model Designer: separate multiple options with a pipe
character ( |
Wyniki
Etykieta |
Nazwa |
Typ |
Opis |
|---|---|---|---|
Fuzzified raster |
|
[same as input] |
Output raster layer containing the result |
CRS authority identifier |
|
[układ współrzędnych] |
The coordinate reference system of the output raster layer |
Zasięg |
|
[ciąg tekstowy] |
The spatial extent of the output raster layer |
Width in pixels |
|
[numeric: integer] |
The number of columns in the output raster layer |
Height in pixels |
|
[numeric: integer] |
The number of rows in the output raster layer |
Total pixel count |
|
[numeric: integer] |
The count of pixels in the output raster layer |
Kod pythona
ID algorytmu: native:fuzzifyrasterlinearmembership
import processing
processing.run("algorithm_id", {parameter_dictionary})
The algorithm id is displayed when you hover over the algorithm in the Processing Toolbox. The parameter dictionary provides the parameter NAMEs and values. See Using processing algorithms from the console for details on how to run processing algorithms from the Python console.
24.1.15.9. Fuzzify raster (near membership)
Transforms an input raster to a fuzzified raster by assigning a
membership value to each pixel, using a Near membership function.
Membership values range from 0 to 1.
In the fuzzified raster, a value of 0 implies no membership of the
defined fuzzy set, whereas a value of 1 means full membership.
The near membership function is defined as  , where
f1 is the spread and f2 the midpoint.
, where
f1 is the spread and f2 the midpoint.
Zobacz także
Fuzzify raster (gaussian membership), Fuzzify raster (large membership), Fuzzify raster (linear membership), Fuzzify raster (power membership), Fuzzify raster (small membership)
Parametry
Parametry podstawowe
Etykieta |
Nazwa |
Typ |
Opis |
|---|---|---|---|
Input Raster |
|
[raster] |
Input raster layer |
Band Number |
|
[raster band] Default: The first band of the raster layer |
If the raster is multiband, choose the band that you want to fuzzify. |
Function midpoint |
|
[numeric: double] Domyślnie: 50.0 |
Midpoint of the near function |
Function spread |
|
[numeric: double] Domyślnie: 0.01 |
Spread of the near function |
Fuzzified raster |
|
[same as input] Domyślnie: |
Specification of the output raster. One of:
|
Parametry zaawansowane
Etykieta |
Nazwa |
Typ |
Opis |
|---|---|---|---|
Opcje generowania Opcjonalne |
|
[ciąg tekstowy] Domyślnie: «» |
For adding one or more creation options that control the raster to be created (colors, block size, file compression…). For convenience, you can rely on predefined profiles (see GDAL driver options section). Batch Process and Model Designer: separate multiple options with a pipe
character ( |
Wyniki
Etykieta |
Nazwa |
Typ |
Opis |
|---|---|---|---|
Fuzzified raster |
|
[same as input] |
Output raster layer containing the result |
CRS authority identifier |
|
[układ współrzędnych] |
The coordinate reference system of the output raster layer |
Zasięg |
|
[ciąg tekstowy] |
The spatial extent of the output raster layer |
Width in pixels |
|
[numeric: integer] |
The number of columns in the output raster layer |
Height in pixels |
|
[numeric: integer] |
The number of rows in the output raster layer |
Total pixel count |
|
[numeric: integer] |
The count of pixels in the output raster layer |
Kod pythona
ID algorytmu: native:fuzzifyrasternearmembership
import processing
processing.run("algorithm_id", {parameter_dictionary})
The algorithm id is displayed when you hover over the algorithm in the Processing Toolbox. The parameter dictionary provides the parameter NAMEs and values. See Using processing algorithms from the console for details on how to run processing algorithms from the Python console.
24.1.15.10. Fuzzify raster (power membership)
Transforms an input raster to a fuzzified raster by assigning a
membership value to each pixel, using a Power membership function.
Membership values range from 0 to 1.
In the fuzzified raster, a value of 0 implies no membership of the
defined fuzzy set, whereas a value of 1 means full membership.
The power function is defined as  , where a is the
low bound, b is the high bound, and f1 the exponent.
This equation assigns membership values using the power transformation
for pixel values between the low and high bounds.
Pixels values smaller than the low bound are given 0 membership
whereas pixel values greater than the high bound are given 1
membership.
, where a is the
low bound, b is the high bound, and f1 the exponent.
This equation assigns membership values using the power transformation
for pixel values between the low and high bounds.
Pixels values smaller than the low bound are given 0 membership
whereas pixel values greater than the high bound are given 1
membership.
Zobacz także
Fuzzify raster (gaussian membership), Fuzzify raster (large membership), Fuzzify raster (linear membership), Fuzzify raster (near membership), Fuzzify raster (small membership)
Parametry
Parametry podstawowe
Etykieta |
Nazwa |
Typ |
Opis |
|---|---|---|---|
Input Raster |
|
[raster] |
Input raster layer |
Band Number |
|
[raster band] Default: The first band of the raster layer |
If the raster is multiband, choose the band that you want to fuzzify. |
Low fuzzy membership bound |
|
[numeric: double] Domyślnie: 0.0 |
Low bound of the power function |
High fuzzy membership bound |
|
[numeric: double] Domyślnie: 1.0 |
High bound of the power function |
High fuzzy membership bound |
|
[numeric: double] Domyślnie: 2.0 |
Exponent of the power function |
Fuzzified raster |
|
[same as input] Domyślnie: |
Specification of the output raster. One of:
|
Parametry zaawansowane
Etykieta |
Nazwa |
Typ |
Opis |
|---|---|---|---|
Opcje generowania Opcjonalne |
|
[ciąg tekstowy] Domyślnie: «» |
For adding one or more creation options that control the raster to be created (colors, block size, file compression…). For convenience, you can rely on predefined profiles (see GDAL driver options section). Batch Process and Model Designer: separate multiple options with a pipe
character ( |
Wyniki
Etykieta |
Nazwa |
Typ |
Opis |
|---|---|---|---|
Fuzzified raster |
|
[same as input] |
Output raster layer containing the result |
CRS authority identifier |
|
[układ współrzędnych] |
The coordinate reference system of the output raster layer |
Zasięg |
|
[ciąg tekstowy] |
The spatial extent of the output raster layer |
Width in pixels |
|
[numeric: integer] |
The number of columns in the output raster layer |
Height in pixels |
|
[numeric: integer] |
The number of rows in the output raster layer |
Total pixel count |
|
[numeric: integer] |
The count of pixels in the output raster layer |
Kod pythona
ID algorytmu: native:fuzzifyrasterpowermembership
import processing
processing.run("algorithm_id", {parameter_dictionary})
The algorithm id is displayed when you hover over the algorithm in the Processing Toolbox. The parameter dictionary provides the parameter NAMEs and values. See Using processing algorithms from the console for details on how to run processing algorithms from the Python console.
24.1.15.11. Fuzzify raster (small membership)
Transforms an input raster to a fuzzified raster by assigning a
membership value to each pixel, using a Small membership function.
Membership values range from 0 to 1.
In the fuzzified raster, a value of 0 implies no membership of the
defined fuzzy set, whereas a value of 1 means full membership.
The small membership function is defined as  , where
f1 is the spread and f2 the midpoint.
, where
f1 is the spread and f2 the midpoint.
Zobacz także
Fuzzify raster (gaussian membership), Fuzzify raster (large membership) Fuzzify raster (linear membership), Fuzzify raster (near membership), Fuzzify raster (power membership)
Parametry
Parametry podstawowe
Etykieta |
Nazwa |
Typ |
Opis |
|---|---|---|---|
Input Raster |
|
[raster] |
Input raster layer |
Band Number |
|
[raster band] Default: The first band of the raster layer |
If the raster is multiband, choose the band that you want to fuzzify. |
Function midpoint |
|
[numeric: double] Domyślnie: 50.0 |
Midpoint of the small function |
Function spread |
|
[numeric: double] Domyślnie: 5.0 |
Spread of the small function |
Fuzzified raster |
|
[same as input] Domyślnie: |
Specification of the output raster. One of:
|
Parametry zaawansowane
Etykieta |
Nazwa |
Typ |
Opis |
|---|---|---|---|
Opcje generowania Opcjonalne |
|
[ciąg tekstowy] Domyślnie: «» |
For adding one or more creation options that control the raster to be created (colors, block size, file compression…). For convenience, you can rely on predefined profiles (see GDAL driver options section). Batch Process and Model Designer: separate multiple options with a pipe
character ( |
Wyniki
Etykieta |
Nazwa |
Typ |
Opis |
|---|---|---|---|
Fuzzified raster |
|
[same as input] |
Output raster layer containing the result |
CRS authority identifier |
|
[układ współrzędnych] |
The coordinate reference system of the output raster layer |
Zasięg |
|
[ciąg tekstowy] |
The spatial extent of the output raster layer |
Width in pixels |
|
[numeric: integer] |
The number of columns in the output raster layer |
Height in pixels |
|
[numeric: integer] |
The number of rows in the output raster layer |
Total pixel count |
|
[numeric: integer] |
The count of pixels in the output raster layer |
Kod pythona
ID algorytmu: native:fuzzifyrastersmallmembership
import processing
processing.run("algorithm_id", {parameter_dictionary})
The algorithm id is displayed when you hover over the algorithm in the Processing Toolbox. The parameter dictionary provides the parameter NAMEs and values. See Using processing algorithms from the console for details on how to run processing algorithms from the Python console.
24.1.15.12. Greater than frequency
Evaluates on a cell-by-cell basis the frequency (number of times) the values
of an input stack of rasters are equal to the value of a value raster.
The output raster extent and resolution is defined by the input raster layer
and is always of Int32 type.
If multiband rasters are used in the data raster stack, the algorithm will always perform the analysis on the first band of the rasters - use GDAL to use other bands in the analysis. The output NoData value can be set manually.
Rys. 24.25 For each cell in the output raster, the value represents the number of times
that the corresponding cells in the list of rasters are greater than the value raster.
NoData cells (grey) are taken into account.
Zobacz także
Parametry
Parametry podstawowe
Etykieta |
Nazwa |
Typ |
Opis |
|---|---|---|---|
Input value raster |
|
[raster] |
The input value layer serves as reference layer for the sample layers |
Value raster band |
|
[raster band] Default: The first band of the raster layer |
Select the band you want to use as sample |
Input raster layers |
|
[raster] [lista] |
Raster layers to evaluate. If multiband rasters are used in the data raster stack, the algorithm will always perform the analysis on the first band of the rasters |
Ignore NoData values |
|
[wartość logiczna] Domyślnie: False |
If unchecked, any NoData cells in the value raster or the data layer stack will result in a NoData cell in the output raster |
Warstwa wynikowa |
|
[same as input] Domyślnie: |
Specification of the output raster. One of:
|
Parametry zaawansowane
Etykieta |
Nazwa |
Typ |
Opis |
|---|---|---|---|
Output NoData value Opcjonalne |
|
[numeric: double] Domyślnie: -9999.0 |
Value to use for NoData in the output layer |
Opcje generowania Opcjonalne |
|
[ciąg tekstowy] Domyślnie: «» |
For adding one or more creation options that control the raster to be created (colors, block size, file compression…). For convenience, you can rely on predefined profiles (see GDAL driver options section). Batch Process and Model Designer: separate multiple options with a pipe
character ( |
Wyniki
Etykieta |
Nazwa |
Typ |
Opis |
|---|---|---|---|
Warstwa wynikowa |
|
[raster] |
Output raster layer containing the result |
CRS authority identifier |
|
[ciąg tekstowy] |
The coordinate reference system of the output raster layer |
Zasięg |
|
[ciąg tekstowy] |
The spatial extent of the output raster layer |
Count of cells with equal value occurrences |
|
[numeric: integer] |
|
Height in pixels |
|
[numeric: integer] |
The number of rows in the output raster layer |
Total pixel count |
|
[numeric: integer] |
The count of pixels in the output raster layer |
Mean frequency at valid cell locations |
|
[numeric: double] |
|
Count of value occurrences |
|
[numeric: integer] |
|
Width in pixels |
|
[numeric: integer] |
The number of columns in the output raster layer |
Kod pythona
ID algorytmu: native:greaterthanfrequency
import processing
processing.run("algorithm_id", {parameter_dictionary})
The algorithm id is displayed when you hover over the algorithm in the Processing Toolbox. The parameter dictionary provides the parameter NAMEs and values. See Using processing algorithms from the console for details on how to run processing algorithms from the Python console.
24.1.15.13. Highest position in raster stack
Evaluates on a cell-by-cell basis the position of the raster with the highest value in a stack of rasters. Position counts start with 1 and range to the total number of input rasters. The order of the input rasters is relevant for the algorithm. If multiple rasters feature the highest value, the first raster will be used for the position value.
If multiband rasters are used in the data raster stack, the algorithm will
always perform the analysis on the first band of the rasters - use GDAL to use
other bands in the analysis.
Any NoData cells in the raster layer stack will result in a NoData cell
in the output raster unless the „ignore NoData” parameter is checked.
The output NoData value can be set manually. The output rasters extent and
resolution is defined by a reference raster layer and is always of Int32 type.
Zobacz także
Parametry
Parametry podstawowe
Etykieta |
Nazwa |
Typ |
Opis |
|---|---|---|---|
Input raster layers |
|
[raster] [lista] |
List of raster layers to compare with |
Warstwa referencyjna |
|
[raster] |
The reference layer for the output layer creation (extent, CRS, pixel dimensions) |
Ignore NoData values |
|
[wartość logiczna] Domyślnie: False |
If unchecked, any NoData cells in the data layer stack will result in a NoData cell in the output raster |
Warstwa wynikowa |
|
[raster] Domyślnie: |
Specification of the output raster containing the result. One of:
|
Parametry zaawansowane
Etykieta |
Nazwa |
Typ |
Opis |
|---|---|---|---|
Output NoData value |
|
[numeric: double] Domyślnie: -9999.0 |
Value to use for NoData in the output layer |
Opcje generowania Opcjonalne |
|
[ciąg tekstowy] Domyślnie: «» |
For adding one or more creation options that control the raster to be created (colors, block size, file compression…). For convenience, you can rely on predefined profiles (see GDAL driver options section). Batch Process and Model Designer: separate multiple options with a pipe
character ( |
Wyniki
Etykieta |
Nazwa |
Typ |
Opis |
|---|---|---|---|
Warstwa wynikowa |
|
[raster] |
Output raster layer containing the result |
CRS authority identifier |
|
[ciąg tekstowy] |
The coordinate reference system of the output raster layer |
Zasięg |
|
[ciąg tekstowy] |
The spatial extent of the output raster layer |
Width in pixels |
|
[numeric: integer] |
The number of columns in the output raster layer |
Height in pixels |
|
[numeric: integer] |
The number of rows in the output raster layer |
Total pixel count |
|
[numeric: integer] |
The count of pixels in the output raster layer |
Kod pythona
ID algorytmu: native:highestpositioninrasterstack
import processing
processing.run("algorithm_id", {parameter_dictionary})
The algorithm id is displayed when you hover over the algorithm in the Processing Toolbox. The parameter dictionary provides the parameter NAMEs and values. See Using processing algorithms from the console for details on how to run processing algorithms from the Python console.
24.1.15.14. Less than frequency
Evaluates on a cell-by-cell basis the frequency (number of times) the values
of an input stack of rasters are less than the value of a value raster.
The output raster extent and resolution is defined by the input raster layer
and is always of Int32 type.
If multiband rasters are used in the data raster stack, the algorithm will always perform the analysis on the first band of the rasters - use GDAL to use other bands in the analysis. The output NoData value can be set manually.
Rys. 24.26 For each cell in the output raster, the value represents the number of times
that the corresponding cells in the list of rasters are less than the value raster.
NoData cells (grey) are taken into account.
Zobacz także
Parametry
Parametry podstawowe
Etykieta |
Nazwa |
Typ |
Opis |
|---|---|---|---|
Input value raster |
|
[raster] |
The input value layer serves as reference layer for the sample layers |
Value raster band |
|
[raster band] Default: The first band of the raster layer |
Select the band you want to use as sample |
Input raster layers |
|
[raster] [lista] |
Raster layers to evaluate. If multiband rasters are used in the data raster stack, the algorithm will always perform the analysis on the first band of the rasters |
Ignore NoData values |
|
[wartość logiczna] Domyślnie: False |
If unchecked, any NoData cells in the value raster or the data layer stack will result in a NoData cell in the output raster |
Warstwa wynikowa |
|
[same as input] Domyślnie: |
Specification of the output raster. One of:
|
Parametry zaawansowane
Etykieta |
Nazwa |
Typ |
Opis |
|---|---|---|---|
Output NoData value Opcjonalne |
|
[numeric: double] Domyślnie: -9999.0 |
Value to use for NoData in the output layer |
Opcje generowania Opcjonalne |
|
[ciąg tekstowy] Domyślnie: «» |
For adding one or more creation options that control the raster to be created (colors, block size, file compression…). For convenience, you can rely on predefined profiles (see GDAL driver options section). Batch Process and Model Designer: separate multiple options with a pipe
character ( |
Wyniki
Etykieta |
Nazwa |
Typ |
Opis |
|---|---|---|---|
Warstwa wynikowa |
|
[raster] |
Output raster layer containing the result |
CRS authority identifier |
|
[ciąg tekstowy] |
The coordinate reference system of the output raster layer |
Zasięg |
|
[ciąg tekstowy] |
The spatial extent of the output raster layer |
Count of cells with equal value occurrences |
|
[numeric: integer] |
|
Height in pixels |
|
[numeric: integer] |
The number of rows in the output raster layer |
Total pixel count |
|
[numeric: integer] |
The count of pixels in the output raster layer |
Mean frequency at valid cell locations |
|
[numeric: double] |
|
Count of value occurrences |
|
[numeric: integer] |
|
Width in pixels |
|
[numeric: integer] |
The number of columns in the output raster layer |
Kod pythona
ID algorytmu: native:lessthanfrequency
import processing
processing.run("algorithm_id", {parameter_dictionary})
The algorithm id is displayed when you hover over the algorithm in the Processing Toolbox. The parameter dictionary provides the parameter NAMEs and values. See Using processing algorithms from the console for details on how to run processing algorithms from the Python console.
24.1.15.15. Lowest position in raster stack
Evaluates on a cell-by-cell basis the position of the raster with the lowest value in a stack of rasters. Position counts start with 1 and range to the total number of input rasters. The order of the input rasters is relevant for the algorithm. If multiple rasters feature the lowest value, the first raster will be used for the position value.
If multiband rasters are used in the data raster stack, the algorithm will
always perform the analysis on the first band of the rasters - use GDAL to use
other bands in the analysis.
Any NoData cells in the raster layer stack will result in a NoData cell
in the output raster unless the „ignore NoData” parameter is checked.
The output NoData value can be set manually. The output rasters extent and
resolution is defined by a reference raster layer and is always of Int32 type.

Zobacz także
Parametry
Parametry podstawowe
Etykieta |
Nazwa |
Typ |
Opis |
|---|---|---|---|
Input raster layers |
|
[raster] [lista] |
List of raster layers to compare with |
Warstwa referencyjna |
|
[raster] |
The reference layer for the output layer creation (extent, CRS, pixel dimensions) |
Ignore NoData values |
|
[wartość logiczna] Domyślnie: False |
If unchecked, any NoData cells in the data layer stack will result in a NoData cell in the output raster |
Warstwa wynikowa |
|
[raster] Domyślnie: |
Specification of the output raster containing the result. One of:
|
Parametry zaawansowane
Etykieta |
Nazwa |
Typ |
Opis |
|---|---|---|---|
Output NoData value |
|
[numeric: double] Domyślnie: -9999.0 |
Value to use for NoData in the output layer |
Opcje generowania Opcjonalne |
|
[ciąg tekstowy] Domyślnie: «» |
For adding one or more creation options that control the raster to be created (colors, block size, file compression…). For convenience, you can rely on predefined profiles (see GDAL driver options section). Batch Process and Model Designer: separate multiple options with a pipe
character ( |
Wyniki
Etykieta |
Nazwa |
Typ |
Opis |
|---|---|---|---|
Warstwa wynikowa |
|
[raster] |
Output raster layer containing the result |
CRS authority identifier |
|
[ciąg tekstowy] |
The coordinate reference system of the output raster layer |
Zasięg |
|
[ciąg tekstowy] |
The spatial extent of the output raster layer |
Width in pixels |
|
[numeric: integer] |
The number of columns in the output raster layer |
Height in pixels |
|
[numeric: integer] |
The number of rows in the output raster layer |
Total pixel count |
|
[numeric: integer] |
The count of pixels in the output raster layer |
Kod pythona
ID algorytmu: native:lowestpositioninrasterstack
import processing
processing.run("algorithm_id", {parameter_dictionary})
The algorithm id is displayed when you hover over the algorithm in the Processing Toolbox. The parameter dictionary provides the parameter NAMEs and values. See Using processing algorithms from the console for details on how to run processing algorithms from the Python console.
24.1.15.16. Raster boolean AND
Calculates the boolean AND for a set of input rasters.
If all of the input rasters have a non-zero value for a pixel, that
pixel will be set to 1 in the output raster.
If any of the input rasters have 0 values for the pixel it will
be set to 0 in the output raster.
The reference layer parameter specifies an existing raster layer to use as a reference when creating the output raster. The output raster will have the same extent, CRS, and pixel dimensions as this layer.
By default, a NoData pixel in ANY of the input layers will result in a
NoData pixel in the output raster.
If the Treat NoData values as false option is checked,
then NoData inputs will be treated the same as a 0 input value.
Zobacz także
Parametry
Parametry podstawowe
Etykieta |
Nazwa |
Typ |
Opis |
|---|---|---|---|
Warstwy wejściowe |
|
[raster] [lista] |
List of input raster layers |
Warstwa referencyjna |
|
[raster] |
The reference layer to create the output layer from (extent, CRS, pixel dimensions) |
Treat NoData values as false |
|
[wartość logiczna] Domyślnie: False |
Treat NoData values in the input files as 0 when performing the operation |
Warstwa wynikowa |
|
[raster] Domyślnie: |
Specification of the output raster containing the result. One of:
|
Parametry zaawansowane
Etykieta |
Nazwa |
Typ |
Opis |
|---|---|---|---|
Output NoData value |
|
[numeric: double] Domyślnie: -9999.0 |
Value to use for NoData in the output layer |
Output data type |
|
[wyliczenie] Domyślnie: 5 |
Output raster data type. Options:
Available options depend on the GDAL version built with QGIS (see menu) |
Opcje generowania Opcjonalne |
|
[ciąg tekstowy] Domyślnie: «» |
For adding one or more creation options that control the raster to be created (colors, block size, file compression…). For convenience, you can rely on predefined profiles (see GDAL driver options section). Batch Process and Model Designer: separate multiple options with a pipe
character ( |
Wyniki
Etykieta |
Nazwa |
Typ |
Opis |
|---|---|---|---|
Zasięg |
|
[ciąg tekstowy] |
The spatial extent of the output raster layer |
CRS authority identifier |
|
[układ współrzędnych] |
The coordinate reference system of the output raster layer |
Width in pixels |
|
[numeric: integer] |
The number of columns in the output raster layer |
Height in pixels |
|
[numeric: integer] |
The number of rows in the output raster layer |
Total pixel count |
|
[numeric: integer] |
The count of pixels in the output raster layer |
NoData pixel count |
|
[numeric: integer] |
The count of NoData pixels in the output raster layer |
True pixel count |
|
[numeric: integer] |
The count of True pixels (value = 1) in the output raster layer |
False pixel count |
|
[numeric: integer] |
The count of False pixels (value = 0) in the output raster layer |
Warstwa wynikowa |
|
[raster] |
Output raster layer containing the result |
Kod pythona
ID algorytmu: native:rasterbooleanand
import processing
processing.run("algorithm_id", {parameter_dictionary})
The algorithm id is displayed when you hover over the algorithm in the Processing Toolbox. The parameter dictionary provides the parameter NAMEs and values. See Using processing algorithms from the console for details on how to run processing algorithms from the Python console.
24.1.15.17. Raster boolean OR
Calculates the boolean OR for a set of input rasters.
If all of the input rasters have a zero value for a pixel, that
pixel will be set to 0 in the output raster.
If any of the input rasters have 1 values for the pixel it will
be set to 1 in the output raster.
The reference layer parameter specifies an existing raster layer to use as a reference when creating the output raster. The output raster will have the same extent, CRS, and pixel dimensions as this layer.
By default, a NoData pixel in ANY of the input layers will result in a
NoData pixel in the output raster.
If the Treat NoData values as false option is checked,
then NoData inputs will be treated the same as a 0 input value.
Zobacz także
Parametry
Parametry podstawowe
Etykieta |
Nazwa |
Typ |
Opis |
|---|---|---|---|
Warstwy wejściowe |
|
[raster] [lista] |
List of input raster layers |
Warstwa referencyjna |
|
[raster] |
The reference layer to create the output layer from (extent, CRS, pixel dimensions) |
Treat NoData values as false |
|
[wartość logiczna] Domyślnie: False |
Treat NoData values in the input files as 0 when performing the operation |
Warstwa wynikowa |
|
[raster] Domyślnie: |
Specification of the output raster containing the result. One of:
|
Parametry zaawansowane
Etykieta |
Nazwa |
Typ |
Opis |
|---|---|---|---|
Output NoData value |
|
[numeric: double] Domyślnie: -9999.0 |
Value to use for NoData in the output layer |
Output data type |
|
[wyliczenie] Domyślnie: 5 |
Output raster data type. Options:
Available options depend on the GDAL version built with QGIS (see menu) |
Opcje generowania Opcjonalne |
|
[ciąg tekstowy] Domyślnie: «» |
For adding one or more creation options that control the raster to be created (colors, block size, file compression…). For convenience, you can rely on predefined profiles (see GDAL driver options section). Batch Process and Model Designer: separate multiple options with a pipe
character ( |
Wyniki
Etykieta |
Nazwa |
Typ |
Opis |
|---|---|---|---|
Zasięg |
|
[ciąg tekstowy] |
The spatial extent of the output raster layer |
CRS authority identifier |
|
[układ współrzędnych] |
The coordinate reference system of the output raster layer |
Width in pixels |
|
[numeric: integer] |
The number of columns in the output raster layer |
Height in pixels |
|
[numeric: integer] |
The number of rows in the output raster layer |
Total pixel count |
|
[numeric: integer] |
The count of pixels in the output raster layer |
NoData pixel count |
|
[numeric: integer] |
The count of NoData pixels in the output raster layer |
True pixel count |
|
[numeric: integer] |
The count of True pixels (value = 1) in the output raster layer |
False pixel count |
|
[numeric: integer] |
The count of False pixels (value = 0) in the output raster layer |
Warstwa wynikowa |
|
[raster] |
Output raster layer containing the result |
Kod pythona
ID algorytmu: native:rasterbooleanor
import processing
processing.run("algorithm_id", {parameter_dictionary})
The algorithm id is displayed when you hover over the algorithm in the Processing Toolbox. The parameter dictionary provides the parameter NAMEs and values. See Using processing algorithms from the console for details on how to run processing algorithms from the Python console.
24.1.15.18. Raster calculator
Performs algebraic operations using raster layers.
The resulting layer will have its values computed according to an expression. The expression can contain numerical values, operators and references to any of the layers in the current project.
Zobacz także
Raster calculator (virtual), Raster calculator, Raster Calculator
Parametry
Etykieta |
Nazwa |
Typ |
Opis |
|---|---|---|---|
Warstwy wejściowe |
|
[raster] [lista] |
List of input raster layers |
Wyrażenie |
|
[wyrażenie] |
Raster-based expression that will be used to calculate the output raster layer. |
Output extent Opcjonalne |
|
[zasięg] |
Specify the spatial extent of the output raster layer. If the extent is not specified, the minimum extent that covers all the selected reference layers will be used. Available methods are:
|
Output cell size (leave empty to set automatically) Opcjonalne |
|
[numeric: double] |
Cell size of the output raster layer. If the cell size is not specified, the minimum cell size of the selected reference layer(s) will be used. The cell size will be the same for the X and Y axes. |
Output CRS Opcjonalne |
|
[układ współrzędnych] |
CRS of the output raster layer. If the output CRS is not specified, the CRS of the first reference layer will be used. |
Obliczone |
|
[raster] Domyślnie: |
Specification of the output raster. One of:
|
Wyniki
Etykieta |
Nazwa |
Typ |
Opis |
|---|---|---|---|
Obliczone |
|
[raster] |
Output raster file with the calculated values. |
Kod pythona
ID algorytmu: native:rastercalc
import processing
processing.run("algorithm_id", {parameter_dictionary})
The algorithm id is displayed when you hover over the algorithm in the Processing Toolbox. The parameter dictionary provides the parameter NAMEs and values. See Using processing algorithms from the console for details on how to run processing algorithms from the Python console.
24.1.15.19. Raster calculator (virtual)
Performs algebraic operations using raster layers and generates in-memory result.
The resulting layer will have its values computed according to an expression. The expression can contain numerical values, operators and references to any of the layers in the current project.
A virtual raster layer is a raster layer defined by its URI and whose pixels are calculated on-the-fly. It’s not a new file on disk; the virtual layer is still connected to the rasters used in the calculation meaning that deleting or moving these rasters would break it. A Layer name can be provided, otherwise the calculation expression is used as such. Removing the virtual layer from the project deletes it, and it can be made persistent in file using the layer contextual menu.
Zobacz także
Parametry
Etykieta |
Nazwa |
Typ |
Opis |
|---|---|---|---|
Warstwy wejściowe |
|
[raster] [lista] |
List of input raster layers |
Wyrażenie |
|
[wyrażenie] |
Raster-based expression that will be used to calculate the output raster layer. |
Output extent Opcjonalne |
|
[zasięg] |
Specify the spatial extent of the output raster layer. If the extent is not specified, the minimum extent that covers all the selected reference layers will be used. Available methods are:
|
Output cell size (leave empty to set automatically) Opcjonalne |
|
[numeric: double] |
Cell size of the output raster layer. If the cell size is not specified, the minimum cell size of the selected reference layer(s) will be used. The cell size will be the same for the X and Y axes. |
Output CRS Opcjonalne |
|
[układ współrzędnych] |
CRS of the output raster layer. If the output CRS is not specified, the CRS of the first reference layer will be used. |
Output layer name Opcjonalne |
|
[ciąg tekstowy] |
The name to assign to the generated layer. If not set, the text of the calculation expression is used. |
Wyniki
Etykieta |
Nazwa |
Typ |
Opis |
|---|---|---|---|
Obliczone |
|
[raster] |
Output virtual raster layer with the calculated values. |
Kod pythona
ID algorytmu: native:virtualrastercalc
import processing
processing.run("algorithm_id", {parameter_dictionary})
The algorithm id is displayed when you hover over the algorithm in the Processing Toolbox. The parameter dictionary provides the parameter NAMEs and values. See Using processing algorithms from the console for details on how to run processing algorithms from the Python console.
24.1.15.20. Raster layer properties
Returns basic properties of the given raster layer, including the extent, size in pixels and dimensions of pixels (in map units), number of bands, and NoData value.
This algorithm is intended for use as a means of extracting these useful properties to use as the input values to other algorithms in a model - e.g. to allow to pass an existing raster’s pixel sizes over to a GDAL raster algorithm.
Parametry
Etykieta |
Nazwa |
Typ |
Opis |
|---|---|---|---|
Warstwa wejściowa |
|
[raster] |
Input raster layer |
Band number Opcjonalne |
|
[raster band] Domyślnie: Nie ustawiono |
Whether to also return properties of a specific band. If a band is specified, the noData value for the selected band is also returned. |
Wyniki
Etykieta |
Nazwa |
Typ |
Opis |
|---|---|---|---|
Number of bands in raster |
|
[numeric: integer] |
The number of bands in the raster |
CRS authority identifier |
|
[ciąg tekstowy] |
The coordinate reference system of the output raster layer |
Zasięg |
|
[ciąg tekstowy] |
The raster layer extent in the CRS |
Band has a NoData value set |
|
[wartość logiczna] |
Indicates whether the raster layer has a value set for NoData pixels in the selected band |
Height in pixels |
|
[numeric: integer] |
The number of columns in the raster layer |
Band NoData value |
|
[numeric: double] |
The value (if set) of the NoData pixels in the selected band |
Pixel size (height) in map units |
|
[numeric: integer] |
Vertical size in map units of the pixel |
Pixel size (width) in map units |
|
[numeric: integer] |
Horizontal size in map units of the pixel |
Width in pixels |
|
[numeric: integer] |
The number of rows in the raster layer |
Maximum x-coordinate |
|
[numeric: double] |
|
Minimum x-coordinate |
|
[numeric: double] |
|
Maximum y-coordinate |
|
[numeric: double] |
|
Minimum y-coordinate |
|
[numeric: double] |
Kod pythona
ID algorytmu: native:rasterlayerproperties
import processing
processing.run("algorithm_id", {parameter_dictionary})
The algorithm id is displayed when you hover over the algorithm in the Processing Toolbox. The parameter dictionary provides the parameter NAMEs and values. See Using processing algorithms from the console for details on how to run processing algorithms from the Python console.
24.1.15.21. Raster layer statistics
Calculates basic statistics from the values in a given band of the raster layer. The output is loaded in the menu.
Parametry
Etykieta |
Nazwa |
Typ |
Opis |
|---|---|---|---|
Warstwa wejściowa |
|
[raster] |
Input raster layer |
Band number |
|
[raster band] Default: The first band of the input layer |
If the raster is multiband, choose the band you want to get statistics for. |
Statystyki |
|
[html] Domyślnie: |
Specification of the output file:
|
Wyniki
Etykieta |
Nazwa |
Typ |
Opis |
|---|---|---|---|
Maximum value |
|
[numeric: double] |
|
Mean value |
|
[numeric: double] |
|
Minimum value |
|
[numeric: double] |
|
Statystyki |
|
[html] |
The output file contains the following information:
|
Zakres |
|
[numeric: double] |
|
Standard deviation |
|
[numeric: double] |
|
Suma |
|
[numeric: double] |
|
Sum of the squares |
|
[numeric: double] |
Kod pythona
ID algorytmu: native:rasterlayerstatistics
import processing
processing.run("algorithm_id", {parameter_dictionary})
The algorithm id is displayed when you hover over the algorithm in the Processing Toolbox. The parameter dictionary provides the parameter NAMEs and values. See Using processing algorithms from the console for details on how to run processing algorithms from the Python console.
24.1.15.22. Raster layer unique values report
Returns the count and area of each unique value in a given raster layer. The calculation of the area is done in the area unit of the layer’s CRS.
Parametry
Etykieta |
Nazwa |
Typ |
Opis |
|---|---|---|---|
Warstwa wejściowa |
|
[raster] |
Input raster layer |
Band number |
|
[raster band] Default: The first band of the input layer |
If the raster is multiband, choose the band you want to get statistics for. |
Unique values report |
|
[plik] Domyślnie: |
Specification of the output file:
|
Unique values table |
|
[vector: table] Default: |
Specification of the table for unique values:
The file encoding can also be changed here. |
Wyniki
Etykieta |
Nazwa |
Typ |
Opis |
|---|---|---|---|
CRS authority identifier |
|
[ciąg tekstowy] |
The coordinate reference system of the output raster layer |
Zasięg |
|
[ciąg tekstowy] |
The spatial extent of the output raster layer |
Height in pixels |
|
[numeric: integer] |
The number of rows in the output raster layer |
NoData pixel count |
|
[numeric: integer] |
The number of NoData pixels in the output raster layer |
Total pixel count |
|
[numeric: integer] |
The count of pixels in the output raster layer |
Unique values report |
|
[html] |
The output HTML file contains the following information:
|
Unique values table |
|
[vector: table] |
A table with three columns:
|
Width in pixels |
|
[numeric: integer] |
The number of columns in the output raster layer |
Kod pythona
ID algorytmu: native:rasterlayeruniquevaluesreport
import processing
processing.run("algorithm_id", {parameter_dictionary})
The algorithm id is displayed when you hover over the algorithm in the Processing Toolbox. The parameter dictionary provides the parameter NAMEs and values. See Using processing algorithms from the console for details on how to run processing algorithms from the Python console.
24.1.15.23. Raster layer zonal statistics
Calculates statistics for a raster layer’s values, categorized by zones defined in another raster layer.
Zobacz także
Parametry
Parametry podstawowe
Etykieta |
Nazwa |
Typ |
Opis |
|---|---|---|---|
Warstwa wejściowa |
|
[raster] |
Input raster layer |
Band number |
|
[raster band] Default: The first band of the raster layer |
If the raster is multiband choose the band for which you want to calculate the statistics. |
Zones layer |
|
[raster] |
Raster layer defining zones. Zones are given by contiguous pixels having the same pixel value. |
Zones band number |
|
[raster band] Default: The first band of the raster layer |
If the raster is multiband, choose the band that defines the zones |
Statystyki |
|
[vector: table] Default: |
Specification of the output report. One of:
The file encoding can also be changed here. |
Parametry zaawansowane
Etykieta |
Nazwa |
Typ |
Opis |
|---|---|---|---|
Warstwa referencyjna Opcjonalne |
|
[wyliczenie] Domyślnie: 0 |
Raster layer used to calculate the centroids that will be used as reference when determining the zones in the output layer. One of:
|
Wyniki
Etykieta |
Nazwa |
Typ |
Opis |
|---|---|---|---|
CRS authority identifier |
|
[ciąg tekstowy] |
The coordinate reference system of the output raster layer |
Zasięg |
|
[ciąg tekstowy] |
The spatial extent of the output raster layer |
Height in pixels |
|
[numeric: integer] |
The number of rows in the output raster layer |
NoData pixel count |
|
[numeric: integer] |
The number of NoData pixels in the output raster layer |
Statystyki |
|
[vector: table] |
The output layer contains the following information for each zone:
|
Total pixel count |
|
[numeric: integer] |
The count of pixels in the output raster layer |
Width in pixels |
|
[numeric: integer] |
The number of columns in the output raster layer |
Kod pythona
ID algorytmu: native:rasterlayerzonalstats
import processing
processing.run("algorithm_id", {parameter_dictionary})
The algorithm id is displayed when you hover over the algorithm in the Processing Toolbox. The parameter dictionary provides the parameter NAMEs and values. See Using processing algorithms from the console for details on how to run processing algorithms from the Python console.
24.1.15.24. Raster surface volume
Calculates the volume under a raster surface relative to a given base level. This is mainly useful for Digital Elevation Models (DEM).
Parametry
Etykieta |
Nazwa |
Typ |
Opis |
|---|---|---|---|
Warstwa wejściowa |
|
[raster] |
Input raster, representing a surface |
Band number |
|
[raster band] Default: The first band of the raster layer |
If the raster is multiband, choose the band that shall define the surface. |
Base level |
|
[numeric: double] Domyślnie: 0.0 |
Define a base or reference value.
This base is used in the volume calculation according to the
|
Metoda |
|
[wyliczenie] Domyślnie: 0 |
Define the method for the volume calculation given by the
difference between the raster pixel value and the
|
Surface volume report |
|
[html] Domyślnie: |
Specification of the output HTML report. One of:
The file encoding can also be changed here. |
Surface volume table |
|
[vector: table] Default: |
Specification of the output table. One of:
The file encoding can also be changed here. |
Wyniki
Etykieta |
Nazwa |
Typ |
Opis |
|---|---|---|---|
Volume |
|
[numeric: double] |
The calculated volume |
Obszar |
|
[numeric: double] |
The area in square map units |
Pixel_count |
|
[numeric: integer] |
The total number of pixels that have been analyzed |
Surface volume report |
|
[html] |
The output report (containing volume, area and pixel count) in HTML format |
Surface volume table |
|
[vector: table] |
The output table (containing volume, area and pixel count) |
Kod pythona
ID algorytmu: native:rastersurfacevolume
import processing
processing.run("algorithm_id", {parameter_dictionary})
The algorithm id is displayed when you hover over the algorithm in the Processing Toolbox. The parameter dictionary provides the parameter NAMEs and values. See Using processing algorithms from the console for details on how to run processing algorithms from the Python console.
24.1.15.25. Reclassify by layer
Reclassifies a raster band by assigning new class values based on the ranges specified in a vector table.
Parametry
Parametry podstawowe
Etykieta |
Nazwa |
Typ |
Opis |
|---|---|---|---|
Raster layer |
|
[raster] |
Raster layer to reclassify |
Band number |
|
[raster band] Default: The first band of the raster layer |
If the raster is multiband, choose the band you want to reclassify. |
Layer containing class breaks |
|
[vector: any] |
Vector layer containing the values to use for classification. |
Minimum class value field |
|
[tablefield: numeric] |
Field with the minimum value of the range for the class.
Use |
Maximum class value field |
|
[tablefield: numeric] |
Field with the maximum value of the range for the class.
Use |
Output value field |
|
[tablefield: numeric] |
Field with the value that will be assigned to the pixels that
fall in the class (between the corresponding min and max values).
Use |
Reclassified raster |
|
[raster] Domyślnie: |
Specification of the output raster. One of:
|
Parametry zaawansowane
Etykieta |
Nazwa |
Typ |
Opis |
|---|---|---|---|
Output NoData value |
|
[numeric: double] Domyślnie: -9999.0 |
Value to apply to NoData values. |
Range boundaries |
|
[wyliczenie] Domyślnie: 0 |
Defines comparison rules for the classification. Options:
|
Use NoData when no range matches value |
|
[wartość logiczna] Domyślnie: False |
Applies the NoData value to band values that do not fall in any class. If False, the original value is kept. |
Output data type |
|
[wyliczenie] Domyślnie: 5 |
Defines the format of the output raster file. Options:
Available options depend on the GDAL version built with QGIS (see menu) |
Opcje generowania Opcjonalne |
|
[ciąg tekstowy] Domyślnie: «» |
For adding one or more creation options that control the raster to be created (colors, block size, file compression…). For convenience, you can rely on predefined profiles (see GDAL driver options section). Batch Process and Model Designer: separate multiple options with a pipe
character ( |
Wyniki
Etykieta |
Nazwa |
Typ |
Opis |
|---|---|---|---|
Reclassified raster |
|
[raster] |
Output raster layer with reclassified band values |
Kod pythona
ID algorytmu: native:reclassifybylayer
import processing
processing.run("algorithm_id", {parameter_dictionary})
The algorithm id is displayed when you hover over the algorithm in the Processing Toolbox. The parameter dictionary provides the parameter NAMEs and values. See Using processing algorithms from the console for details on how to run processing algorithms from the Python console.
24.1.15.26. Reclassify by table
Reclassifies a raster band by assigning new class values based on the ranges specified in a fixed table.
Parametry
Parametry podstawowe
Etykieta |
Nazwa |
Typ |
Opis |
|---|---|---|---|
Raster layer |
|
[raster] |
Raster layer to reclassify |
Band number |
|
[raster band] Domyślnie: 1 |
Raster band for which you want to recalculate values. |
Reclassification table |
|
[vector: table] |
A 3-columns table to fill with the values to set the boundaries
of each class ( |
Reclassified raster |
|
[raster] Domyślnie: |
Specification of the output raster layer. One of:
|
Parametry zaawansowane
Etykieta |
Nazwa |
Typ |
Opis |
|---|---|---|---|
Output NoData value |
|
[numeric: double] Domyślnie: -9999.0 |
Value to apply to NoData values. |
Range boundaries |
|
[wyliczenie] Domyślnie: 0 |
Defines comparison rules for the classification. Options:
|
Use NoData when no range matches value |
|
[wartość logiczna] Domyślnie: False |
Applies the NoData value to band values that do not fall in any class. If False, the original value is kept. |
Output data type |
|
[wyliczenie] Domyślnie: 5 |
Defines the format of the output raster file. Options:
Available options depend on the GDAL version built with QGIS (see menu) |
Opcje generowania Opcjonalne |
|
[ciąg tekstowy] Domyślnie: «» |
For adding one or more creation options that control the raster to be created (colors, block size, file compression…). For convenience, you can rely on predefined profiles (see GDAL driver options section). Batch Process and Model Designer: separate multiple options with a pipe
character ( |
Wyniki
Etykieta |
Nazwa |
Typ |
Opis |
|---|---|---|---|
Reclassified raster |
|
[raster] |
Output raster layer with reclassified band values |
Kod pythona
ID algorytmu: native:reclassifybytable
import processing
processing.run("algorithm_id", {parameter_dictionary})
The algorithm id is displayed when you hover over the algorithm in the Processing Toolbox. The parameter dictionary provides the parameter NAMEs and values. See Using processing algorithms from the console for details on how to run processing algorithms from the Python console.
24.1.15.27. Rescale raster
Rescales raster layer to a new value range, while preserving the shape (distribution) of the raster’s histogram (pixel values). Input values are mapped using a linear interpolation from the source raster’s minimum and maximum pixel values to the destination minimum and miximum pixel range.
By default the algorithm preserves the original NoData value, but there is an option to override it.
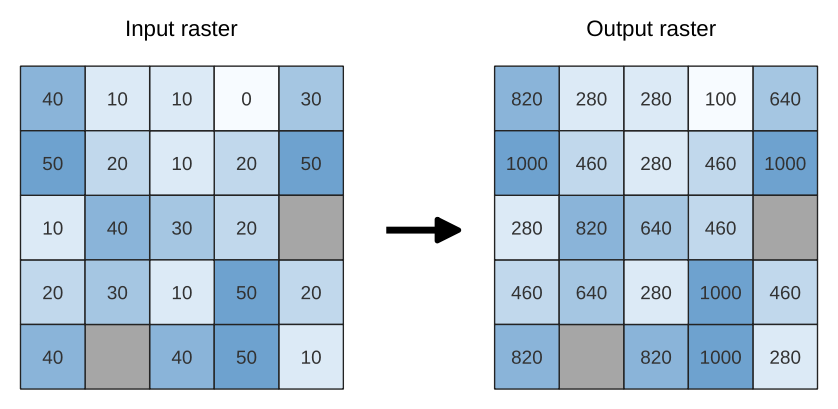
Rys. 24.27 Rescaling values of a raster layer from [0 - 50] to [100 - 1000]
Parametry
Parametry podstawowe
Etykieta |
Nazwa |
Typ |
Opis |
|---|---|---|---|
Input Raster |
|
[raster] |
Raster layer to use for rescaling |
Band number |
|
[raster band] Default: The first band of the input layer |
If the raster is multiband, choose a band. |
New minimum value |
|
[numeric: double] Default value: 0.0 |
Minimum pixel value to use in the rescaled layer |
New maximum value |
|
[numeric: double] Default value: 255.0 |
Maximum pixel value to use in the rescaled layer |
New NoData value Opcjonalne |
|
[numeric: double] Default value: Not set |
Value to assign to the NoData pixels. If unset, original NoData values are preserved. |
Rescaled |
|
[raster] Domyślnie: |
Specification of the output raster layer. One of:
|
Parametry zaawansowane
Etykieta |
Nazwa |
Typ |
Opis |
|---|---|---|---|
Opcje generowania Opcjonalne |
|
[ciąg tekstowy] Domyślnie: «» |
For adding one or more creation options that control the raster to be created (colors, block size, file compression…). For convenience, you can rely on predefined profiles (see GDAL driver options section). Batch Process and Model Designer: separate multiple options with a pipe
character ( |
Wyniki
Etykieta |
Nazwa |
Typ |
Opis |
|---|---|---|---|
Rescaled |
|
[raster] |
Output raster layer with rescaled band values |
Kod pythona
ID algorytmu: native:rescaleraster
import processing
processing.run("algorithm_id", {parameter_dictionary})
The algorithm id is displayed when you hover over the algorithm in the Processing Toolbox. The parameter dictionary provides the parameter NAMEs and values. See Using processing algorithms from the console for details on how to run processing algorithms from the Python console.
24.1.15.28. Round raster
Rounds the cell values of a raster dataset according to the specified number of decimals.
Alternatively, a negative number of decimal places may be used to round values to powers of a base n. For example, with a Base value n of 10 and Decimal places of -1, the algorithm rounds cell values to multiples of 10, -2 rounds to multiples of 100, and so on. Arbitrary base values may be chosen, the algorithm applies the same multiplicative principle. Rounding cell values to multiples of a base n may be used to generalize raster layers.
The algorithm preserves the data type of the input raster. Therefore byte/integer rasters can only be rounded to multiples of a base n, otherwise a warning is raised and the raster gets copied as byte/integer raster.
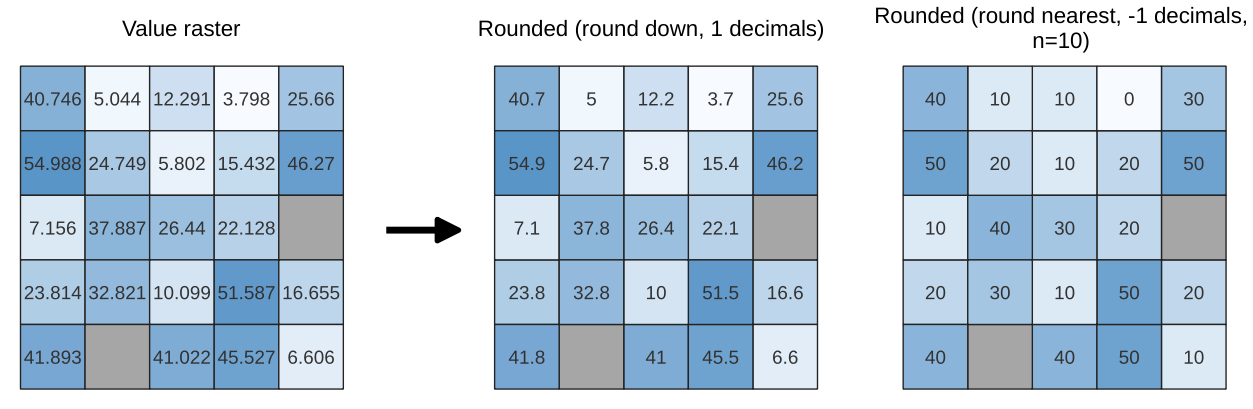
Rys. 24.28 Rounding values of a raster
Parametry
Parametry podstawowe
Etykieta |
Nazwa |
Typ |
Opis |
|---|---|---|---|
Raster wejściowy |
|
[raster] |
The raster to process. |
Band number |
|
[raster band] Domyślnie: 1 |
The band of the raster |
Rounding direction |
|
[lista] Domyślnie: 1 |
How to choose the target rounded value. Options are:
|
Number of decimals places |
|
[numeric: integer] Domyślnie: 2 |
Number of decimals places to round to. Use negative values to round cell values to a multiple of a base n |
Raster wyjściowy |
|
[raster] Domyślnie: |
Specification of the output file. One of:
|
Parametry zaawansowane
Etykieta |
Nazwa |
Typ |
Opis |
|---|---|---|---|
Base n for rounding to multiples of n |
|
[numeric: integer] Domyślnie: 10 |
When the |
Opcje generowania Opcjonalne |
|
[ciąg tekstowy] Domyślnie: «» |
For adding one or more creation options that control the raster to be created (colors, block size, file compression…). For convenience, you can rely on predefined profiles (see GDAL driver options section). Batch Process and Model Designer: separate multiple options with a pipe
character ( |
Wyniki
Etykieta |
Nazwa |
Typ |
Opis |
|---|---|---|---|
Raster wyjściowy |
|
[raster] |
The output raster layer with values rounded for the selected band. |
Kod pythona
ID algorytmu: native:roundrastervalues
import processing
processing.run("algorithm_id", {parameter_dictionary})
The algorithm id is displayed when you hover over the algorithm in the Processing Toolbox. The parameter dictionary provides the parameter NAMEs and values. See Using processing algorithms from the console for details on how to run processing algorithms from the Python console.
24.1.15.29. Sample raster values
Extracts raster values at the point locations. If the raster layer is multiband, each band is sampled.
The attribute table of the resulting layer will have as many new columns as the raster layer band count.
Parametry
Etykieta |
Nazwa |
Typ |
Opis |
|---|---|---|---|
Warstwa wejściowa |
|
[vector: point] |
Point vector layer to use for sampling |
Raster Layer |
|
[raster] |
Raster layer to sample at the given point locations. |
Output column prefix |
|
[ciąg tekstowy] Domyślnie: «SAMPLE_» |
Prefix for the names of the added columns. |
Sampled Opcjonalne |
|
[vector: point] Default: |
Specify the output layer containing the sampled values. One of:
The file encoding can also be changed here. |
Wyniki
Etykieta |
Nazwa |
Typ |
Opis |
|---|---|---|---|
Sampled |
|
[vector: point] |
The output layer containing the sampled values. |
Kod pythona
ID algorytmu: native:rastersampling
import processing
processing.run("algorithm_id", {parameter_dictionary})
The algorithm id is displayed when you hover over the algorithm in the Processing Toolbox. The parameter dictionary provides the parameter NAMEs and values. See Using processing algorithms from the console for details on how to run processing algorithms from the Python console.
24.1.15.30. Zonal histogram
Appends fields representing counts of each unique value from a raster layer contained within polygon features.
The output layer attribute table will have as many fields as the unique values of the raster layer that intersects the polygon(s).
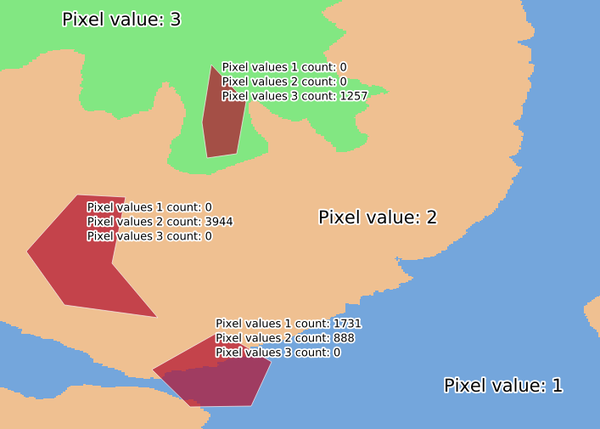
Rys. 24.29 Raster layer histogram example
Parametry
Etykieta |
Nazwa |
Typ |
Opis |
|---|---|---|---|
Raster layer |
|
[raster] |
Input raster layer. |
Band number |
|
[raster band] Default: The first band of the input layer |
If the raster is multiband, choose a band. |
Vector layer containing zones |
|
[vector: polygon] |
Vector polygon layer that defines the zones. |
Output column prefix |
Opcjonalne |
[ciąg tekstowy] Domyślnie: «HISTO_» |
Prefix for the output columns names. |
Output zones |
|
[vector: polygon] Default: |
Specify the output vector polygon layer. One of:
The file encoding can also be changed here. |
Wyniki
Etykieta |
Nazwa |
Typ |
Opis |
|---|---|---|---|
Output zones |
|
[vector: polygon] |
The output vector polygon layer. |
Kod pythona
ID algorytmu: native:zonalhistogram
import processing
processing.run("algorithm_id", {parameter_dictionary})
The algorithm id is displayed when you hover over the algorithm in the Processing Toolbox. The parameter dictionary provides the parameter NAMEs and values. See Using processing algorithms from the console for details on how to run processing algorithms from the Python console.
24.1.15.31. Zonal statistics
Calculates statistics of a raster layer for each feature of an overlapping polygon vector layer.
Parametry
Etykieta |
Nazwa |
Typ |
Opis |
|---|---|---|---|
Warstwa wejściowa |
|
[vector: polygon] |
Vector polygon layer that contains the zones. |
Raster layer |
|
[raster] |
Input raster layer. |
Raster band |
|
[raster band] Default: The first band of the input layer |
If the raster is multiband, choose a band for the statistics. |
Output column prefix |
|
[ciąg tekstowy] Domyślnie: «_» |
Prefix for the output columns names. |
Statistics to calculate |
|
[enumeration] [list] Domyślnie: [0,1,2] |
List of statistical operator for the output. Options:
|
Zonal Statistics |
|
[vector: polygon] Default: |
Specify the output vector polygon layer. One of:
The file encoding can also be changed here. |
Wyniki
Etykieta |
Nazwa |
Typ |
Opis |
|---|---|---|---|
Zonal Statistics |
|
[vector: polygon] |
The zone vector layer with added statistics. |
Kod pythona
ID algorytmu: native:zonalstatisticsfb
import processing
processing.run("algorithm_id", {parameter_dictionary})
The algorithm id is displayed when you hover over the algorithm in the Processing Toolbox. The parameter dictionary provides the parameter NAMEs and values. See Using processing algorithms from the console for details on how to run processing algorithms from the Python console.