17.33. Utilizarea script-urilor R în cadrul procesării
Module contributed by Matteo Ghetta - funded by Scuola Superiore Sant’Anna
Processing (with the Processing R Provider plugin) makes it possible to write
and run R scripts inside QGIS.
Atenționare
R has to be installed on your computer and the PATH has to be correctly set up. Moreover Processing just calls the external R packages, it is not able to install them. So be sure to install external packages directly in R. See the related chapter in the user manual.
Notă
If you have package problems, it may be related to missing
mandatory packages required by Processing, like sp, rgdal and raster.
17.33.1. Adăugarea script-urilor
Adding a script is simple.
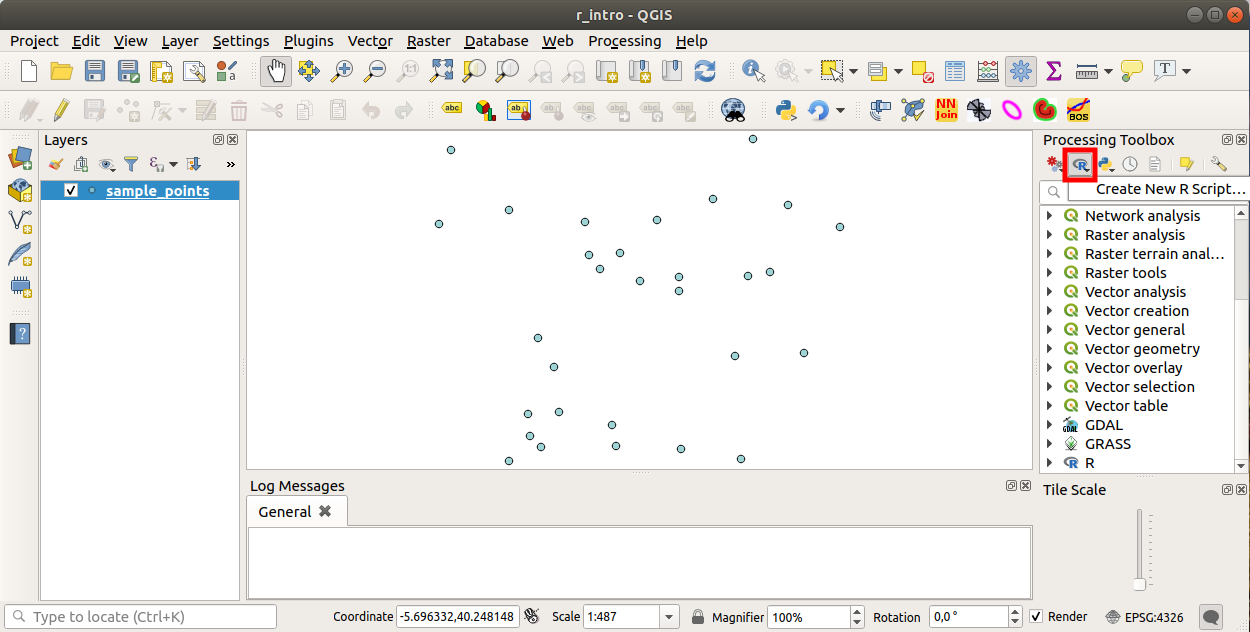
The easiest way is to open the Processing toolbox and choose
from the R menu (labelled with an
R icon) at the top of the Processing Toolbox.
You can also create the script in for instance a text editor and save it in
your R scripts folder (processing/rscripts).
When it has been saved there, it will be available for editing by
right-clicking on the script name in the processing toolbox and then choose
).
Notă
Dacă nu puteți vizualiza R în Processing, trebuie să îl activați din
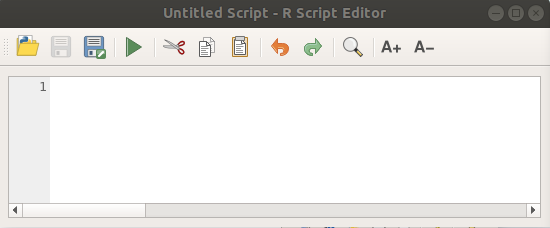
Se va deschide o fereastră de editare a scriptului în care va trebui să specificați o serie de parametri, înainte de a putea adăuga corpul scriptului.
17.33.2. Crearea diagramelor
În cadrul acestui tutorial vom crea o diagramă de tip boxplot pentru un câmp al unui strat vectorial.
Open the r_intro.qgs QGIS project under the
exercise_data/processing/r_intro/ folder.
Parametrii scriptului
Deschideți editorul și începeți să scrieți.
Va trebui să specificați câțiva parametri înaintea editării scriptului:
The name of the group (plots in this case) in which you want to put your script (if the group does not exist, it will be created):
##plots=groupYou will find your script in the plots R group in the Processing toolbox.
You have to tell Processing that you want to display a plot (in this example):
##showplotsYou will then find a link to the plot in the Result Viewer panel (can be turned on / off in and with ).
You also need to tell Processing about your input data. In this example we want to create a plot from a field of a vector layer:
##Layer=vectorProcessing now knows that the input is a vector. The name Layer is not important, what matters is the vector parameter.
Finally, you have to specify the input field of the vector layer (using the name you have provided above - Layer):
##X=Field LayerProcessing now knows that you need a field of Layer, and that you will call it X.
It is also possible to define the name of your script using
name:##My box plot script=nameIf not defined, the file name will be used as the name of the script.
Corpul scriptului
O dată ce partea introductivă a scriptului a fost setată, puteți adăuga o funcție:
boxplot(Layer[[X]])
boxplot is the name of the R function, the parameter Layer is the name that you have defined for the input dataset and X is the name you have defined for the field of that dataset.
Atenționare
The parameter X has to be within double square brackets ([[]]).
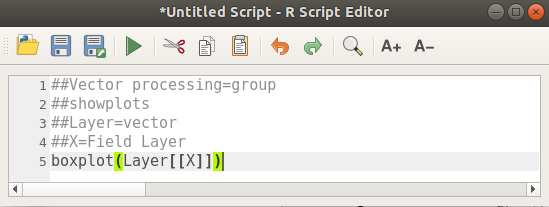
Scriptul final va trebui să arate astfel:
##Vector processing=group
##showplots
##Layer=vector
##X=Field Layer
boxplot(Layer[[X]])
Save the script in the default path suggested by Processing (processing/rscripts).
If you have not defined a name in the script heading, the file name you
choose will become the name of the script in the Processing toolbox.
Notă
You can save the script wherever you like, but Processing will then not be able to include it in the processing toolbox automatically, so you have to upload it manually.
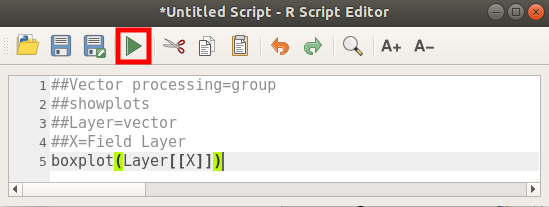
Acum, doar rulați-l, folosind butonul din partea de sus a ferestrei editorului:
Once the editor window has been closed, use the text box of Processing to find your script:

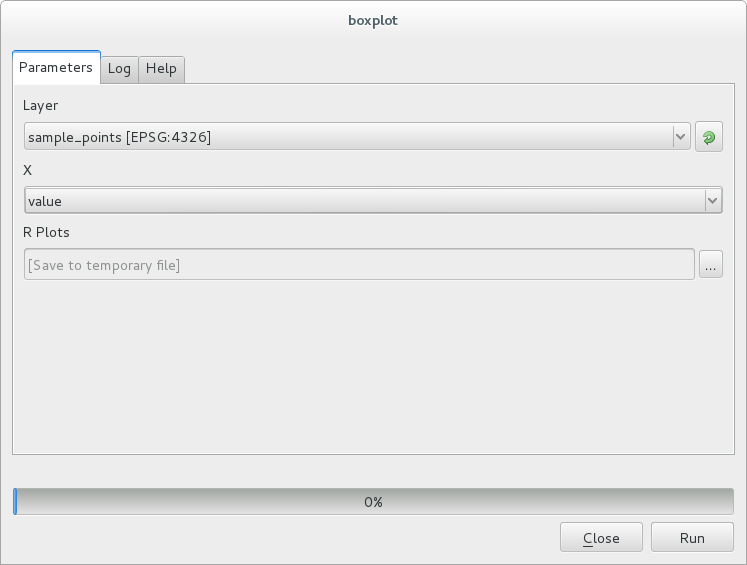
You can now fill the parameters required in the Processing algorithm window:
for Layer choose sample_points
for the X field choose value
Efectuați clic pe Executare.
Fereastra rezultatelor ar trebui să fie deschisă în mod automat, dacă nu, doar faceți clic pe .
Click on the link in the viewer and you will see:
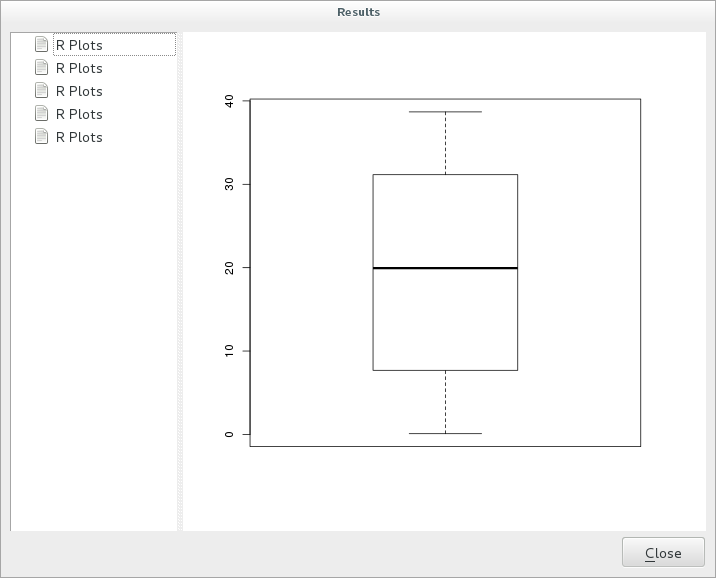
Notă
You can open, copy and save the image by right clicking on the plot.
17.33.3. Crearea unui vector
You can also create a vector layer and have it automatically loaded into QGIS.
The following example has been taken from the Random sampling grid
script that can be found in the online collection of R scripts
(the scripts in this online collection can be found in
https://github.com/qgis/QGIS-Processing/tree/master/rscripts).
The aim of this exercise is to create a random point vector layer
using an input vector layer to restrict the extent using the spsample
function of the sp package.
Parametrii scriptului
Ca și mai înainte, avem de stabilit câțiva parametri la începutul script-ului:
Specify the name of the group in which you want to put your script, in this case Point pattern analysis:
##Point pattern analysis=groupDefine an input parameter (a vector layer) that will constrain the placement of the random points:
##Layer=vectorSet an input parameter for the number of points that are going to be created (
Size, with a default value of10):##Size=number 10Notă
Since a default value (
10) is defined, the user can change this number or can leave the parameter without a number.Specify that there is an output vector layer (called
Output):##Output=output vector
Corpul scriptului
Acum puteți adăuga corpul funcției:
Use the
spsamplefunction:pts=spsample(Layer, Size, type="random")
The function uses the Layer to constrain the placement of the points (if it is a line layer, a points will have to be on one of the lines in the layer, if it is a polygon layer, a point will have to be within a polygon). The number of points is taken from the Size parameter. The sampling method is random.
Generate the output (the
Outputparameter):Output=SpatialPointsDataFrame(pts, as.data.frame(pts))
Scriptul final va trebui să arate astfel:
##Point pattern analysis=group
##Layer=vector
##Size=number 10
##Output=output vector
pts=spsample(Layer, Size, type="random")
Output=SpatialPointsDataFrame(pts, as.data.frame(pts))

Save it and run it, clicking on the run button.
În noul tip de fereastră scrieți parametrii potriviți:
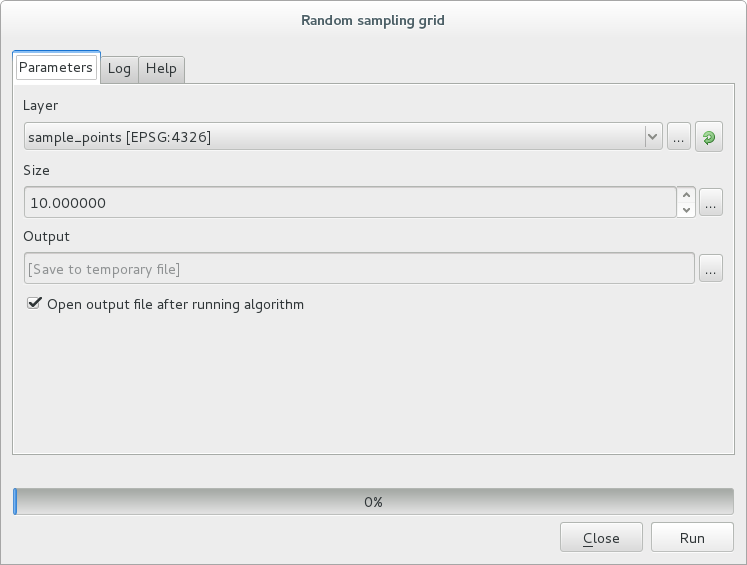
apoi faceți clic pe rulare.
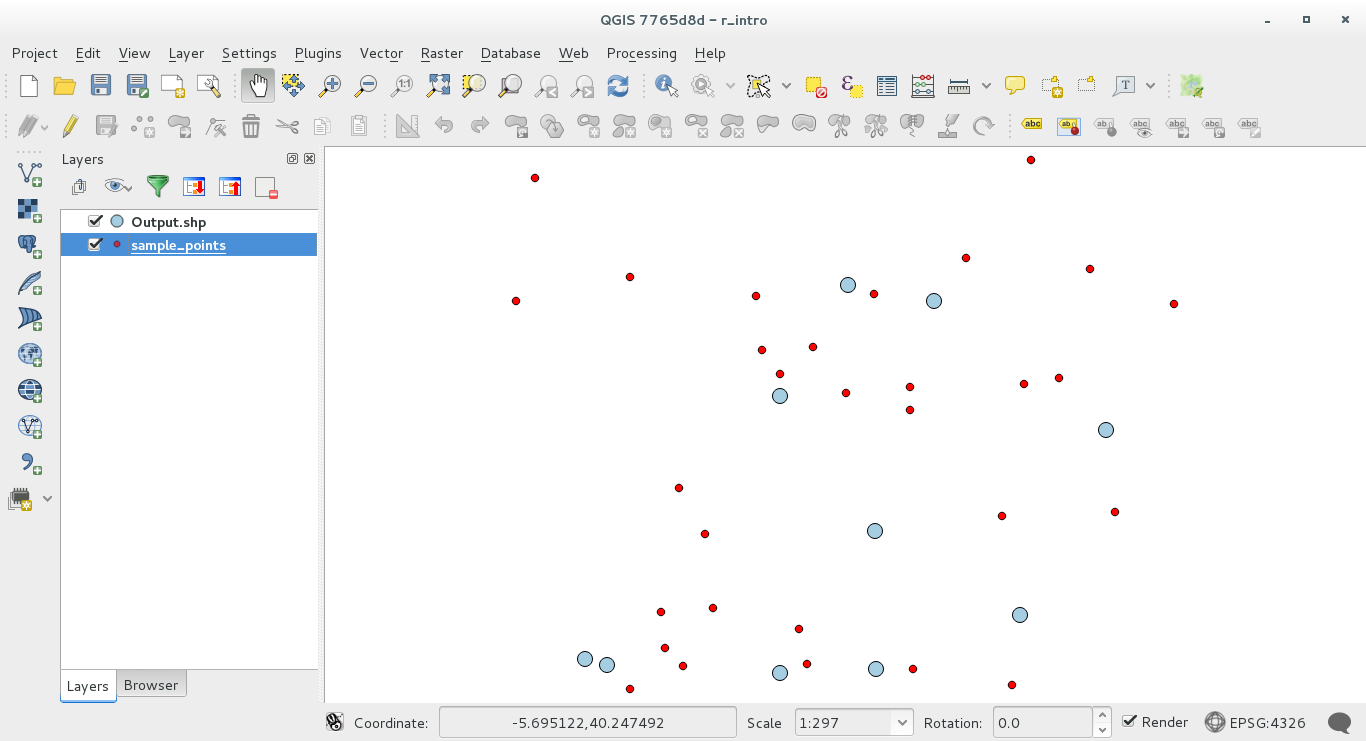
The result layer will be added to the table of contents and its points will be displayed on the map canvas:
17.33.4. Text and graph output from R - syntax
Processing (with the Processing R Provider plugin) uses special
syntax to get the results out of R:
>înainte de comanda dvs., ca în>lillie.test(Layer[[Field]])denotă că rezultatul ar trebui să fie trimis la ieșirea R (Vizualizatorul de rezultate)+after a plot enables overlay plots. For exampleplot(Layer[[X]], Layer[[Y]]) + abline(h=mean(Layer[[X]]))