3.2. Lesson: Labels
Os rótulos podem ser adicionados a um mapa para mostrar qualquer informação sobre um objeto. Qualquer camada vetorial pode ter rótulos associados. Esses rótulos tem seu conteúdo baseado nos atributos de uma camada.
O objetivo desta lição: Aplicar rótulos úteis e bonitos para uma camada.
3.2.1.  Follow Along: Utilizando Rótulos
First, ensure that the  button is visible in the GUI:
Go to the menu item
Ensure that the Label Toolbar item has a check mark next to it. If it doesn’t, click on the Label Toolbar item to activate it.
Click on the
placeslayer in the Layers panel so that it is highlightedClick on the
toolbar button to open the
Labels tab of the Layer Styling panelSwitch from No Labels to
Single LabelsYou’ll need to choose which field in the attributes will be used for the labels. In the previous lesson, you decided that the
namefield was the most suitable one for this purpose.Select
namefrom the Value list: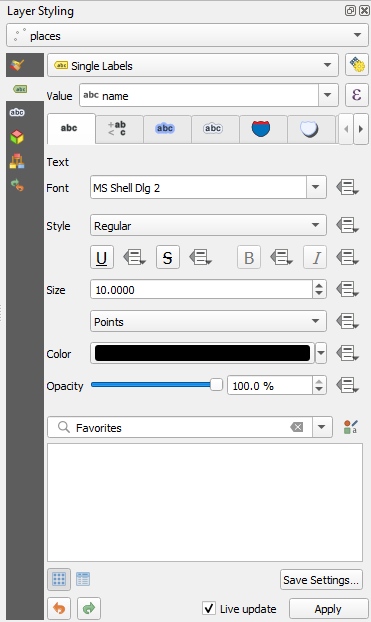
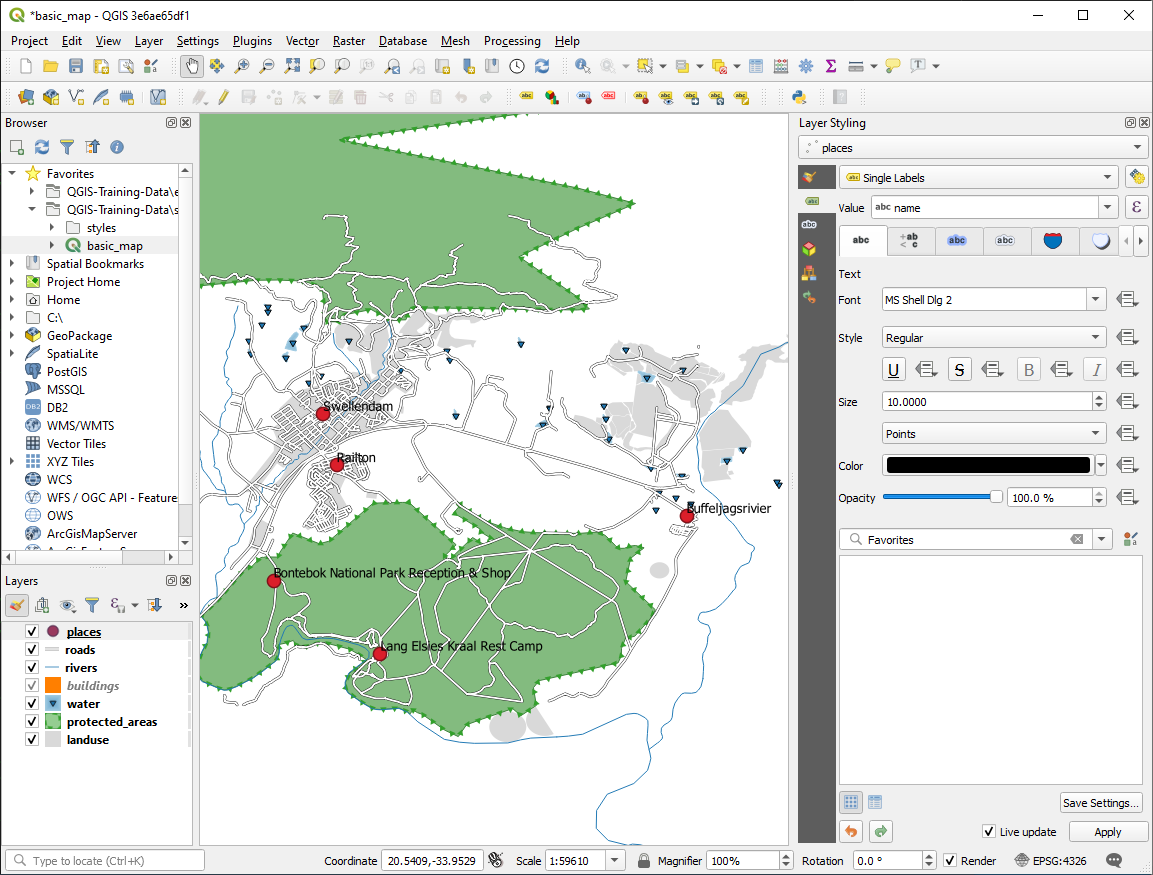
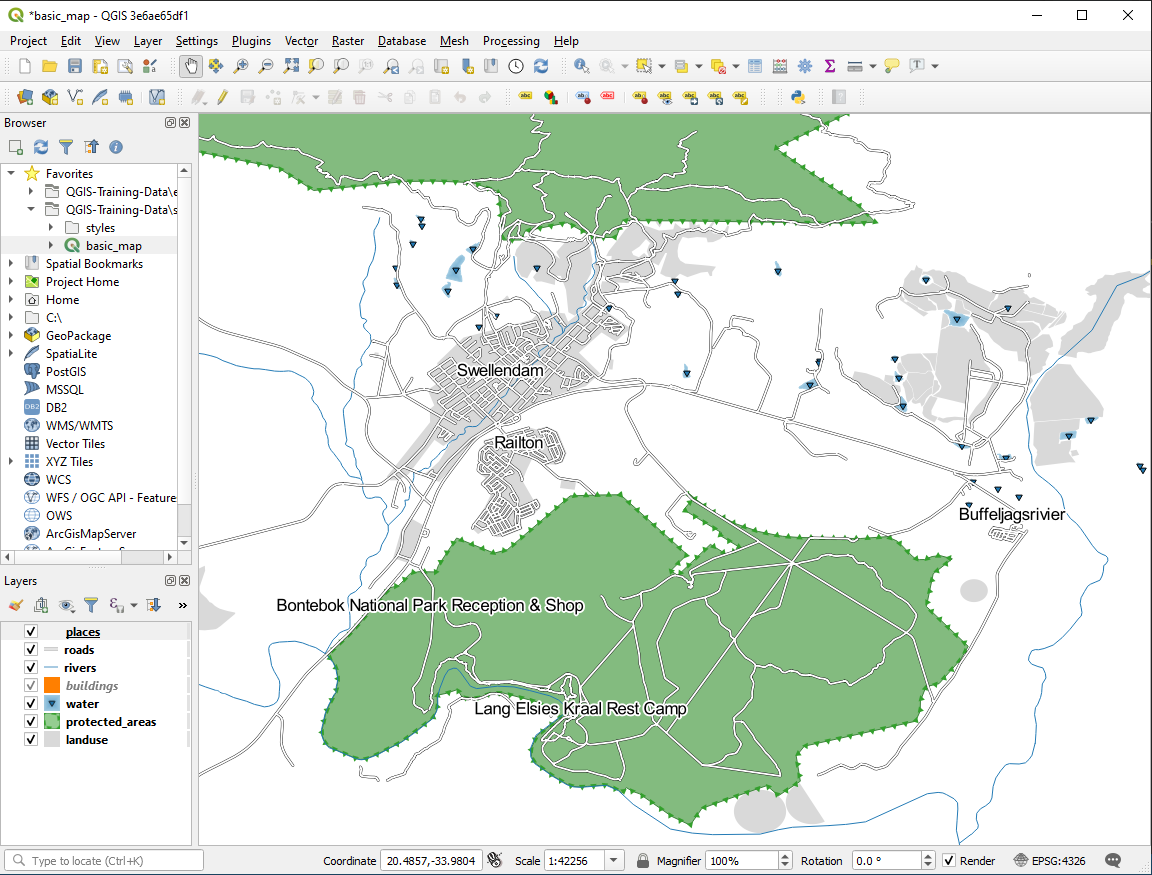
Clique em Aplicar
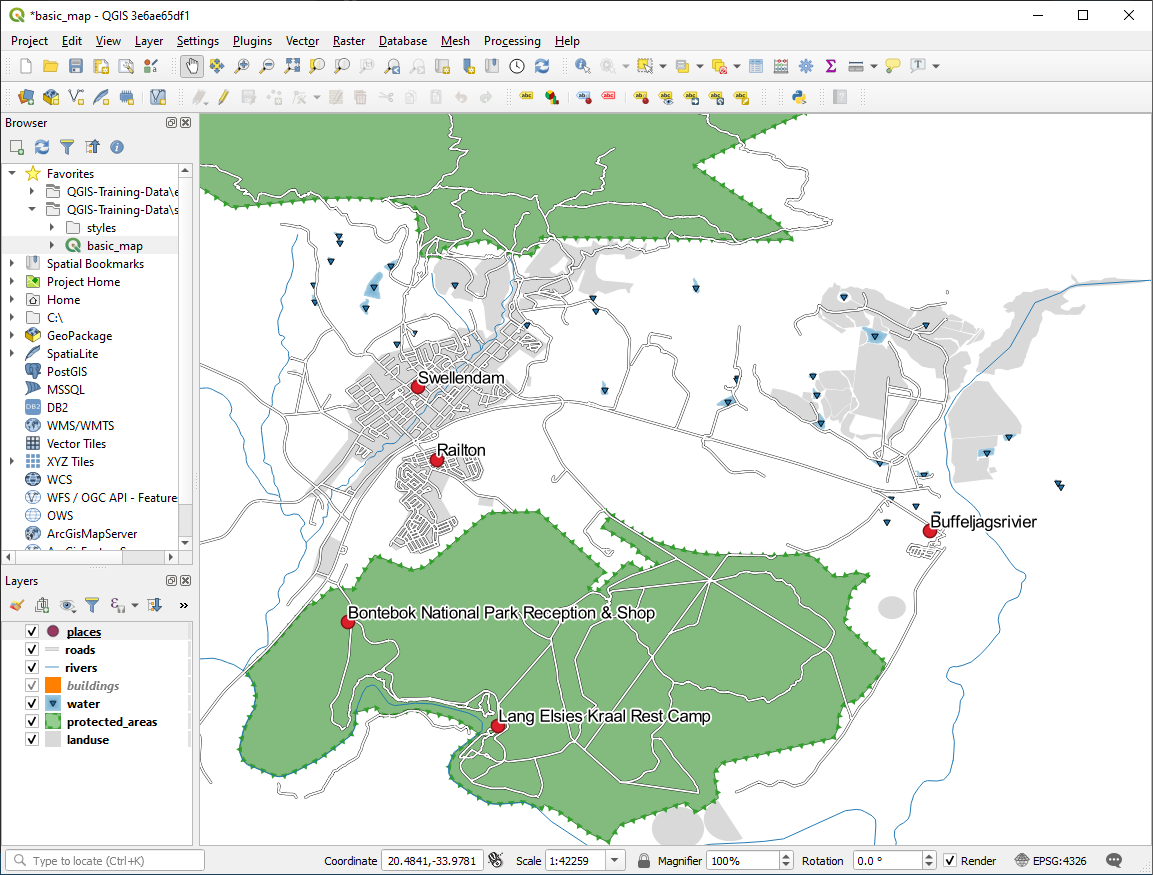
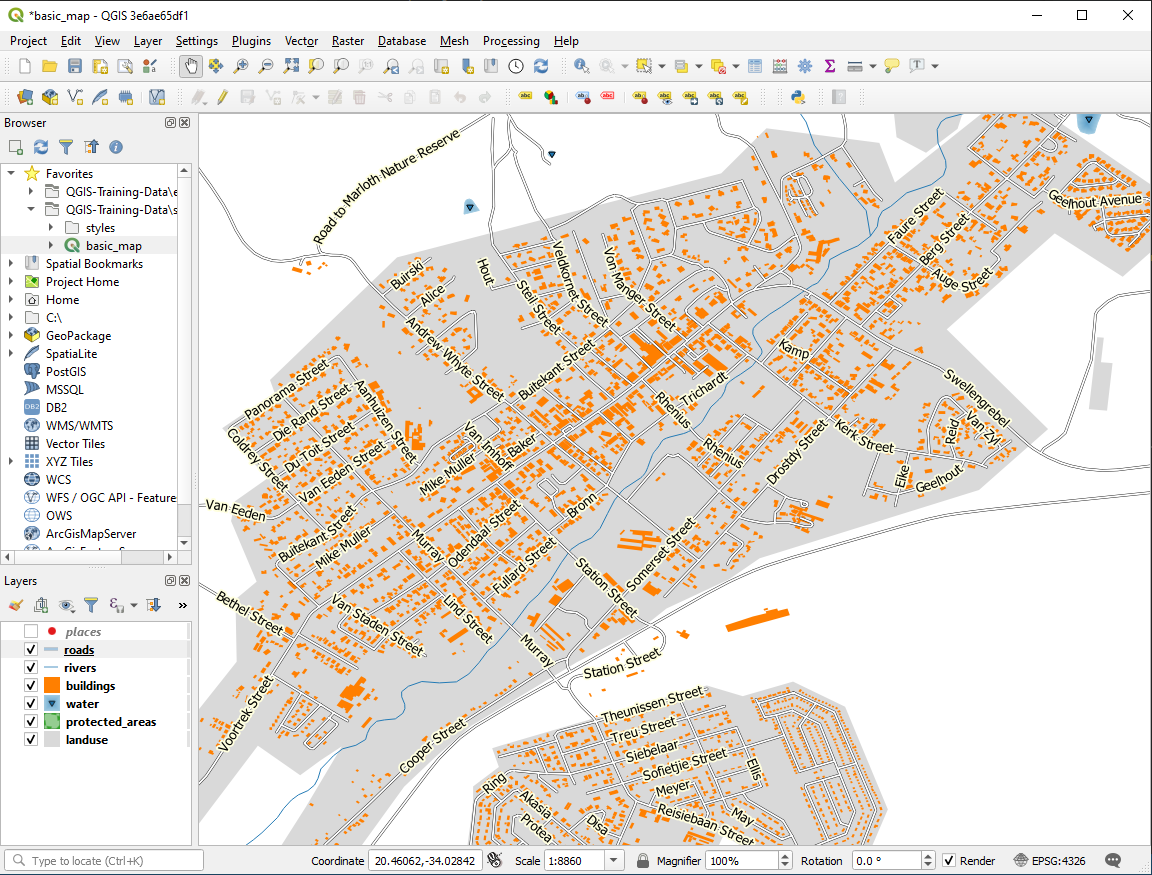
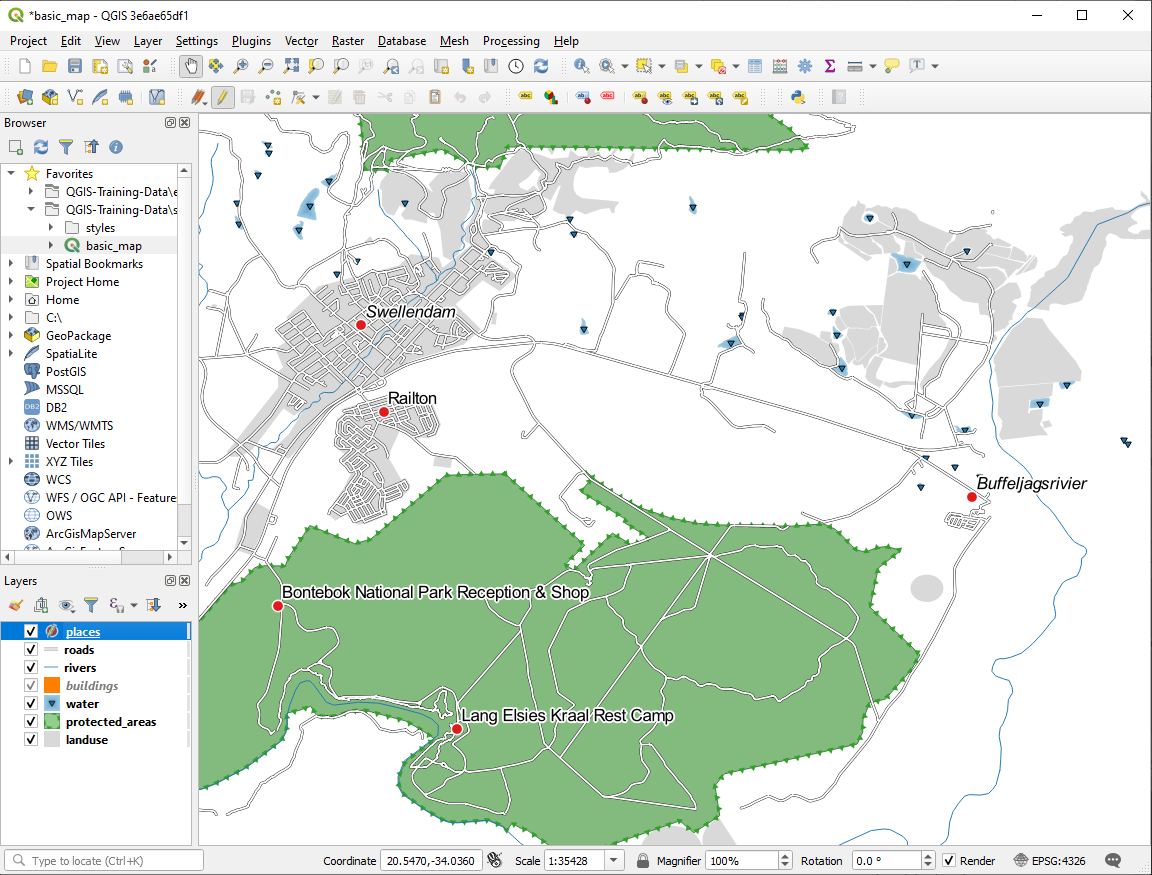
Agora o mapa deve ter etiquetas como estas:
3.2.2. Follow Along: Alterando as opções de Rótulo
Depending on the styles you chose for your map in earlier lessons, you might find that the labels are not appropriately formatted and either overlap or are too far away from their point markers.
Nota
Above, you used the button in the
Label Toolbar to open the Layer Styling panel. As
with Symbology, the same label options are available via both
the Layer Styling panel and the Layer Properties
dialog. Here, you’ll use the Layer Properties dialog.
Open the Layer Properties dialog by double-clicking on the
placeslayerSelect the
Labels tabAssegure-se que a opção Texto está selecionada na lista de opções do lado esquerdo, depois, atualize as opções de formato de texto para que coincida com o que é mostrado aqui:
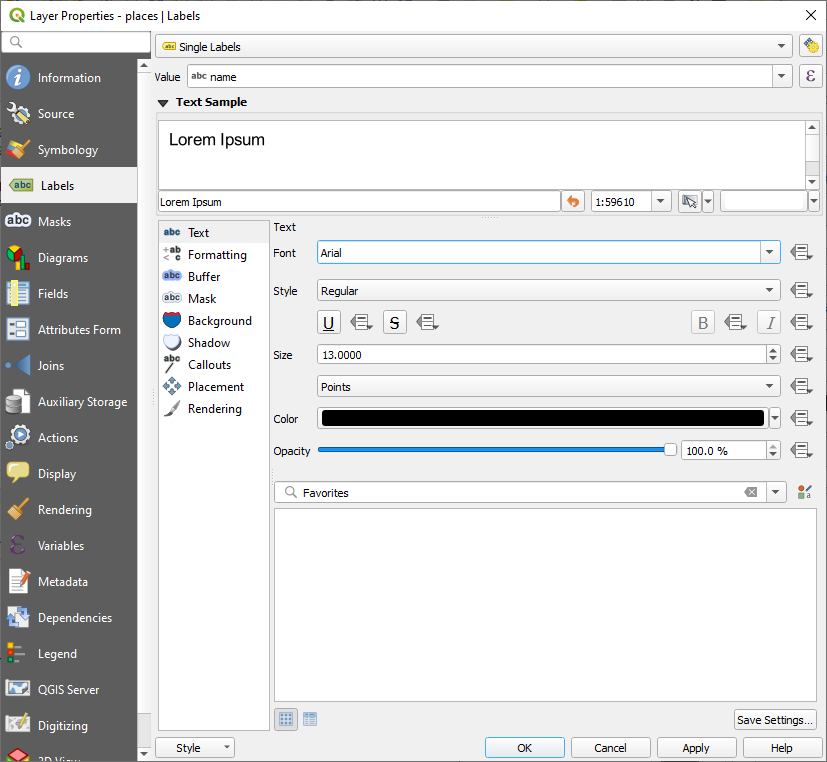
Clique em Aplicar
That font may be larger and more familiar to users, but its readability is still dependent on what layers are rendered beneath it. To solve this, let’s take a look at the Buffer option.
Select Buffer from the left-hand options list
Selecione a opção Desenhar buffer do texto, depois escolha as opções que coincidem com o que se mostra aqui:
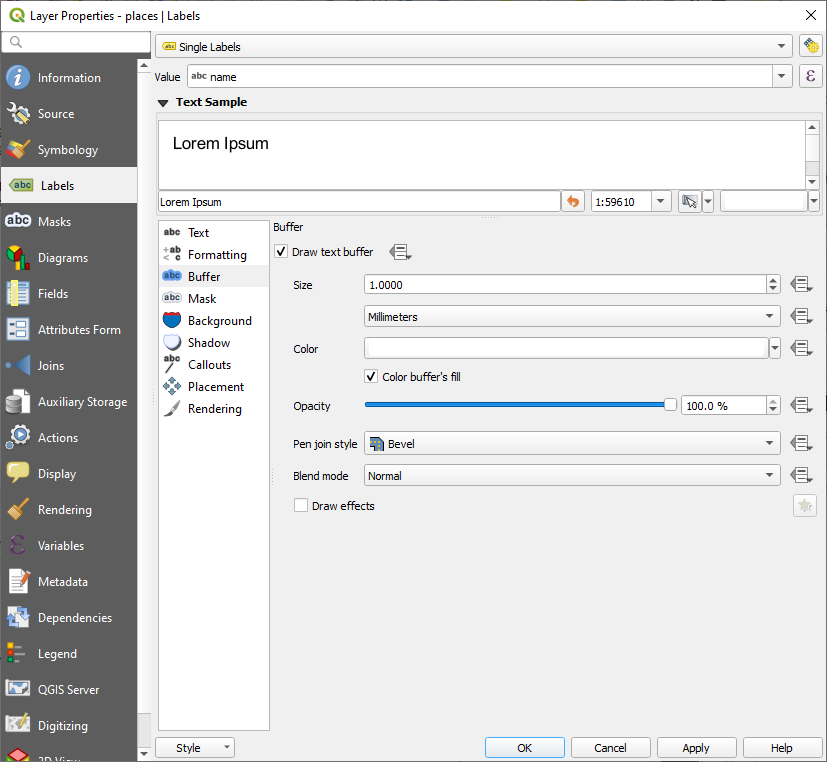
Clique em Aplicar
Você verá que isso adiciona um buffer ou borda colorida aos rótulos de places, tornando-os mais fáceis de ver no mapa:
Agora, podemos resolver o posicionamento dos rótulos em relação aos seus pontos.
Select Placement from the left-hand options list
Select Around point and change the value of Distance to
2.0Millimeters: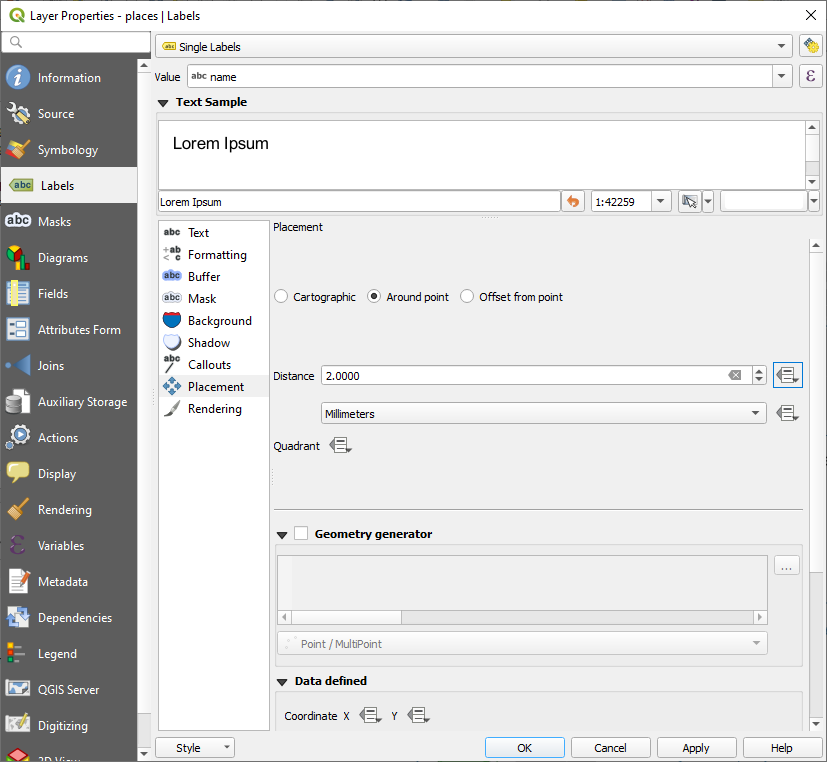
Clique em Aplicar
Você verá que os rótulos já não estão sobrepostos aos pontos.
3.2.3.  Follow Along: Utilizando Rótulos no lugar da Simbologia da Camada
In many cases, the location of a point doesn’t need to be very specific. For
example, most of the points in the places layer refer to entire
towns or suburbs, and the specific point associated with such features is not
that specific on a large scale. In fact, giving a point that is too specific is
often confusing for someone reading a map.
Para citar um exemplo: em um mapa do mundo o ponto dado para a União Europeia pode estar em algum lugar na Polônia. Para alguém lendo o mapa, ver um ponto marcado União Europeia na Polônia, pode levar a crer que a capital da União Europeia é na Polônia.
Então, para evitar esse tipo de mal-entendido, muitas vezes é útil desativar os símbolos de pontos e substituí-los por completo com rótulos.
No QGIS, você pode fazer isso alterando a posição dos rótulos a serem apresentados diretamente sobre os pontos a que se referem.
Open the
Labels tab of the
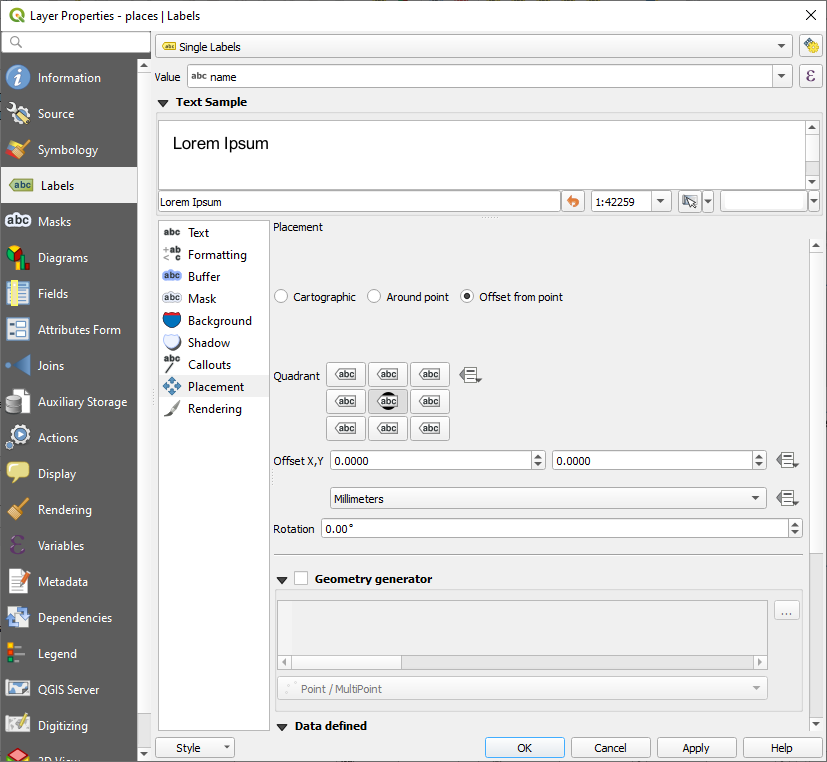
Layer Properties dialog for the placeslayerSelect the Placement option from the options list
Click on the Offset from point button
Isso revelará as opções para Quadrante que você pode usar para definir a posição do rótulo em relação ao ponto. Neste caso, queremos que o rótulo esteja centralizado no ponto, então, escolha o quadrante central:
Hide the point symbols by editing the layer Symbology as usual, and setting the size of the Marker size to
0.0: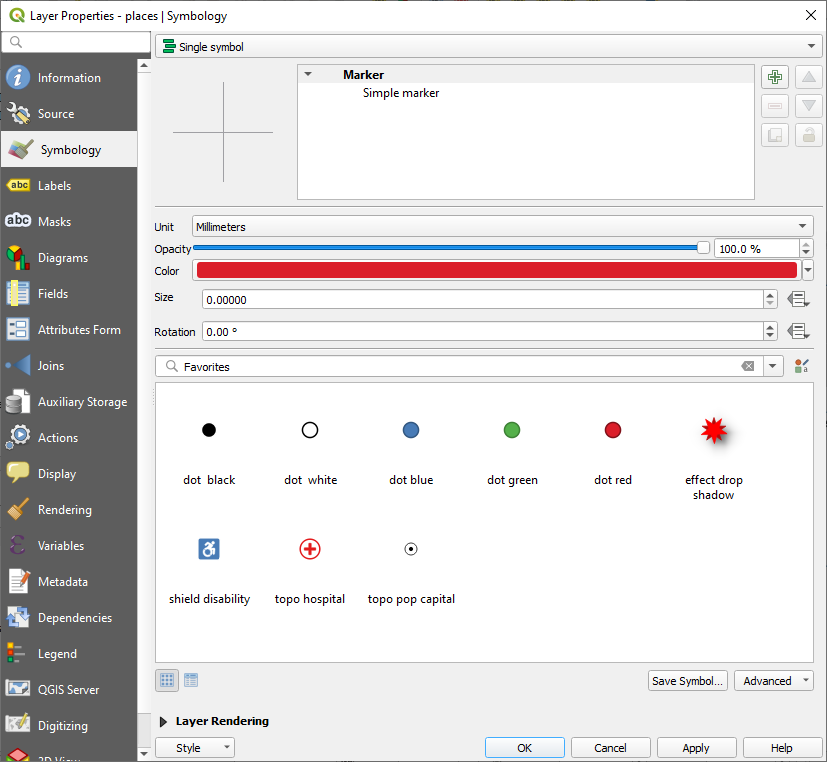
Click Apply and you’ll see this result:
If you were to zoom out on the map, you would see that some of the labels
disappear at larger scales to avoid overlapping. Sometimes this is what you
want when dealing with datasets that have many points, but at other times
you will lose useful information this way. There is another possibility for
handling cases like this, which we’ll cover in a later exercise in this lesson.
For now, zoom out and click on the  button in the toolbar
and see what happens.
button in the toolbar
and see what happens.
3.2.4. Try Yourself Personalizar Rótulos
Reset the label and symbol settings to have a point marker and a label offset of
2.0Millimeters.
Set the map to the scale
1:100000. You can do this by typing it into the Scale box in the Status Bar. Modify your labels to be suitable for viewing at this scale.
3.2.5. Follow Along: Rotulando Linhas
Agora que você sabe como funciona a rotulagem, há um problema adicional. Pontos e polígonos são fáceis de rotular, mas o que dizer sobre linhas? Se você as rotulasse da mesma forma que os pontos, o resultado ficaria assim:
We will now reformat the roads layer labels so that they are easy to
understand.
Hide the
placeslayer so that it doesn’t distract youActivate
Single Labels for the roadslayer as you did above forplacesSet the font Size to
10so that you can see more labelsZoom in on the Swellendam town area
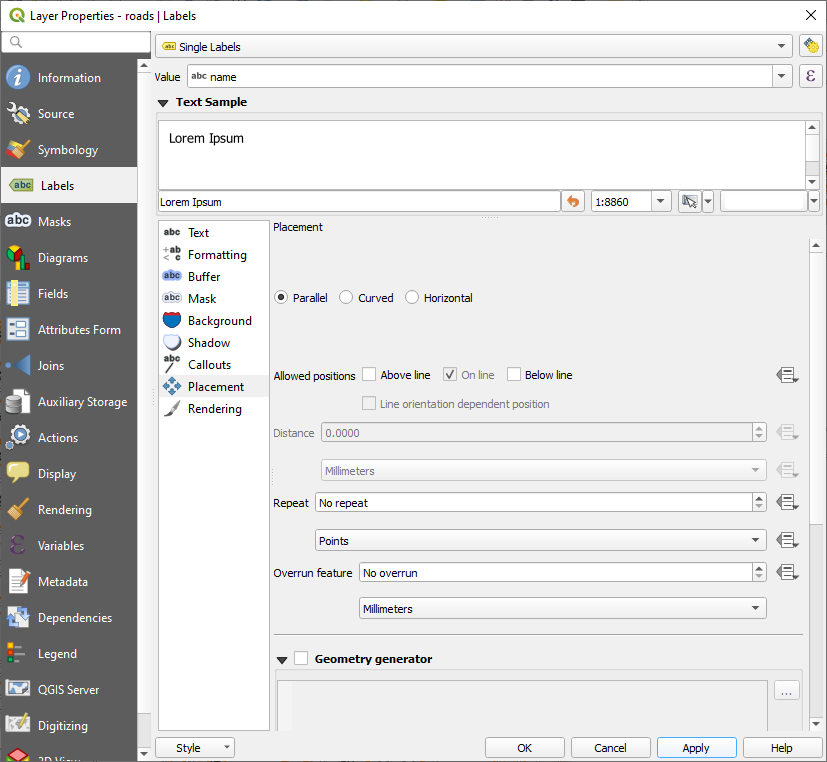
In the Labels tab’s Placement tab, choose the following settings:
You’ll probably find that the text styling has used default values and the labels are consequently very hard to read. Update the Text to use a dark-grey or black Color and the Buffer to use a light-yellow Color.
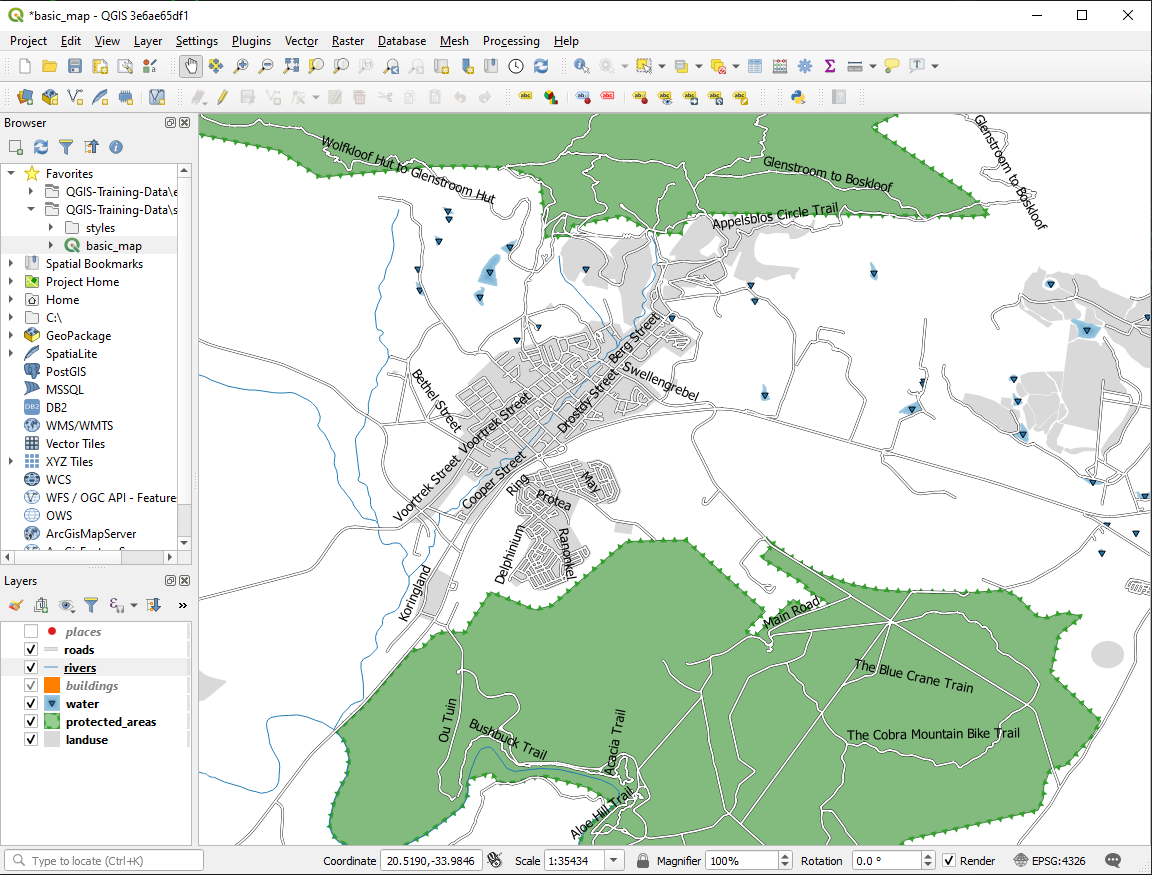
O mapa ficará parecido com esse, dependendo da escala:
Verá que alguns dos nomes das ruas aparecem mais de uma vez e que nem sempre são necessários. Para prevenir isso:
In the Labels tab of the Layer Properties dialog, choose the Rendering option and select Merge connected lines to avoid duplicate labels as shown:
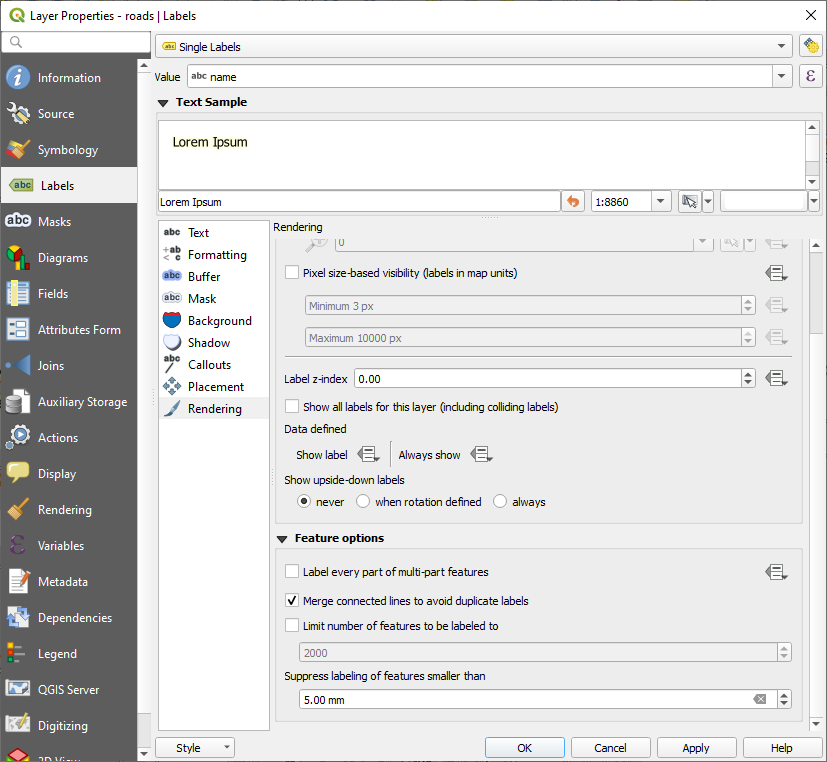
Clique OK.
Outra função útil é uma que previne que rótulos sejam desenhados para feições muito pequenas, difíceis de serem notadas.
In the same Rendering panel, set the value of Suppress labeling of features smaller than … to
5.00 mmand note the results when you click ApplyTry out different Placement settings as well. As we’ve seen before, the Horizontal option is not a good idea in this case, so let’s try the Curved option instead.
Select the Curved option in the Placement panel of the Labels tab
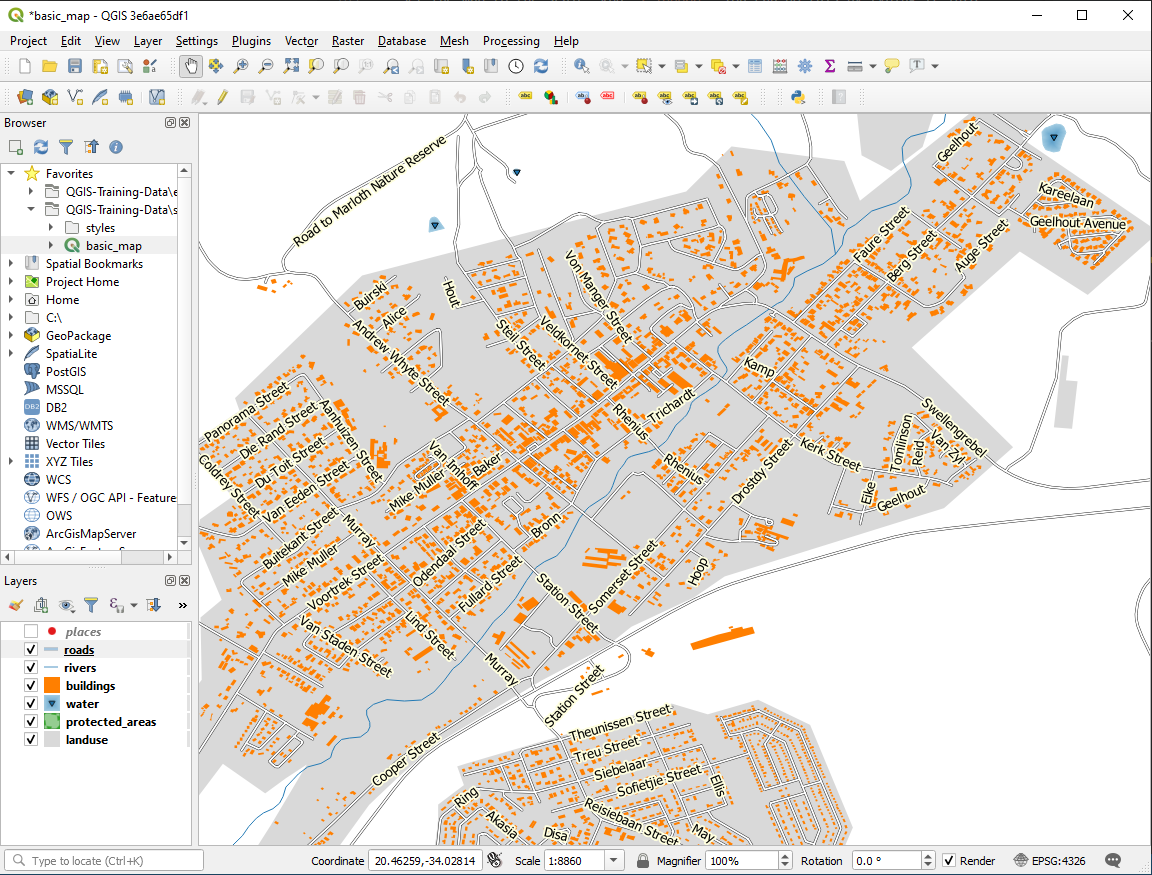
Aqui está o resultado:
As you can see, this hides some labels that were previously visible, because of the difficulty of making some of them follow twisting street lines while still being legible. It makes other labels much more useful since they track the roads rather than float in space between them. You can decide which of these options to use, depending on what you think seems more useful or what looks better.
3.2.6.  Follow Along: Ajustes Definidos de Datos
Deactivate labeling for the
roadslayerReactivate labeling for the
placeslayerOpen the attribute table for
placesvia the button
It has one field which is of interest to us now:
placewhich defines the type of urban area for each record. We can use this data to influence the label styles.Navigate to the Text panel in the
placesLabels panelClick the
 button next to the Italic text button beneath
Style and select to open the
Expression String Builder:
button next to the Italic text button beneath
Style and select to open the
Expression String Builder: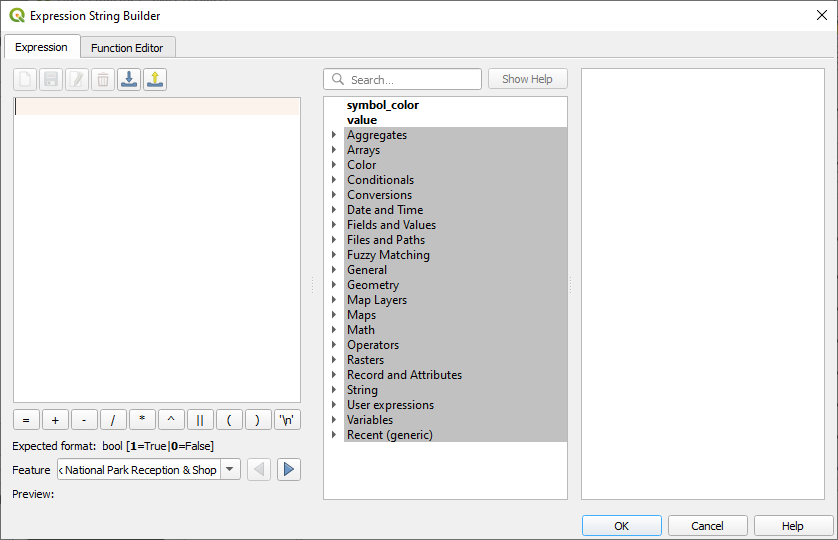
Under , double click on
placeand then click All Unique. This will list all unique values of theplacefield of this layer. Add a=in the text editor and then double click ontown.Alternatively, you can type:
"place" = 'town'directly in the text editor.Click OK twice:
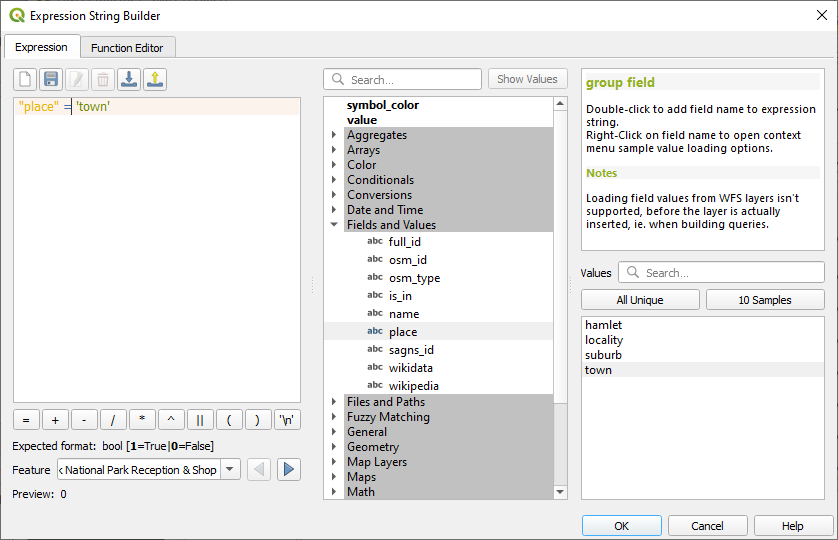
Notice that the labels for all places whose place
field matches town are displayed in italics.
3.2.7. Try Yourself Utilizando Ajustes Definidos de Datos
Nota
Estamos saltando hacia adelante un poco para demostrar algunos ajustes avanzados de las etiquetas. En el nivel avanzado, se asume que sabrás qué significa lo siguiente. En caso contrario, eres libre de dejar esta sección y volver cuando hayas cubierto los materiales requeridos.
Open the Attribute Table for
placesEnter edit mode by clicking the
 button
Adicionar uma nova coluna com o botão

Configúrala como esta:
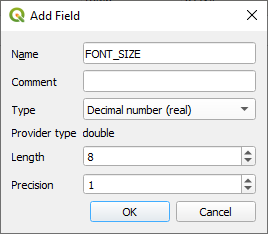
Use this to set custom font sizes for each different type of place (each key in the
placefield)
3.2.8. Más Posibilidades Con Etiquetas
We can’t cover every option in this course, but be aware that the Label tab has many other useful functions. You can set scale-based rendering, alter the rendering priority for labels in a layer, and set every label option using layer attributes. You can even set the rotation, XY position, and other properties of a label (if you have attribute fields allocated for the purpose), then edit these properties using the tools adjacent to the main Layer Labeling Options button:


(Estas herramientas estarán activas si los campos de atributo requeridos están disponibles y el modo edición está activado.)
Eres libre de explorar más posibilidades del sistema de etiquetas.
3.2.9. In Conclusion
Has aprendido a usar la capa de atributos para crear etiquetas dinámicas. Esto puede hacer tu mapa mucho más informativo y estilizado.
3.2.10. What’s Next?
Ahora que sabes cómo los atributos conllevan una diferencia visual en tu mapa, ¿Como los usamos para cambiar la simbología de los objetos? ¡Ese es el tema de la siguiente lección!