3.2. Lesson: Labels
オブジェクトに関する情報を表示するためにラベルを地図に追加することができます。任意のベクターレイヤーはそれに関連するラベルを持つことができます。ラベルの内容はレイヤーの属性データに依存します。
このレッスンの目標: 役に立ち見栄えの良いラベルをレイヤーに適用します。
3.2.1.  Follow Along: ラベルを使用する
First, ensure that the  button is visible in the GUI:
Go to the menu item
Ensure that the Label Toolbar item has a check mark next to it. If it doesn't, click on the Label Toolbar item to activate it.
Click on the
placeslayer in the Layers panel so that it is highlightedClick on the
toolbar button to open the
Labels tab of the Layer Styling panelSwitch from No Labels to
Single LabelsYou'll need to choose which field in the attributes will be used for the labels. In the previous lesson, you decided that the
namefield was the most suitable one for this purpose.Select
namefrom the Value list: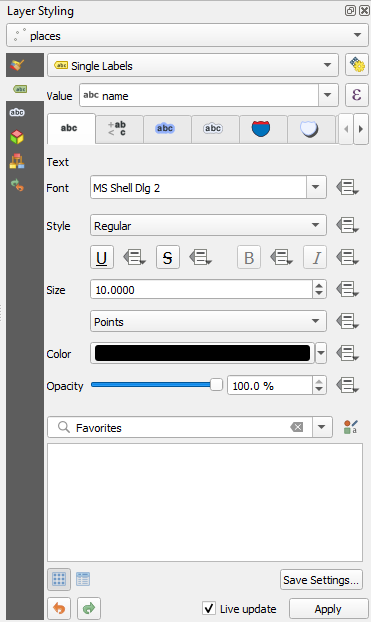
Apply をクリックします。
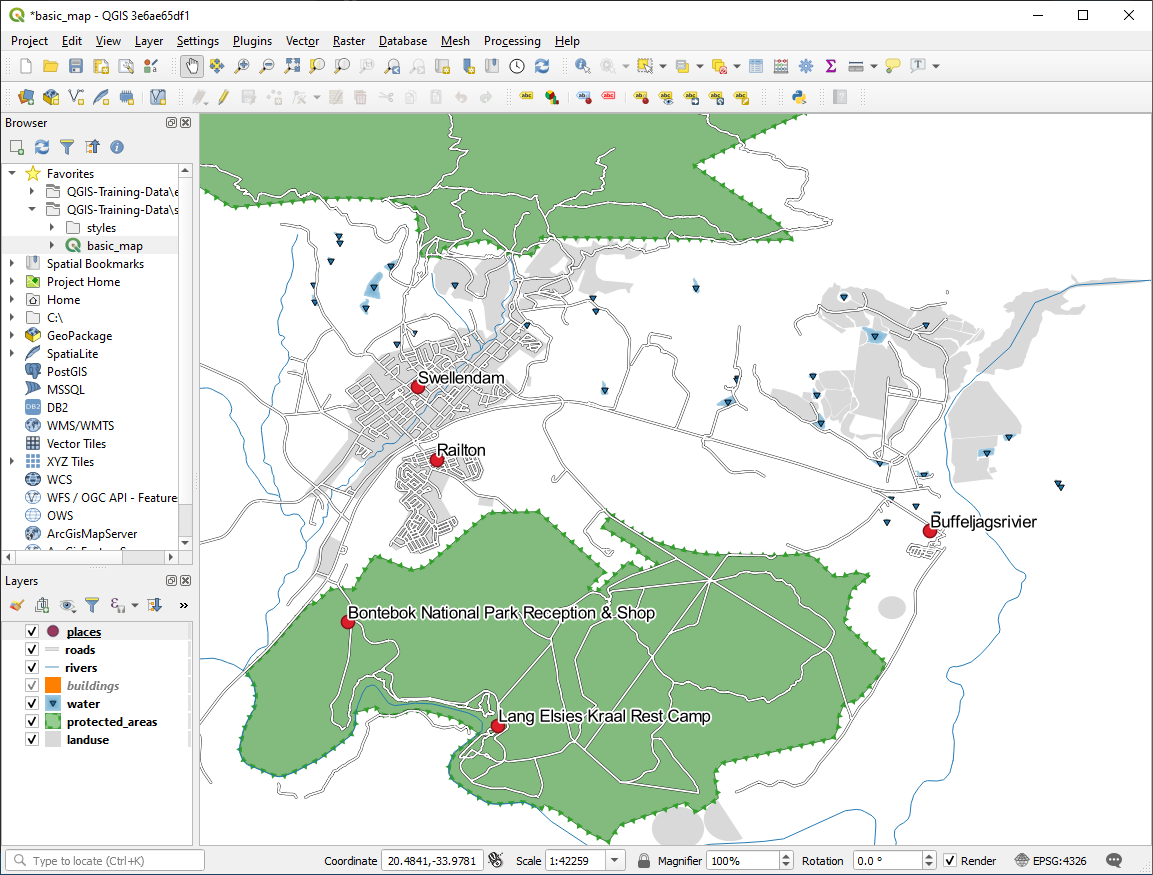
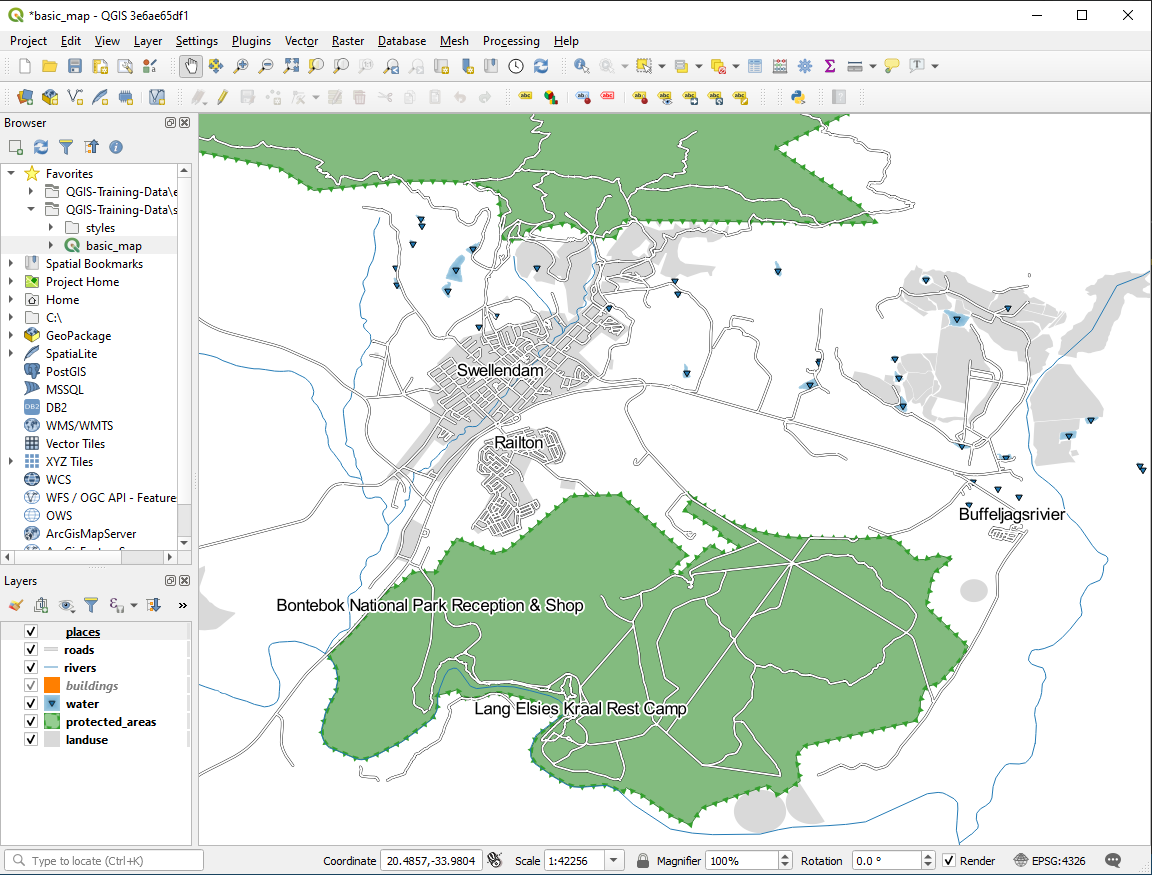
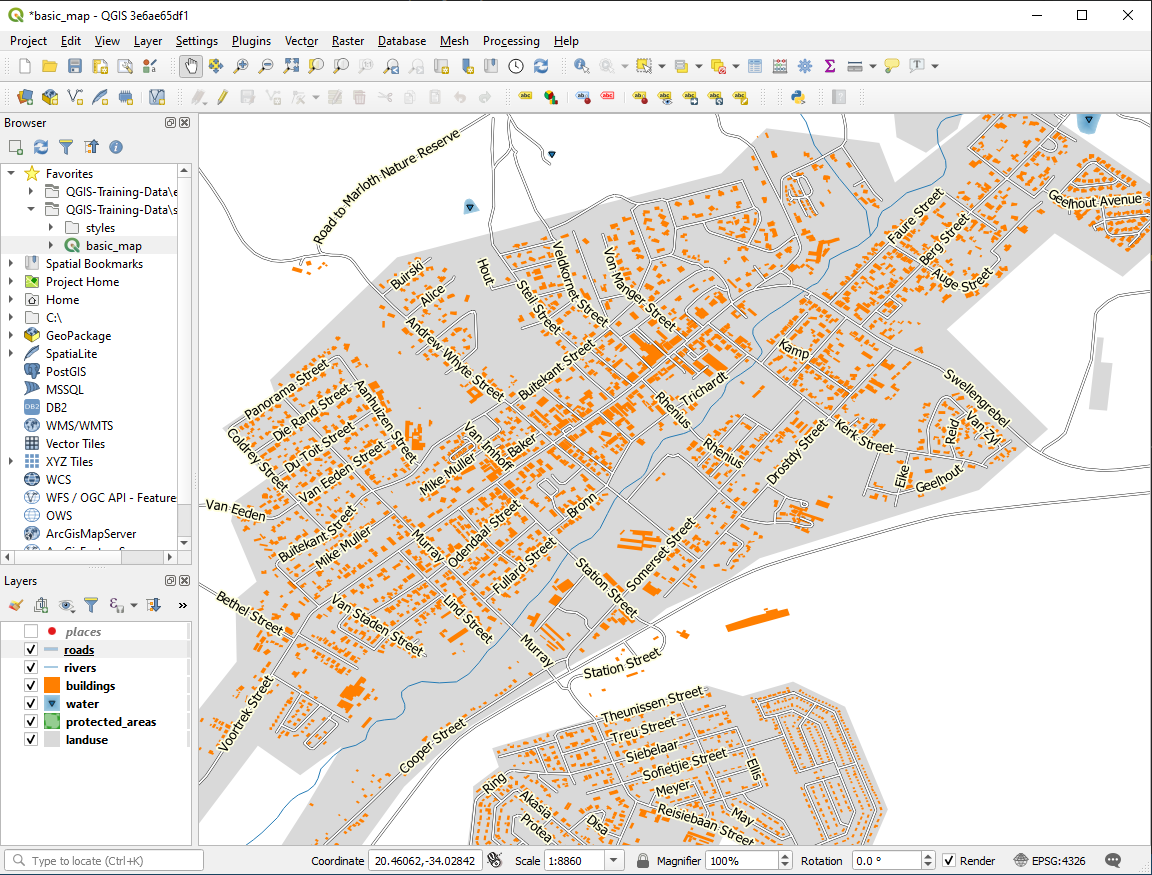
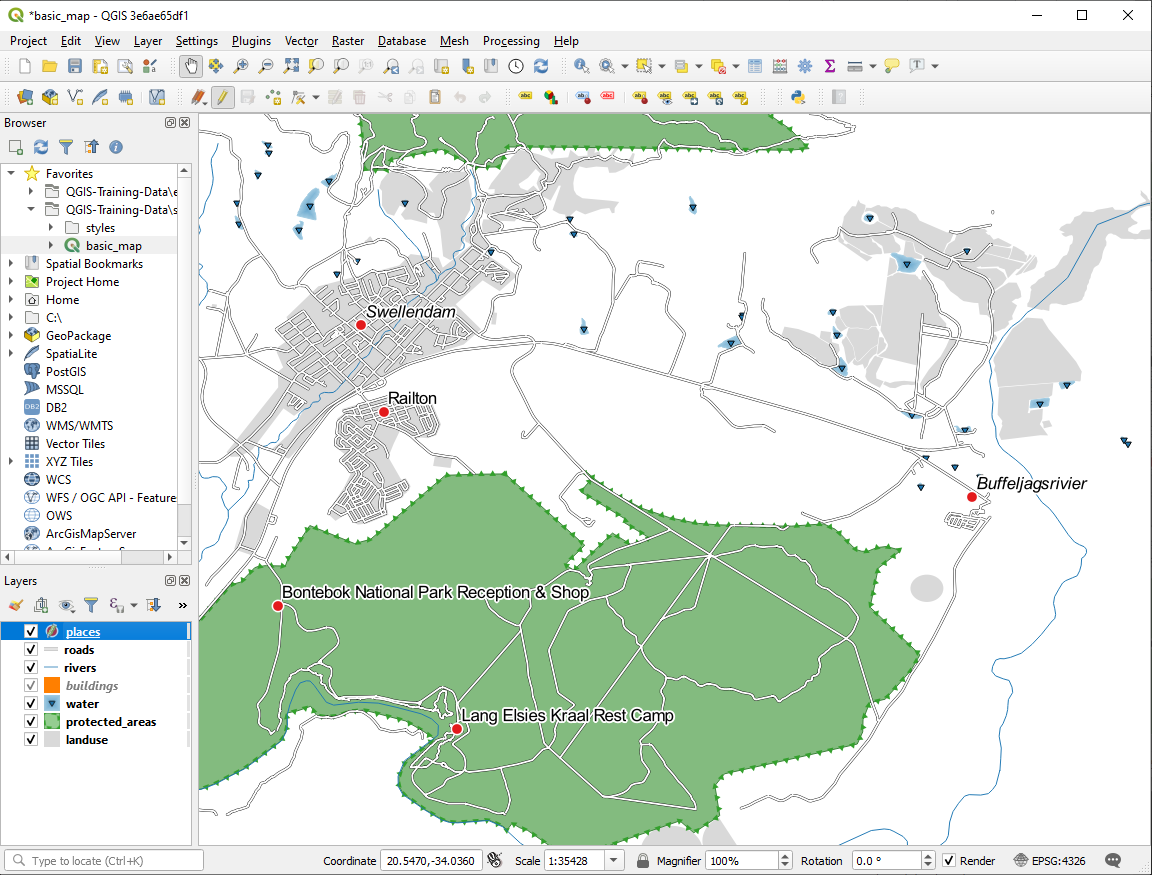
今、地図にはこのようなラベルが表示されるはずです:
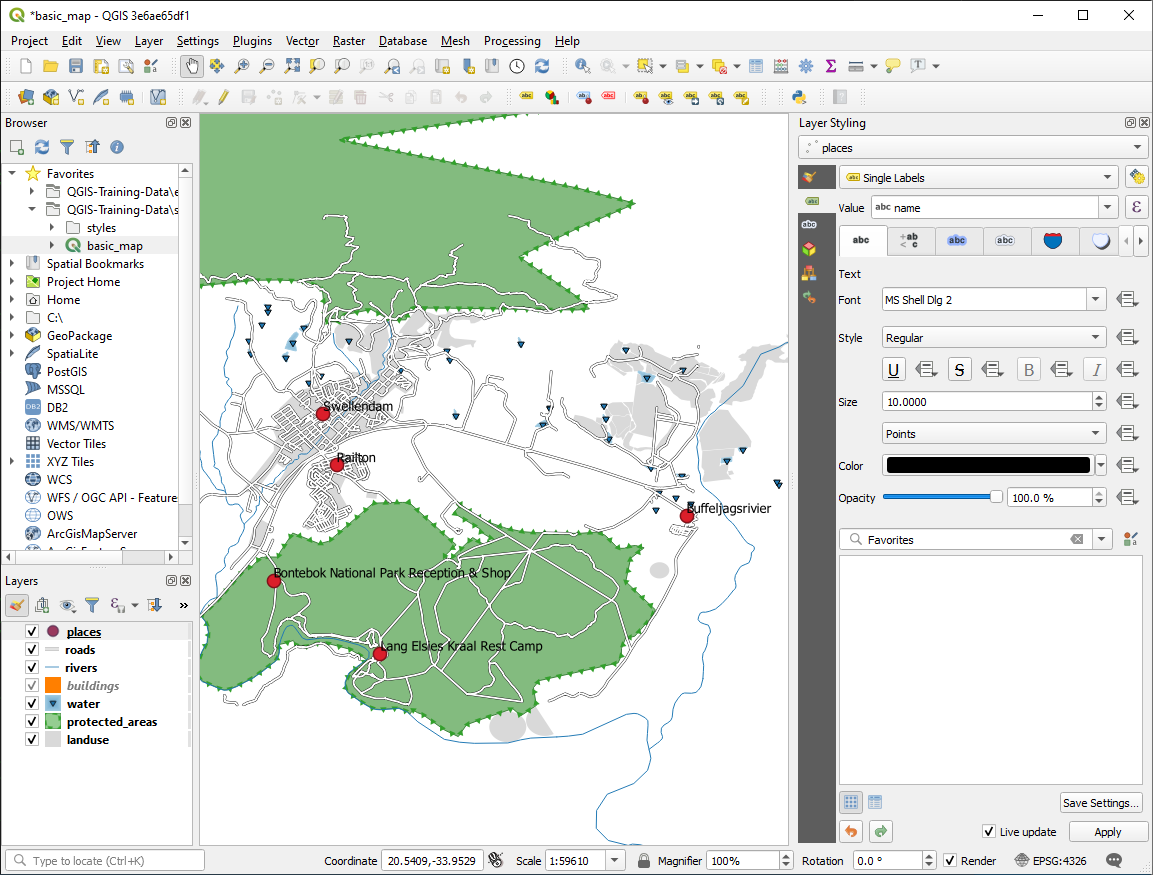
3.2.2. Follow Along: ラベルオプションを変更する
Depending on the styles you chose for your map in earlier lessons, you might find that the labels are not appropriately formatted and either overlap or are too far away from their point markers.
注釈
Above, you used the button in the
Label Toolbar to open the Layer Styling panel. As
with Symbology, the same label options are available via both
the Layer Styling panel and the Layer Properties
dialog. Here, you'll use the Layer Properties dialog.
Open the Layer Properties dialog by double-clicking on the
placeslayerSelect the
Labels tab左側のオプションリストで テキスト が選択されていることを確認し、ここに示されているものと同じになるようにテキスト書式設定を更新します:
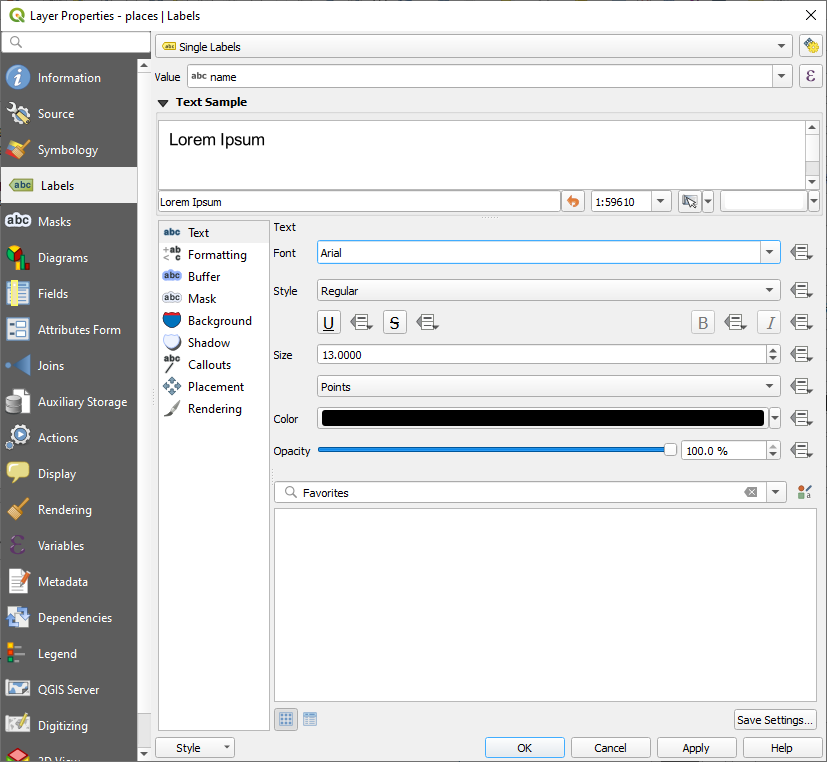
Apply をクリックします。
That font may be larger and more familiar to users, but its readability is still dependent on what layers are rendered beneath it. To solve this, let's take a look at the Buffer option.
Select Buffer from the left-hand options list
テキスト縁取りの描画 の隣のチェックボックスをチェックし、ここに示されているものと同じになるようにテキスト書式設定を更新します:
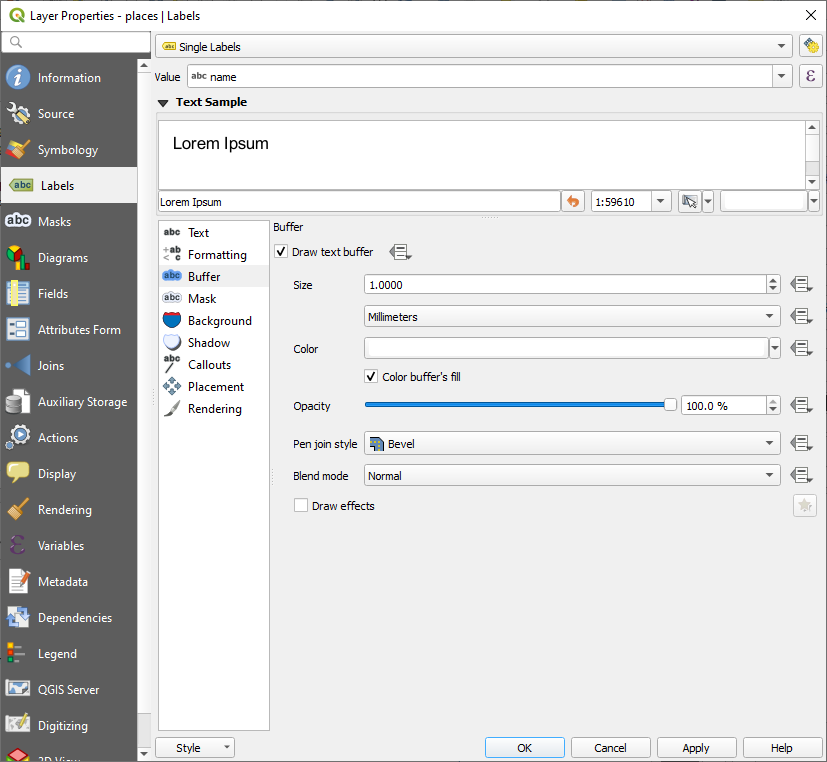
Apply をクリックします。
着色されたバッファまたは境界線が場所ラベルに追加されて地図上で見分けやすくなりました:
ポイントマーカーに相対的なラベルの配置に取りかかります。
Select Placement from the left-hand options list
Select Around point and change the value of Distance to
2.0Millimeters: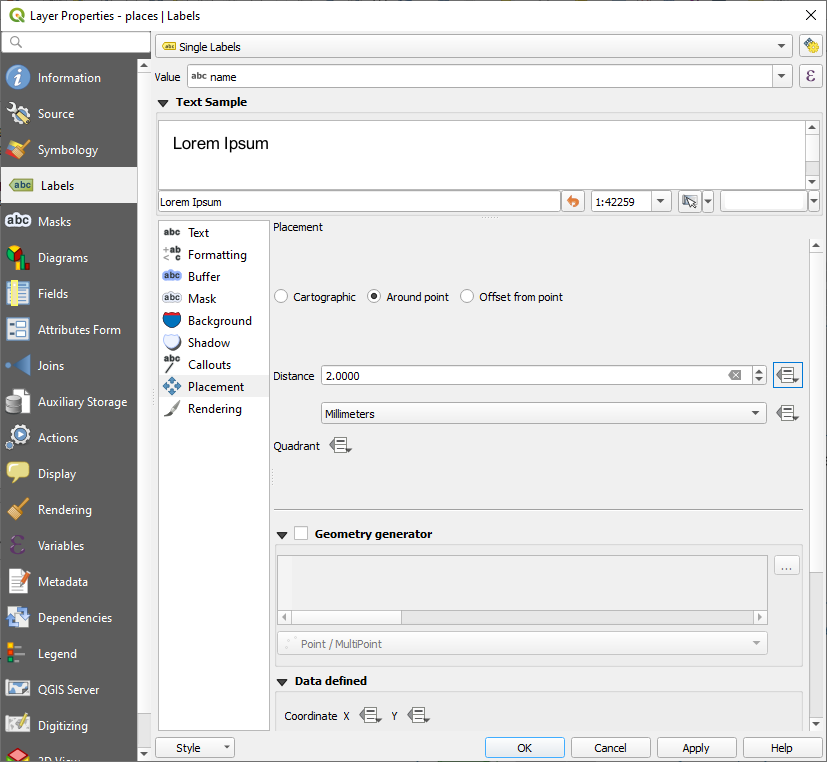
Apply をクリックします。
ラベルはもはやポイントマーカーに重なっていません。
3.2.3.  Follow Along: レイヤーシンボル体系の代わりにラベルを使用する
In many cases, the location of a point doesn't need to be very specific. For
example, most of the points in the places layer refer to entire
towns or suburbs, and the specific point associated with such features is not
that specific on a large scale. In fact, giving a point that is too specific is
often confusing for someone reading a map.
例を挙げると: 例えば、世界地図上では欧州連合のために与えられた点はポーランドのどこかにあります。 European Union のラベルの付いたポイントがポーランドにあるので、地図を読んでいる人には欧州連合の首都はポーランドにあるように見える場合があります。
だから、この種の誤解を防ぐためにポイントシンボルを非アクティブ化してラベルに完全に置き換えるのがよい場合があります。
QGISではラベルが参照するポイントの直上にラベルの位置を変更することによってこれを行うことができます。
Open the
Labels tab of the
Layer Properties dialog for the placeslayerSelect the Placement option from the options list
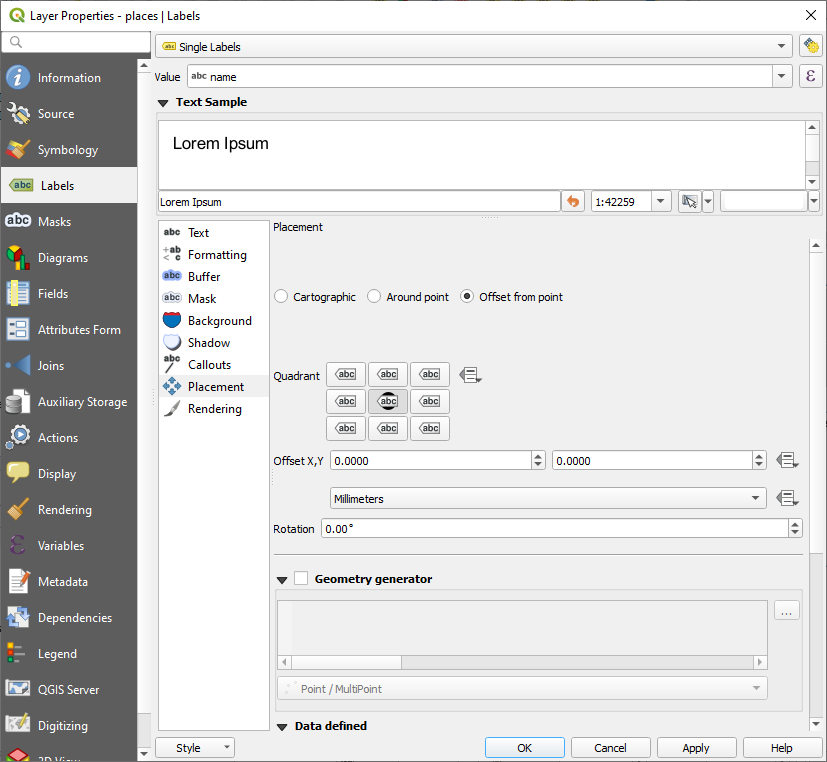
Click on the Offset from point button
ポイントマーカーとの相対位置でラベルの位置を設定することのできる 象限 オプションが現れます。この場合、ラベルは点を中心に配置したいので中央の象限を選択します:
Hide the point symbols by editing the layer Symbology as usual, and setting the size of the Marker size to
0.0: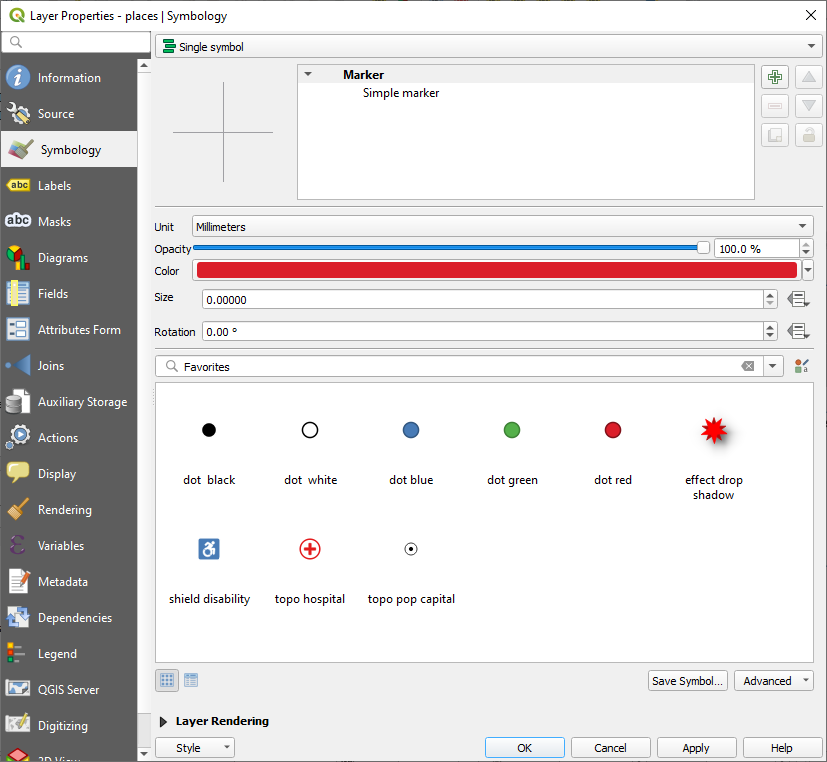
Click Apply and you'll see this result:
If you were to zoom out on the map, you would see that some of the labels
disappear at larger scales to avoid overlapping. Sometimes this is what you
want when dealing with datasets that have many points, but at other times
you will lose useful information this way. There is another possibility for
handling cases like this, which we'll cover in a later exercise in this lesson.
For now, zoom out and click on the  button in the toolbar
and see what happens.
button in the toolbar
and see what happens.
3.2.4. Try Yourself ラベルのカスタマイズ
Reset the label and symbol settings to have a point marker and a label offset of
2.0Millimeters.
Set the map to the scale
1:100000. You can do this by typing it into the Scale box in the Status Bar. Modify your labels to be suitable for viewing at this scale.
3.2.5. Follow Along: ラインにラベルを付ける
これでラベルの作成がどのように動作するかがわかりましたが、まだ別の問題があります。ポイントとポリゴンにラベルを付けるのは簡単ですが、ラインはどうでしょうか? ポイントと同じようにラベルを付ける場合、このようになります:
We will now reformat the roads layer labels so that they are easy to
understand.
Hide the
placeslayer so that it doesn't distract youActivate
Single Labels for the roadslayer as you did above forplacesSet the font Size to
10so that you can see more labelsZoom in on the Swellendam town area
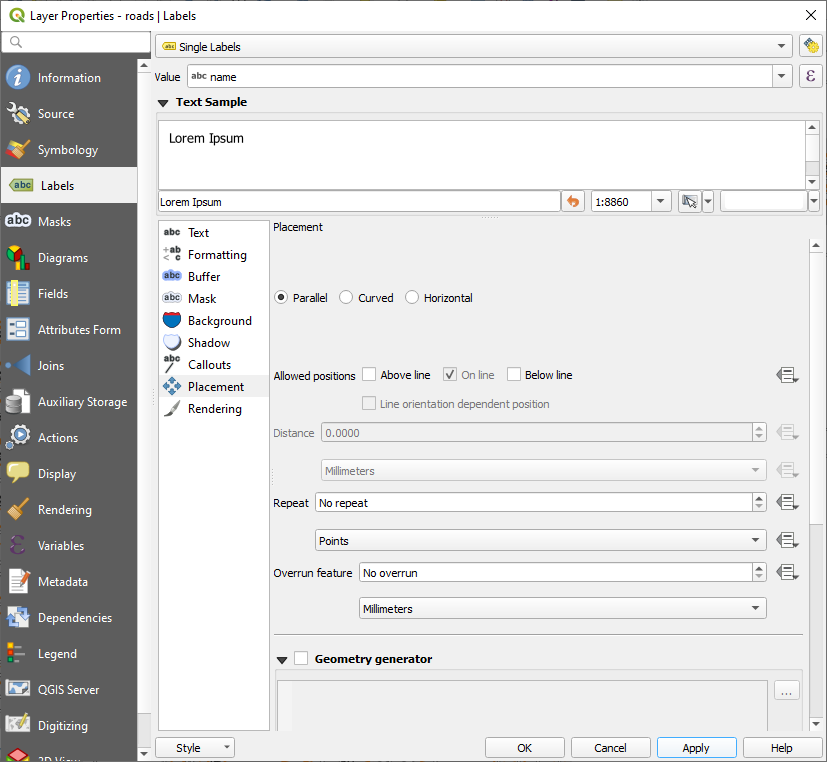
In the Labels tab's Placement tab, choose the following settings:
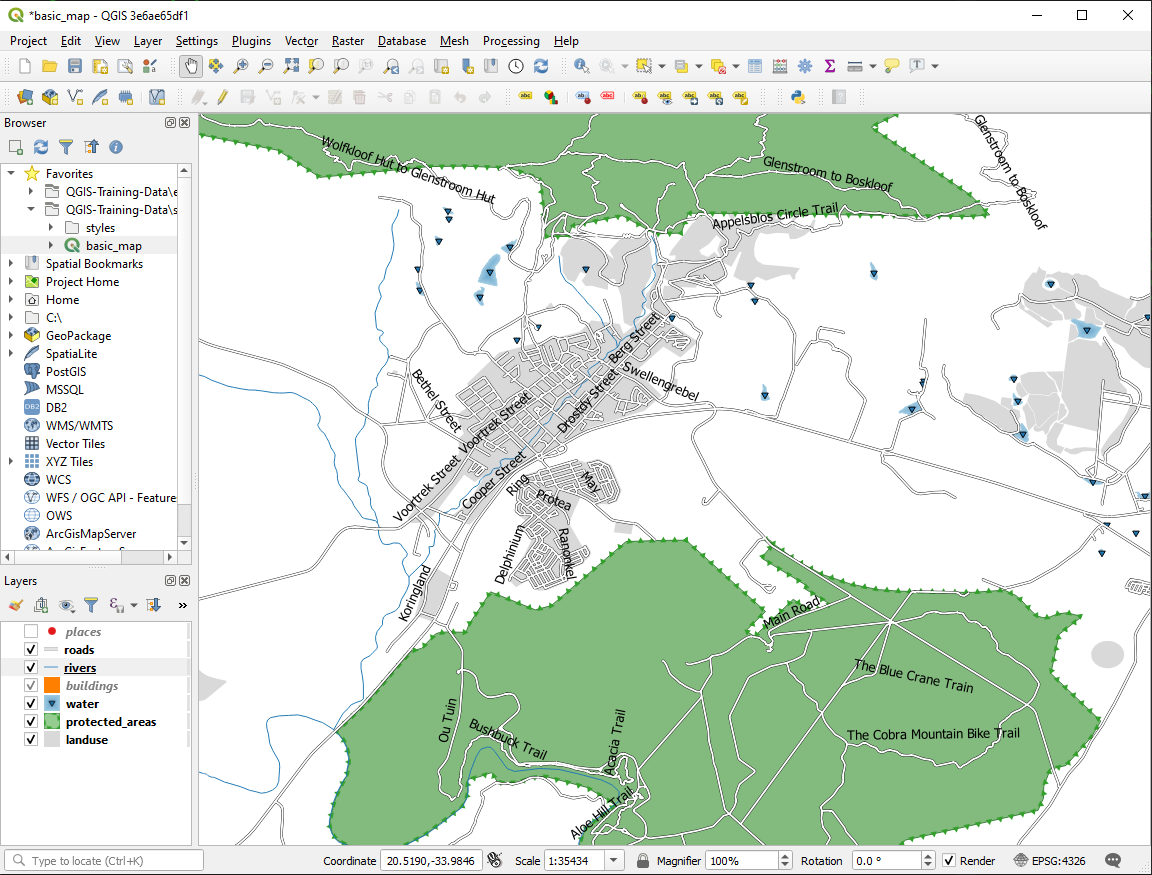
You'll probably find that the text styling has used default values and the labels are consequently very hard to read. Update the Text to use a dark-grey or black Color and the Buffer to use a light-yellow Color.
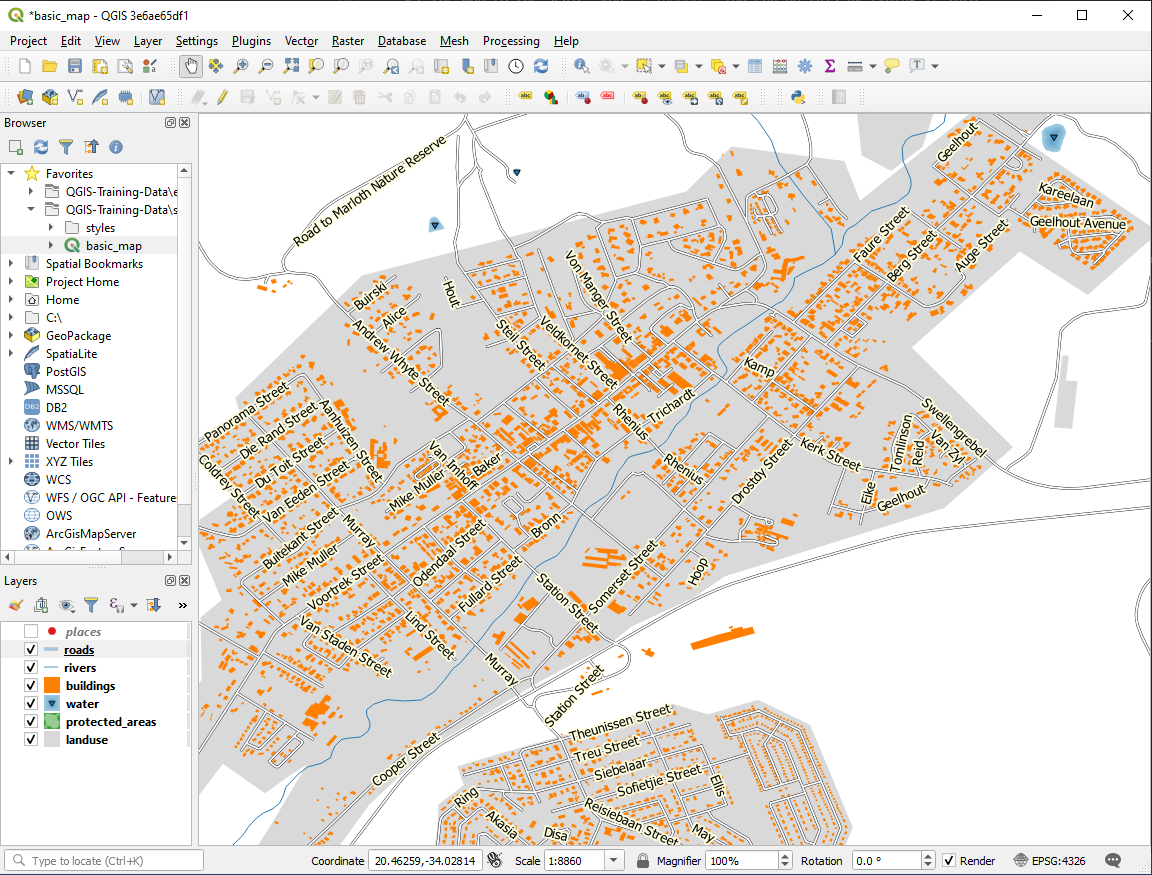
地図は縮尺に応じてこのように見えます:
いくつかの道路名が複数回表示されますがいつも必要だとは限りません。これを防ぐには:
In the Labels tab of the Layer Properties dialog, choose the Rendering option and select Merge connected lines to avoid duplicate labels as shown:
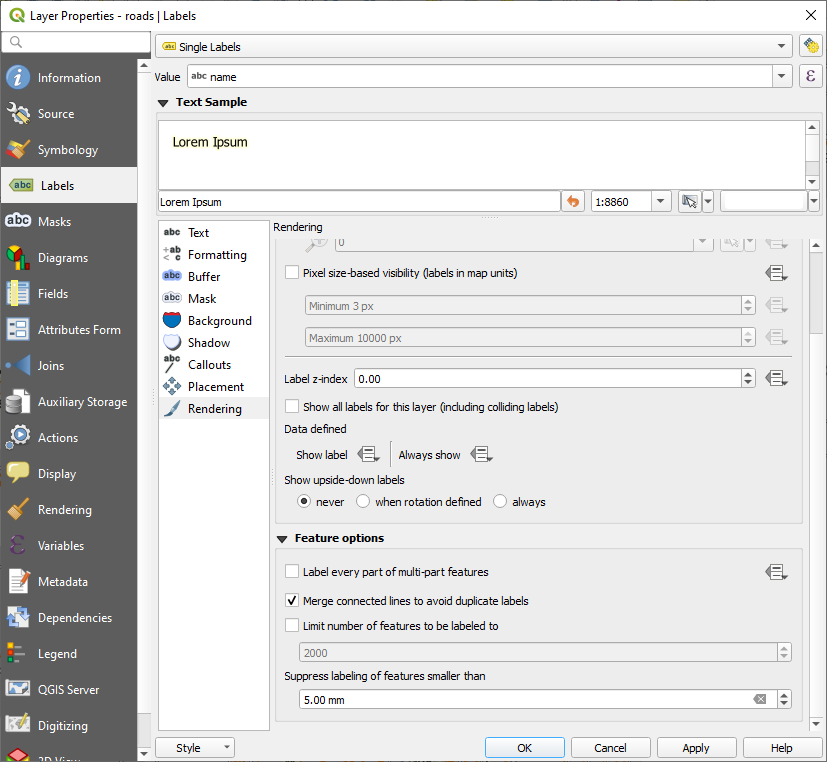
OK をクリックします
もう1つの有用な機能はラベルを付けるには短すぎる地物にラベルが描画されないようにするものです。
In the same Rendering panel, set the value of Suppress labeling of features smaller than ... to
5.00 mmand note the results when you click ApplyTry out different Placement settings as well. As we've seen before, the Horizontal option is not a good idea in this case, so let's try the Curved option instead.
Select the Curved option in the Placement panel of the Labels tab
この結果です:
As you can see, this hides some labels that were previously visible, because of the difficulty of making some of them follow twisting street lines while still being legible. It makes other labels much more useful since they track the roads rather than float in space between them. You can decide which of these options to use, depending on what you think seems more useful or what looks better.
3.2.6.  Follow Along: データ定義による設定
Deactivate labeling for the
roadslayerReactivate labeling for the
placeslayerOpen the attribute table for
placesvia the button
It has one field which is of interest to us now:
placewhich defines the type of urban area for each record. We can use this data to influence the label styles.Navigate to the Text panel in the
placesLabels panelClick the
 button next to the Italic text button beneath
Style and select to open the
Expression String Builder:
button next to the Italic text button beneath
Style and select to open the
Expression String Builder: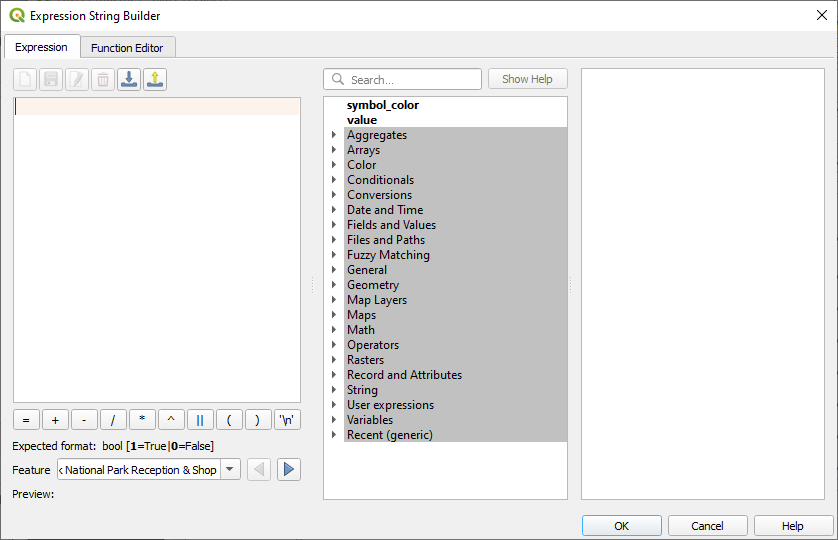
Under , double click on
placeand then click All Unique. This will list all unique values of theplacefield of this layer. Add a=in the text editor and then double click ontown.Alternatively, you can type:
"place" = 'town'directly in the text editor.Click OK twice:
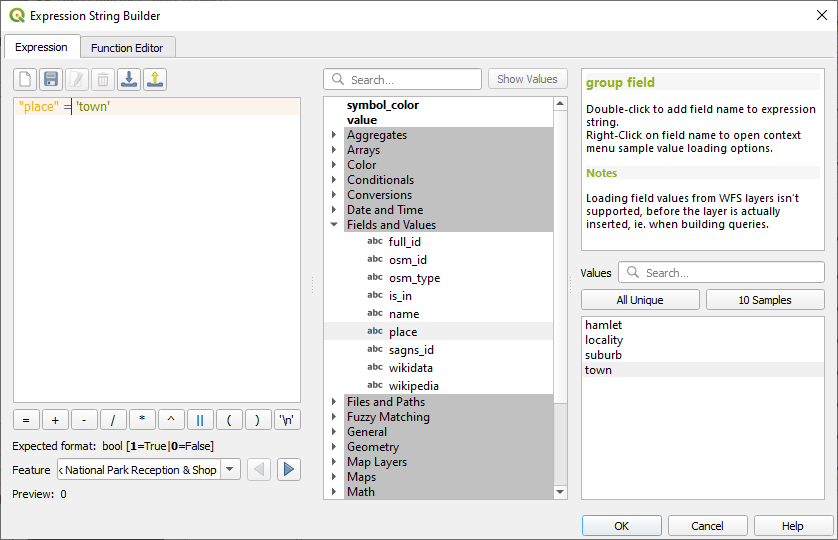
Notice that the labels for all places whose place
field matches town are displayed in italics.
3.2.7. Try Yourself データ定義による設定の使用
注釈
私たちはいくつかの高度なラベル付け設定を示すために、ここで少し先にジャンプしています。高度なレベルでは以下のことが何を意味するか知っていることを想定しています。そうでなければこのセクションは跳ばし、必要な題材をカバーしてから戻って来て下さい。
Open the Attribute Table for
placesEnter edit mode by clicking the
 button
 ボタンを使用して新しい列を追加します
このように構成します:
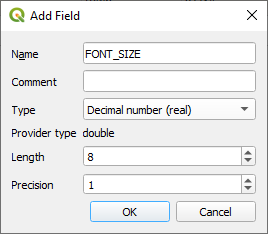
Use this to set custom font sizes for each different type of place (each key in the
placefield)
3.2.8. ラベル付けのさらなる可能性
We can't cover every option in this course, but be aware that the Label tab has many other useful functions. You can set scale-based rendering, alter the rendering priority for labels in a layer, and set every label option using layer attributes. You can even set the rotation, XY position, and other properties of a label (if you have attribute fields allocated for the purpose), then edit these properties using the tools adjacent to the main Layer Labeling Options button:


(これらのツールは必要な属性フィールドが存在して、編集モードの場合にアクティブになります。)
ラベル付けのシステムの可能性をもっと探ってみて下さい。
3.2.9. In Conclusion
動的なラベル作成のためにレイヤーの属性を使用する方法を学びました。これによりあなたの地図の情報量を増やし、地図をスタイリッシュにすることができます!
3.2.10. What's Next?
属性によって地図に視覚的な違いを生じさせる方法がわかりました。オブジェクトそれ自体のシンボル体系を変更するのに属性を使用することはどうでしょうか? 次のレッスンのトピックです!