3.2. Lesson: Labels
어떤 오브젝트에 대한 어떤 정보를 보이기 위해 맵에 라벨을 추가할 수 있습니다. 라벨은 어떤 벡터 레이어와도 연계될 수 있습니다. 이때 라벨의 내용은 해당 레이어의 속성 데이터를 따릅니다.
이 강의의 목표: 레이어에 유용하고 보기 좋은 라벨을 추가하기.
3.2.1.  Follow Along: 라벨 이용
First, ensure that the  button is visible in the GUI:
Go to the menu item
Ensure that the Label Toolbar item has a check mark next to it. If it doesn’t, click on the Label Toolbar item to activate it.
Click on the
placeslayer in the Layers panel so that it is highlightedClick on the
toolbar button to open the
Labels tab of the Layer Styling panelSwitch from No Labels to
Single LabelsYou’ll need to choose which field in the attributes will be used for the labels. In the previous lesson, you decided that the
namefield was the most suitable one for this purpose.Select
namefrom the Value list: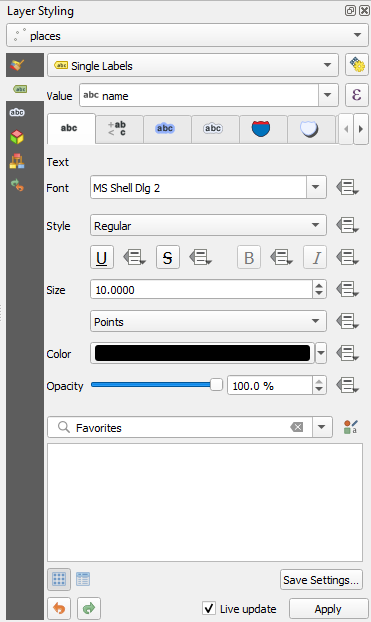
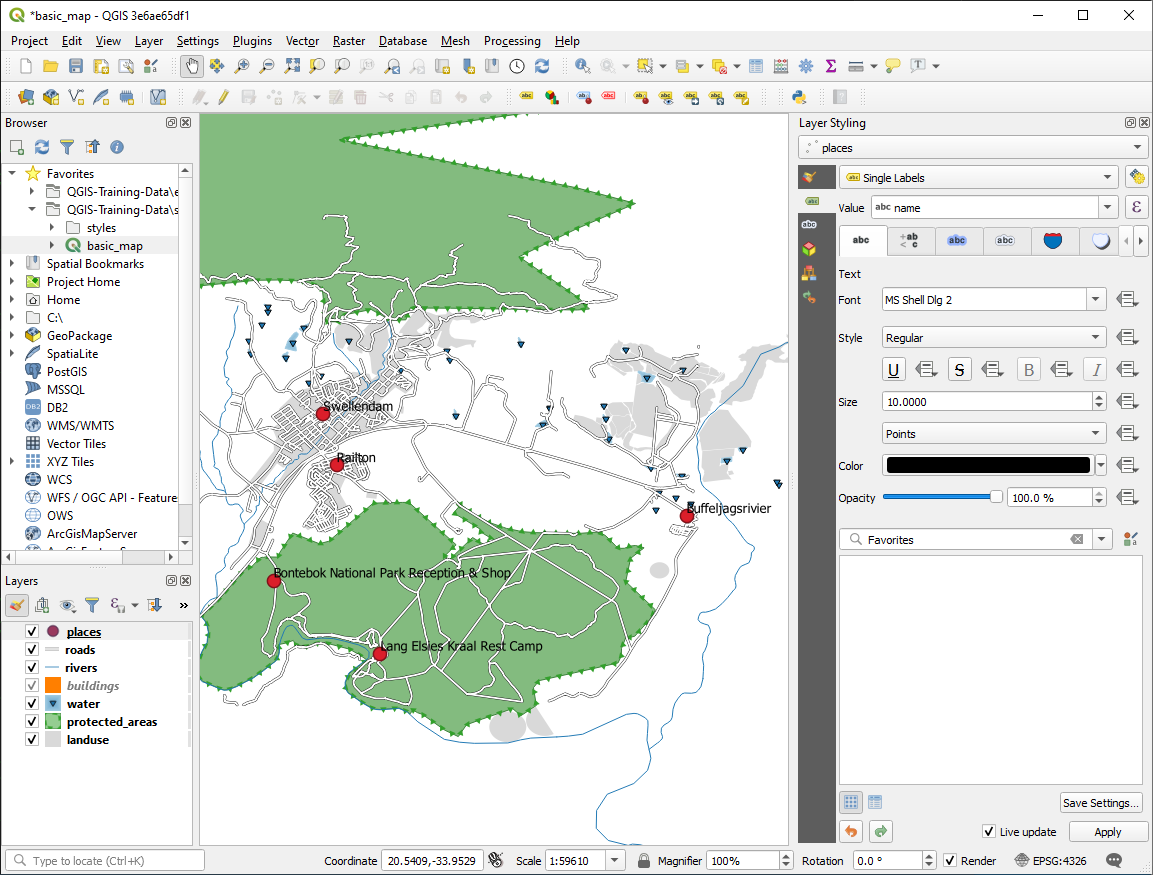
Apply 를 클릭합니다.
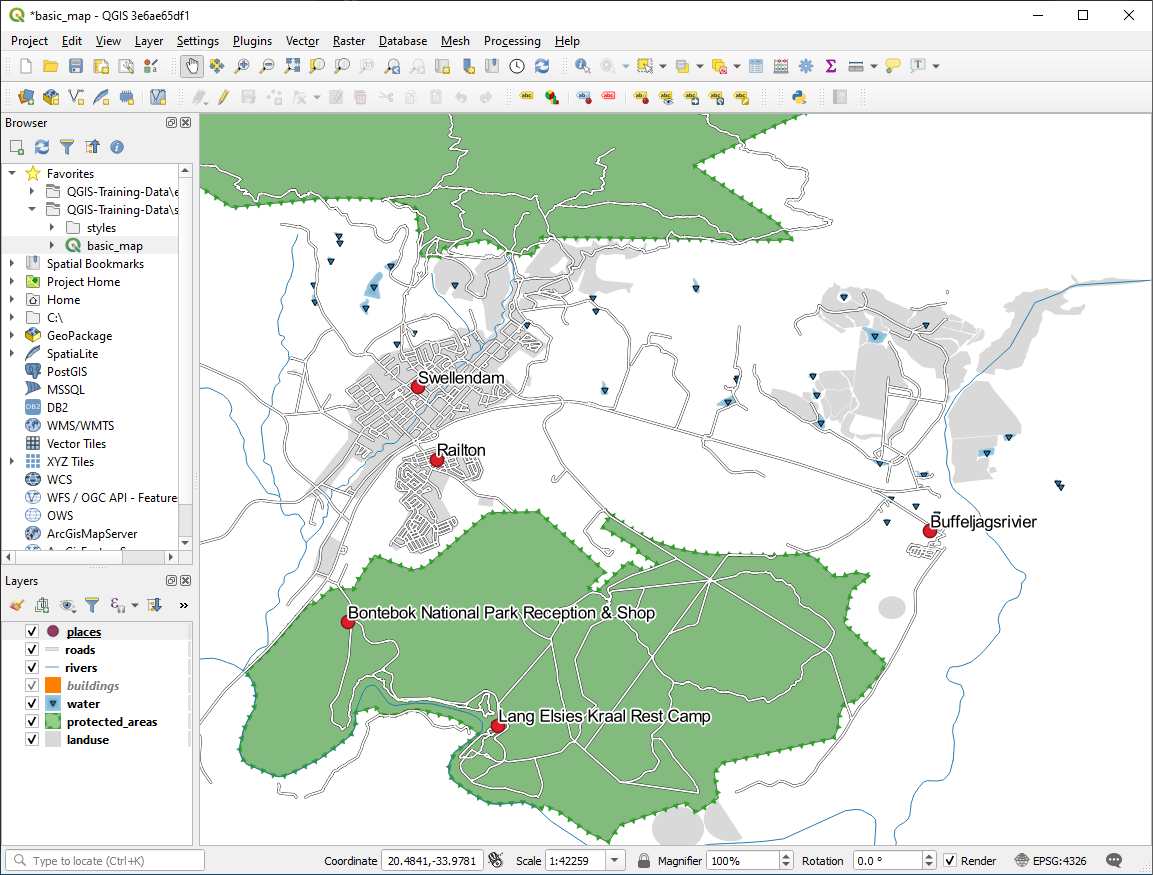
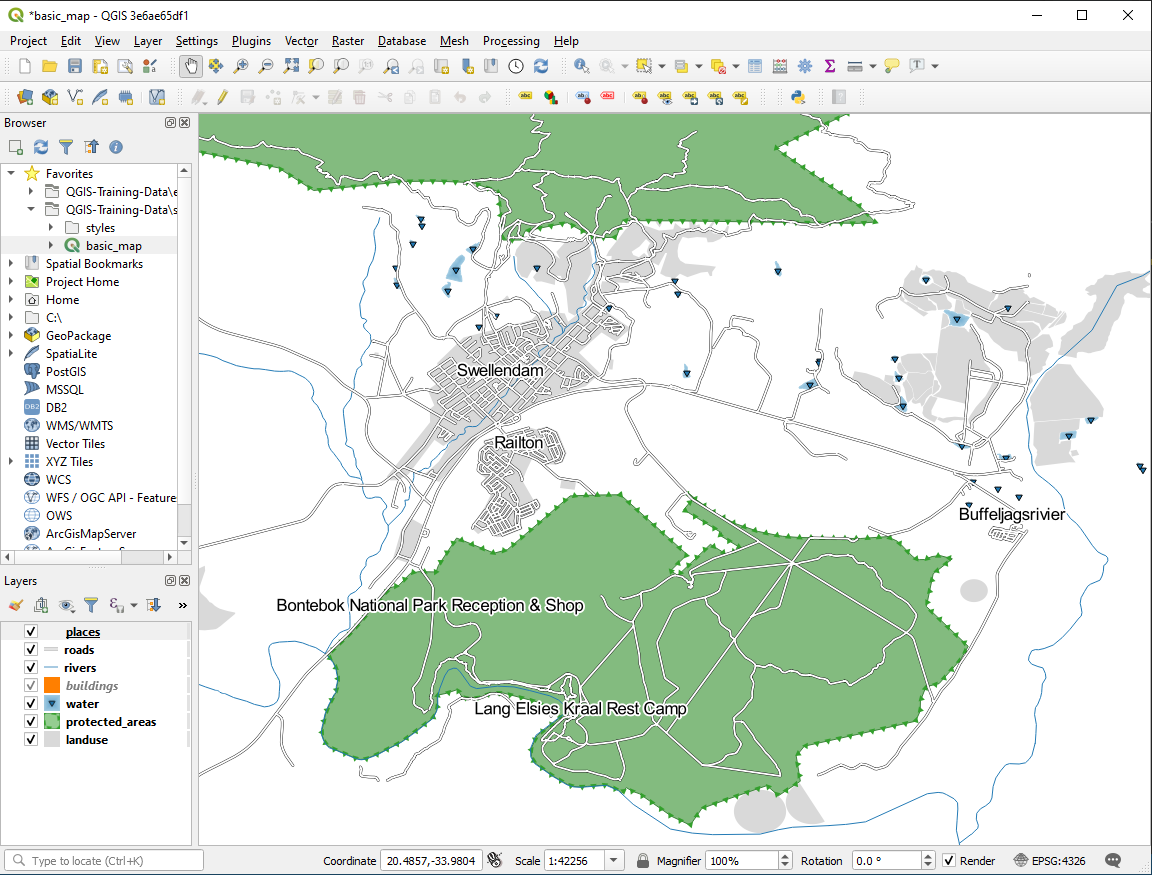
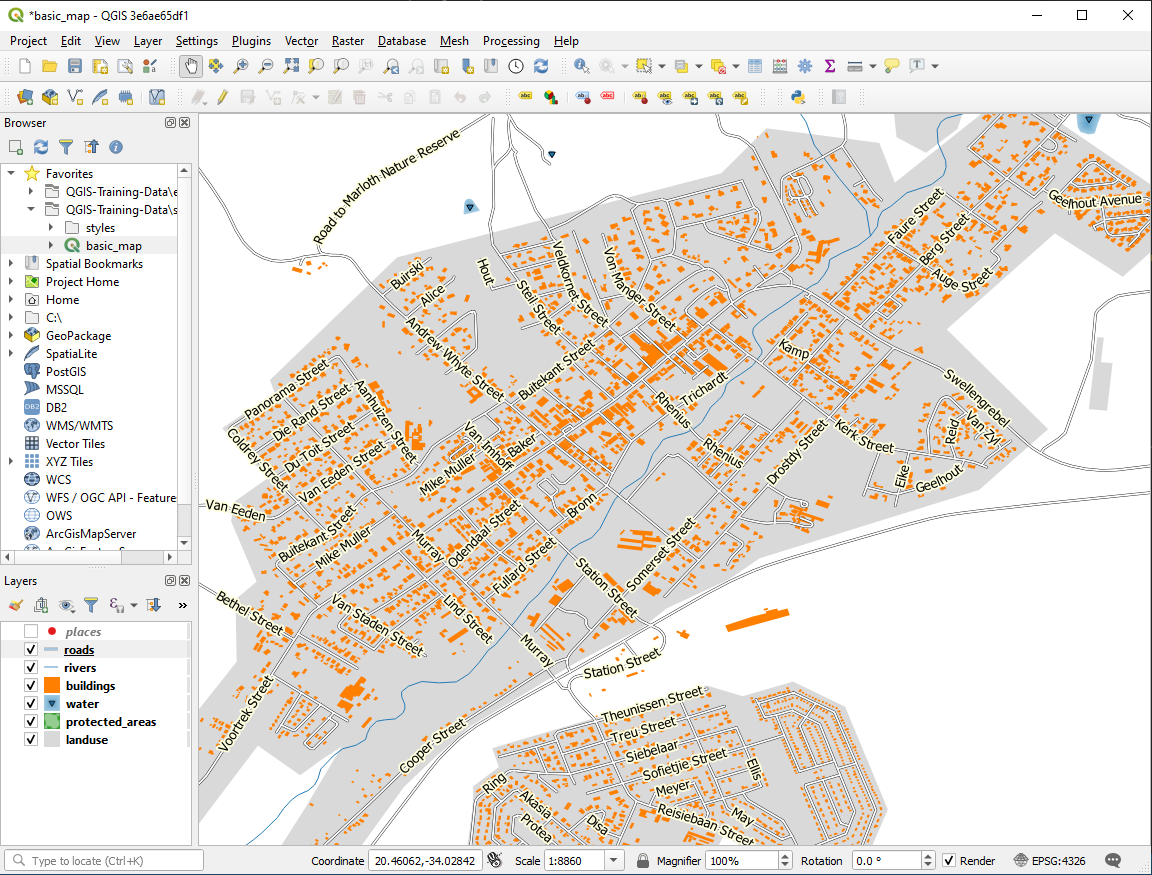
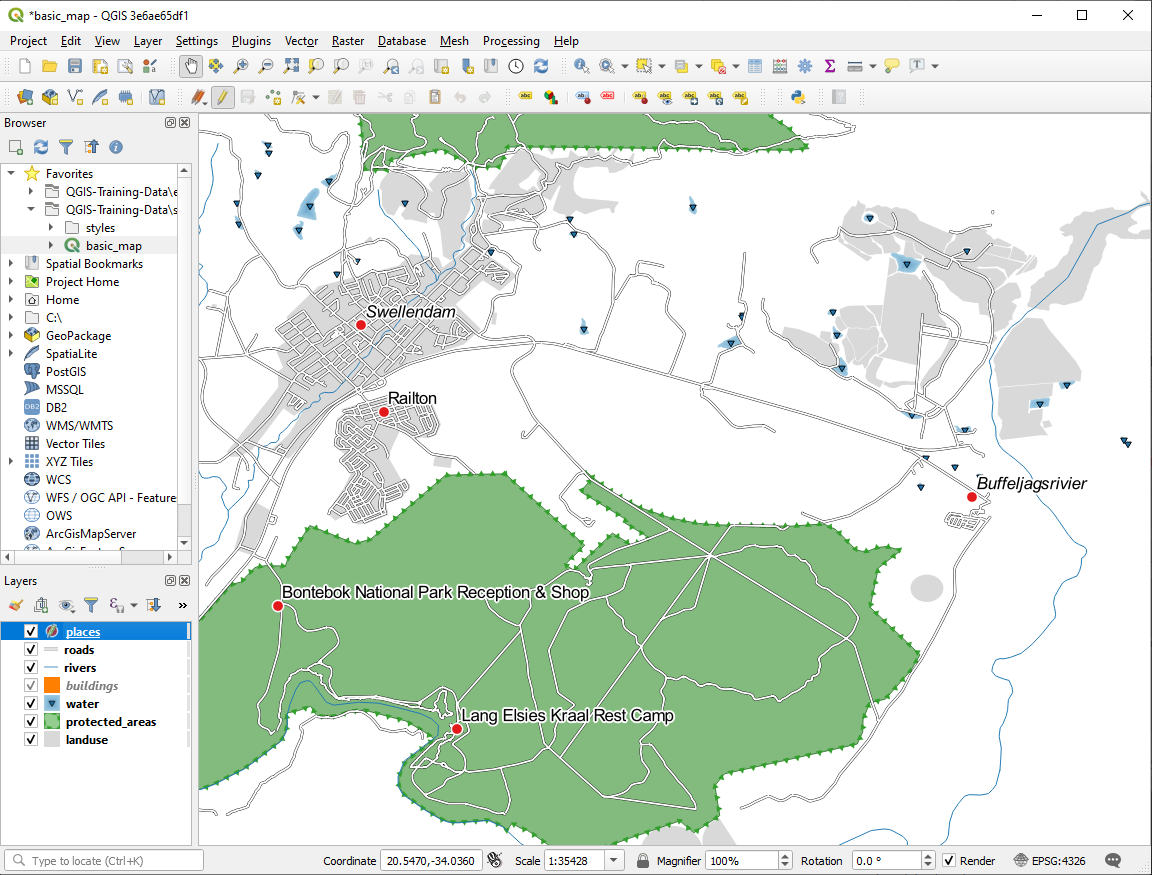
이제 맵 상에 다음과 같은 라벨이 보일 것입니다.
3.2.2. Follow Along: 라벨 옵션 변경
Depending on the styles you chose for your map in earlier lessons, you might find that the labels are not appropriately formatted and either overlap or are too far away from their point markers.
참고
Above, you used the button in the
Label Toolbar to open the Layer Styling panel. As
with Symbology, the same label options are available via both
the Layer Styling panel and the Layer Properties
dialog. Here, you’ll use the Layer Properties dialog.
Open the Layer Properties dialog by double-clicking on the
placeslayerSelect the
Labels tab왼쪽 옵션 목록에서 Text 를 선택한 다음, 다음과 같이 텍스트 서식 옵션을 변경하십시오.
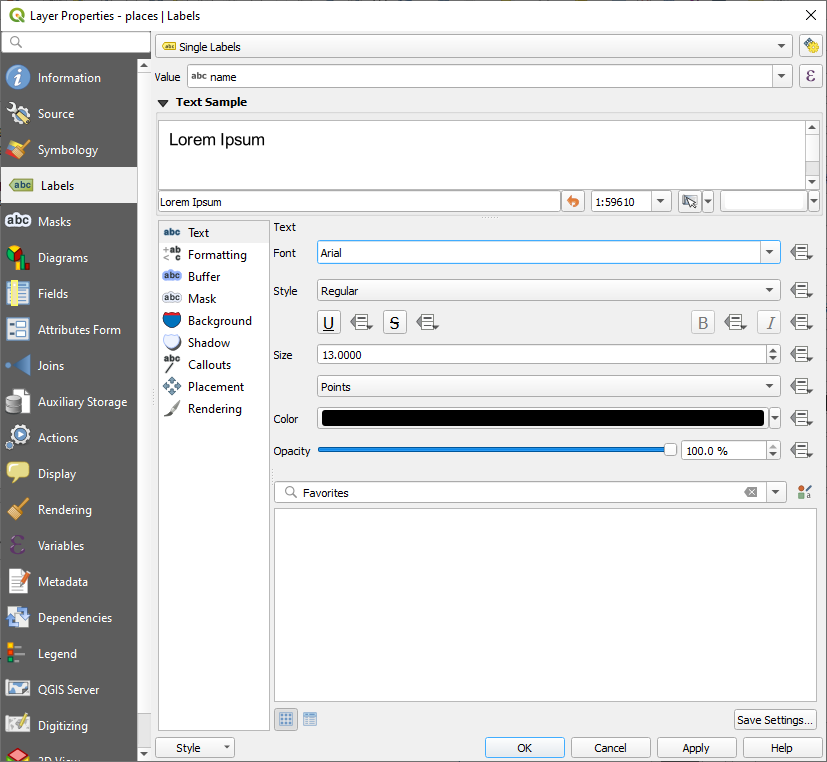
Apply 를 클릭합니다.
That font may be larger and more familiar to users, but its readability is still dependent on what layers are rendered beneath it. To solve this, let’s take a look at the Buffer option.
Select Buffer from the left-hand options list
Draw text buffer 옆의 체크박스를 체크한 다음, 다음과 같이 텍스트 서식 옵션을 변경하십시오.
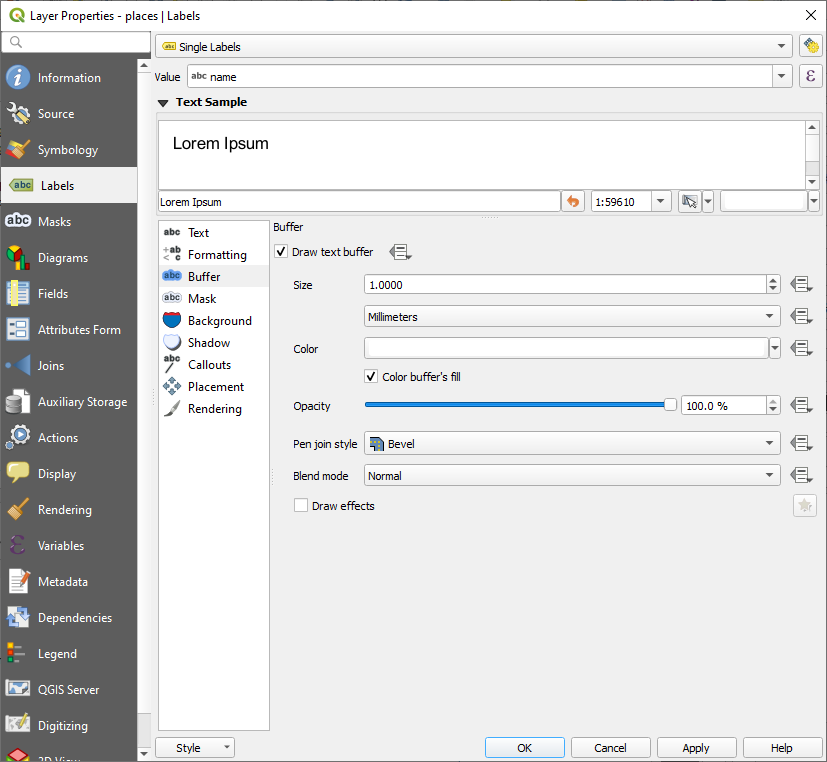
Apply 를 클릭합니다.
places 라벨에 색상 버퍼 또는 윤곽선이 추가되어 맵 상에서 더 잘 보이는 것을 알 수 있습니다.
이제 라벨의 위치를 상응하는 위치 표식에 맞춰보겠습니다.
Select Placement from the left-hand options list
Select Around point and change the value of Distance to
2.0Millimeters: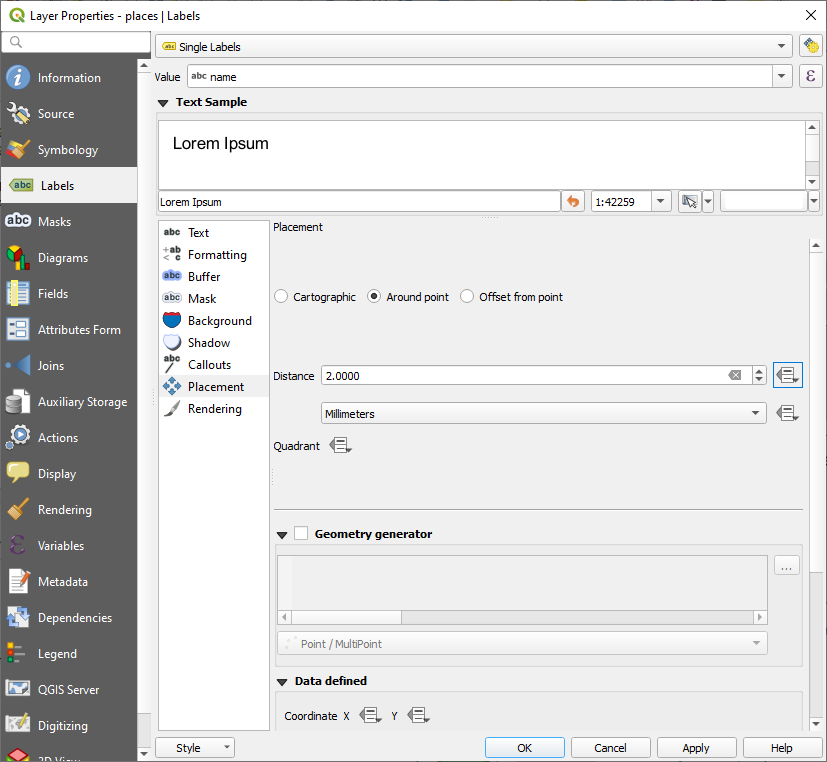
Apply 를 클릭합니다.
이제 라벨이 위치 표식을 가리지 않는다는 사실을 알 수 있습니다.
3.2.3.  Follow Along: 레이어 심볼 대신 라벨 사용
In many cases, the location of a point doesn’t need to be very specific. For
example, most of the points in the places layer refer to entire
towns or suburbs, and the specific point associated with such features is not
that specific on a large scale. In fact, giving a point that is too specific is
often confusing for someone reading a map.
다음과 같은 예를 들어봅시다. 세계 지도 상에서 유럽 연합을 나타내는 포인트가 폴란드 근처에 위치할 수도 있습니다. 이런 맵을 읽을 때 유럽 연합 이라는 라벨을 가진 포인트가 폴란드에 있다면 유럽 연합의 수도가 폴란드라고 착각할 수 있습니다.
따라서 이런 종류의 오해를 피하기 위해 포인트 심볼을 비활성화하고 대신 라벨만을 표출시키는 작업도 유용합니다.
QGIS에서는 라벨의 위치를 상응하는 포인트 바로 위로 변경해서 렌더링하는 방법을 쓸 수 있습니다.
Open the
Labels tab of the
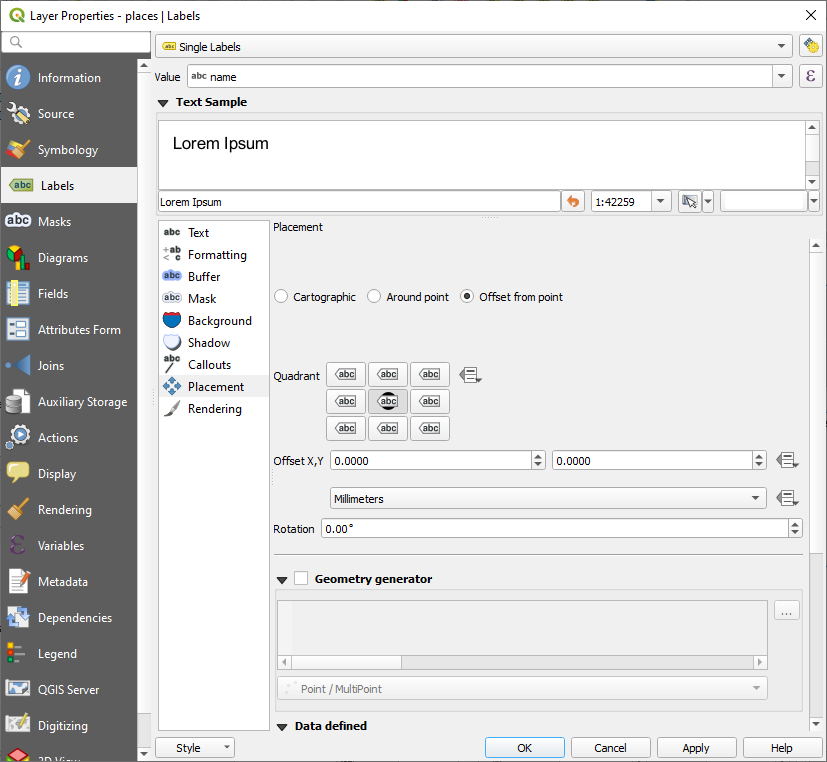
Layer Properties dialog for the placeslayerSelect the Placement option from the options list
Click on the Offset from point button
위치 표식을 기준으로 라벨의 위치를 설정할 수 있는 Quadrant 옵션이 나타날 것입니다. 이 예제의 경우, 라벨의 중심을 위치 표식에 맞추고자 하기 때문에 center quadrant 를 선택합니다.
Hide the point symbols by editing the layer Symbology as usual, and setting the size of the Marker size to
0.0: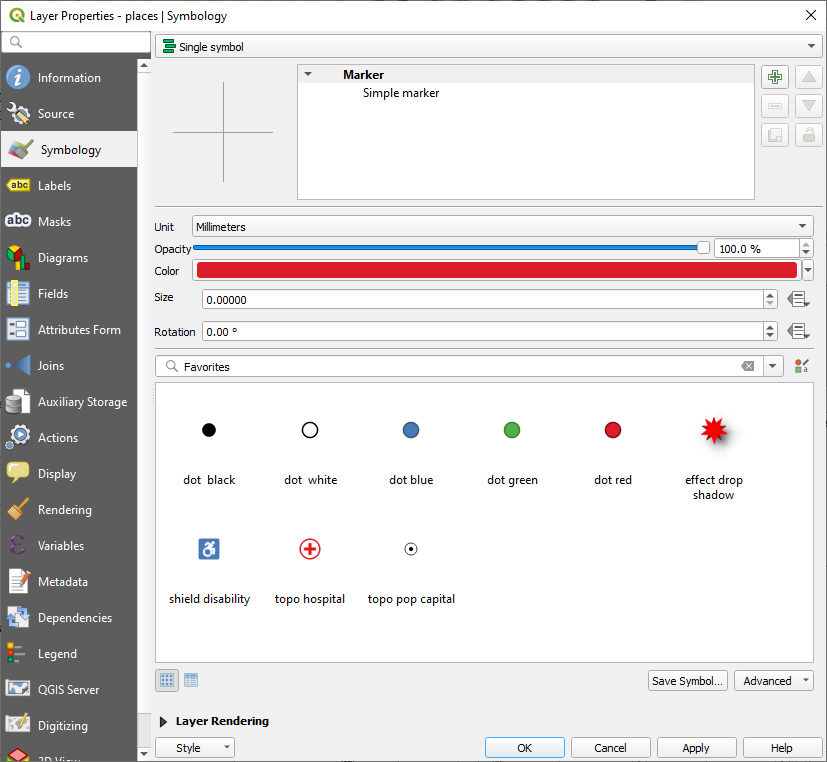
Click Apply and you’ll see this result:
If you were to zoom out on the map, you would see that some of the labels
disappear at larger scales to avoid overlapping. Sometimes this is what you
want when dealing with datasets that have many points, but at other times
you will lose useful information this way. There is another possibility for
handling cases like this, which we’ll cover in a later exercise in this lesson.
For now, zoom out and click on the  button in the toolbar
and see what happens.
button in the toolbar
and see what happens.
3.2.4. Try Yourself 사용자 지정 라벨
Reset the label and symbol settings to have a point marker and a label offset of
2.0Millimeters.
Set the map to the scale
1:100000. You can do this by typing it into the Scale box in the Status Bar. Modify your labels to be suitable for viewing at this scale.
3.2.5. Follow Along: 라인 라벨 작업
이제 라벨 작업을 어떻게 하는지 알게 됐지만, 또 다른 문제가 있습니다. 포인트와 폴리곤의 라벨 작업은 쉽습니다. 하지만 라인은 어떨까요? 라인 라벨을 포인트의 경우와 똑같이 작업하면, 다음과 같은 결과를 얻게 됩니다.
We will now reformat the roads layer labels so that they are easy to
understand.
Hide the
placeslayer so that it doesn’t distract youActivate
Single Labels for the roadslayer as you did above forplacesSet the font Size to
10so that you can see more labelsZoom in on the Swellendam town area
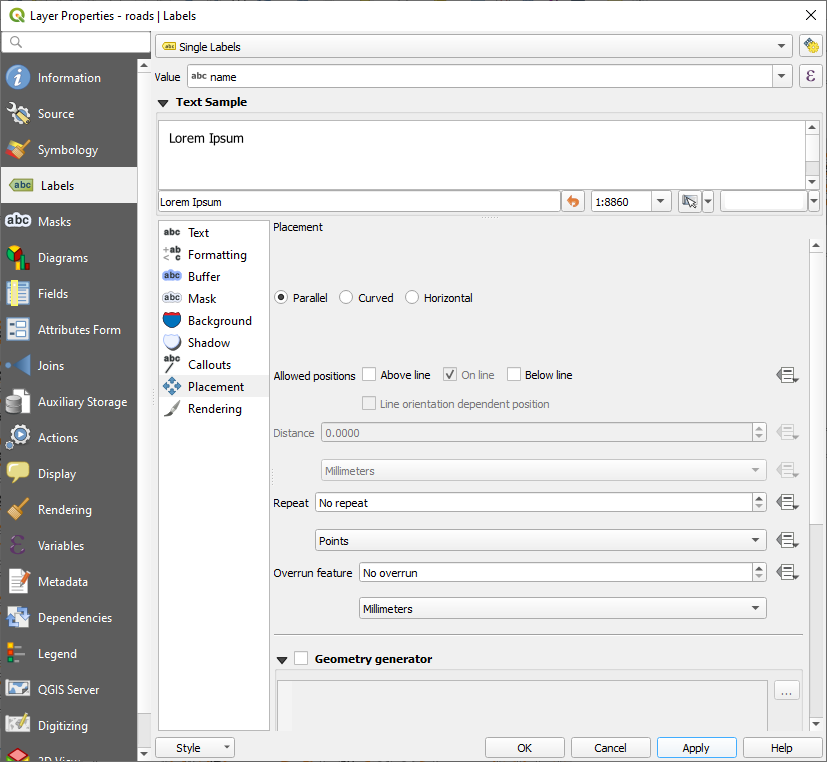
In the Labels tab’s Placement tab, choose the following settings:
You’ll probably find that the text styling has used default values and the labels are consequently very hard to read. Update the Text to use a dark-grey or black Color and the Buffer to use a light-yellow Color.
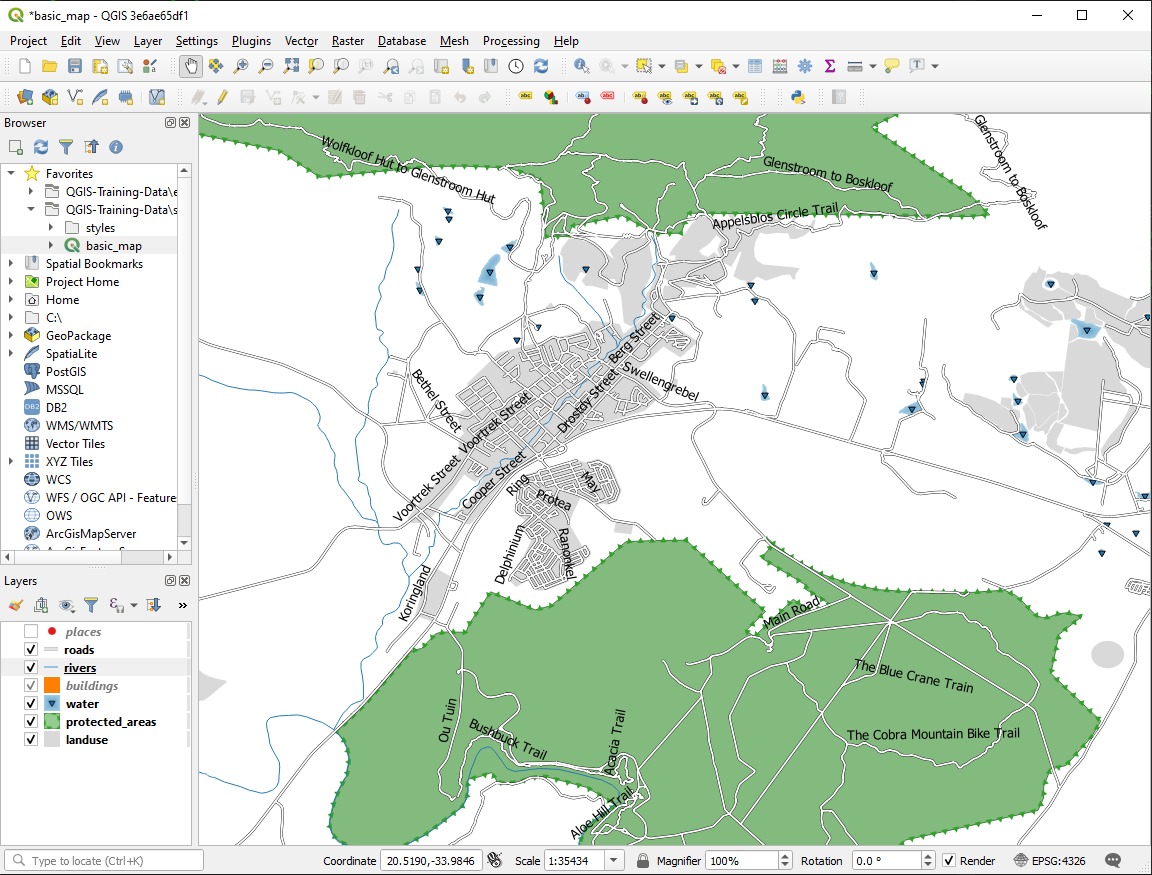
축척에 따라 다르지만, 사용자 맵이 다음처럼 보일 것입니다.
도로명 일부가 반복적으로 나타나는데, 반드시 필요하지는 않습니다. 이렇게 반복되지 않게 하려면,
In the Labels tab of the Layer Properties dialog, choose the Rendering option and select Merge connected lines to avoid duplicate labels as shown:
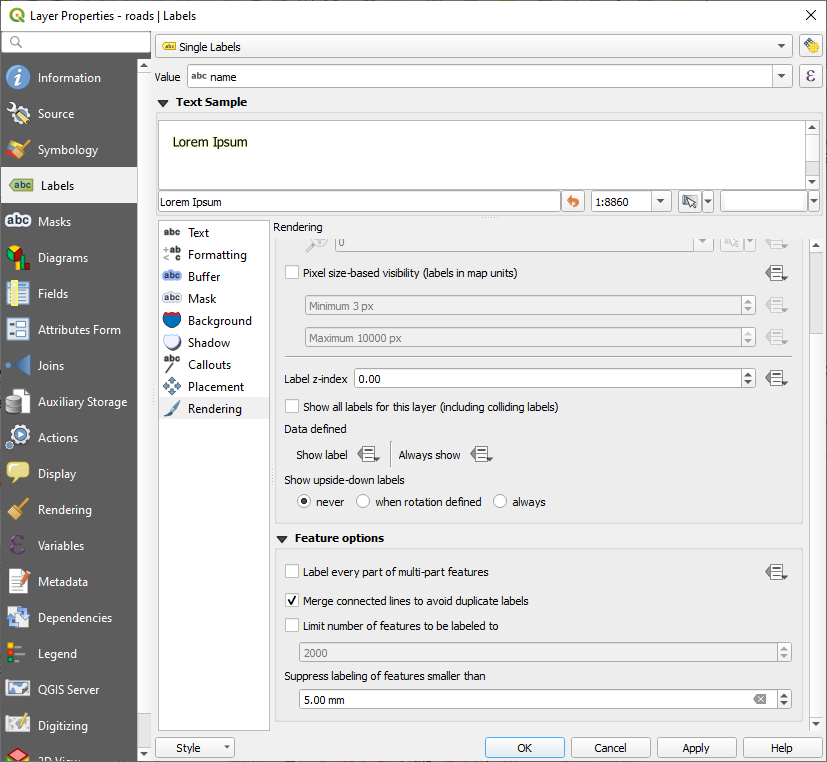
OK 를 클릭합니다.
알아차리기에는 너무 짧은 피처에 라벨이 붙는 일을 막기 위한 유용한 기능도 있습니다.
In the same Rendering panel, set the value of Suppress labeling of features smaller than … to
5.00 mmand note the results when you click ApplyTry out different Placement settings as well. As we’ve seen before, the Horizontal option is not a good idea in this case, so let’s try the Curved option instead.
Select the Curved option in the Placement panel of the Labels tab
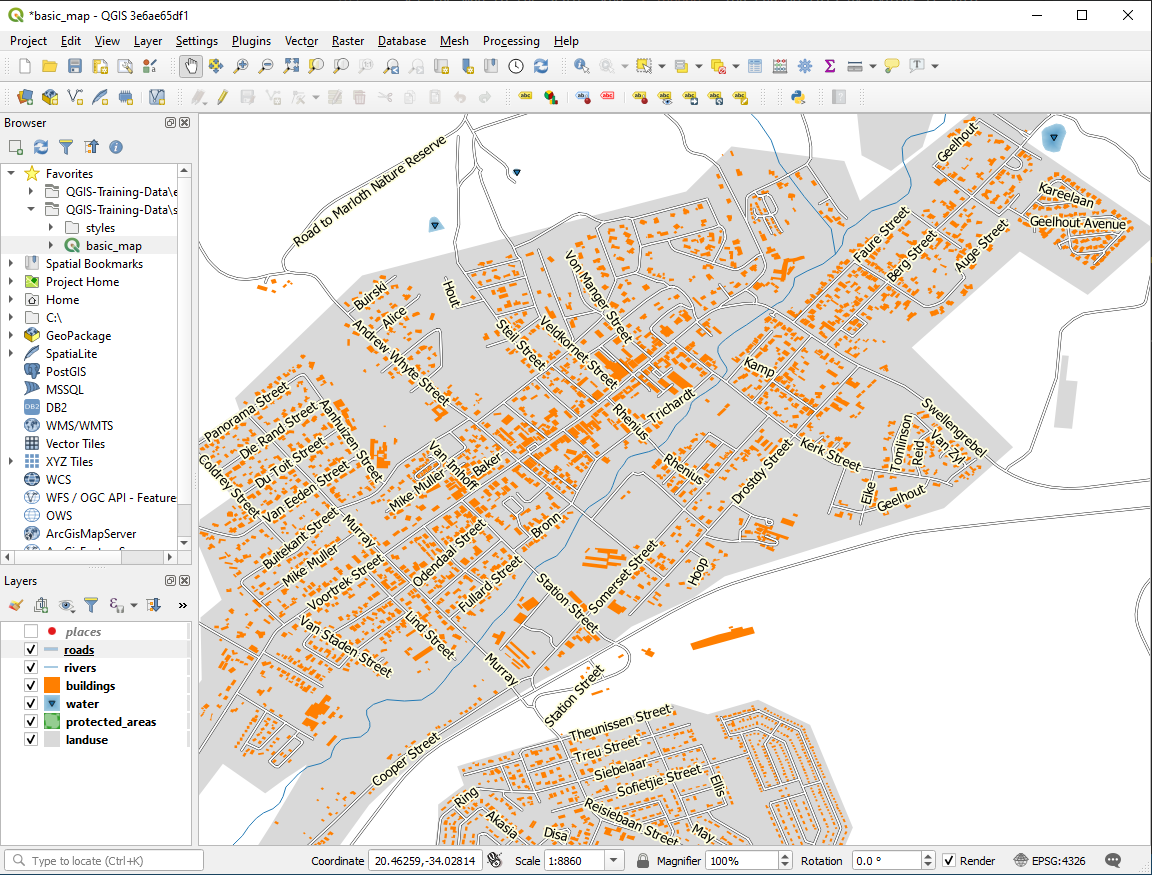
결과는 다음과 같습니다.
As you can see, this hides some labels that were previously visible, because of the difficulty of making some of them follow twisting street lines while still being legible. It makes other labels much more useful since they track the roads rather than float in space between them. You can decide which of these options to use, depending on what you think seems more useful or what looks better.
3.2.6.  Follow Along: 데이터 정의 설정
Deactivate labeling for the
roadslayerReactivate labeling for the
placeslayerOpen the attribute table for
placesvia the button
It has one field which is of interest to us now:
placewhich defines the type of urban area for each record. We can use this data to influence the label styles.Navigate to the Text panel in the
placesLabels panelClick the
 button next to the Italic text button beneath
Style and select to open the
Expression String Builder:
button next to the Italic text button beneath
Style and select to open the
Expression String Builder: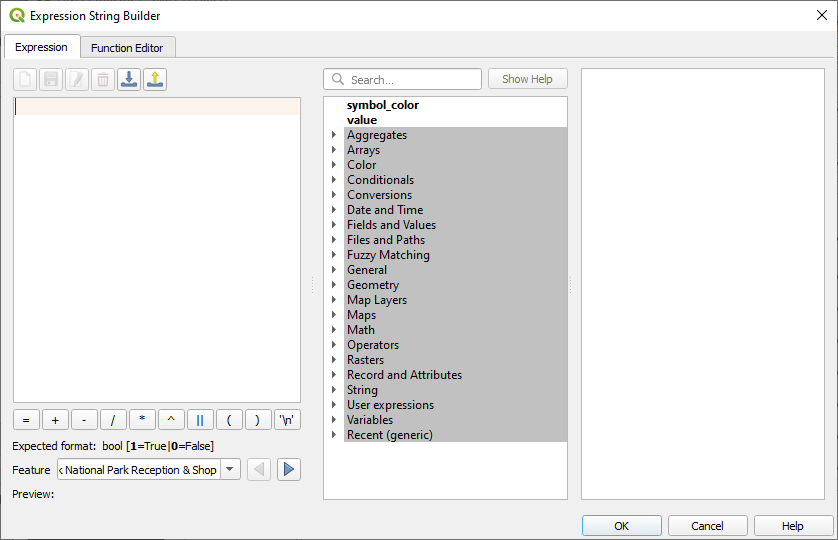
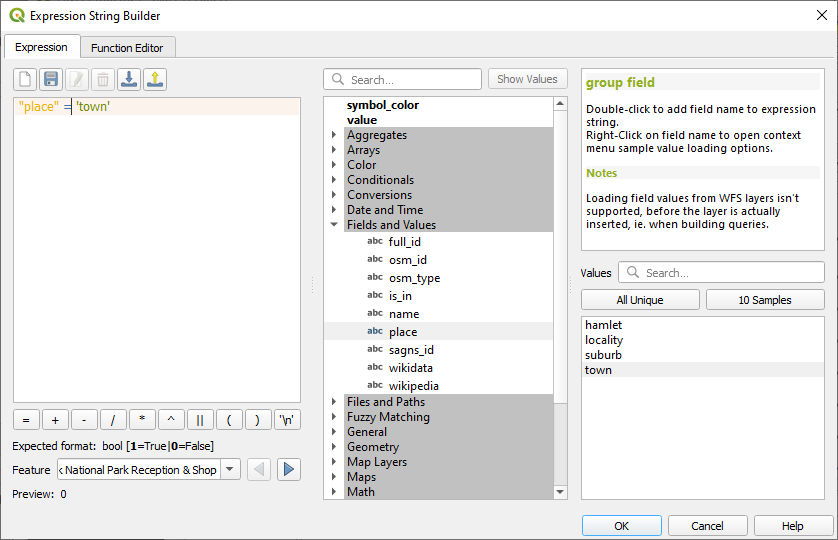
Under , double click on
placeand then click All Unique. This will list all unique values of theplacefield of this layer. Add a=in the text editor and then double click ontown.Alternatively, you can type:
"place" = 'town'directly in the text editor.Click OK twice:
Notice that the labels for all places whose place
field matches town are displayed in italics.
3.2.7. Try Yourself 데이터 정의 설정 사용
참고
고급 라벨 작업 설정의 일부를 보여드리기 위해 조금 앞으로 뛰어넘겠습니다. 고급 수준에서는 여러분이 다음 내용을 이해한다고 가정합니다. 이해가 안 된다면 이 부분을 건너뛰어도 좋습니다. 필요한 내용을 학습한 후에 다시 시도해보십시오.
Open the Attribute Table for
placesEnter edit mode by clicking the
 button
Add a new column with the
 button
다음과 같이 설정합니다.
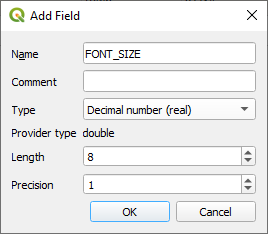
Use this to set custom font sizes for each different type of place (each key in the
placefield)
3.2.8. 라벨 작업의 더 많은 가능성들
We can’t cover every option in this course, but be aware that the Label tab has many other useful functions. You can set scale-based rendering, alter the rendering priority for labels in a layer, and set every label option using layer attributes. You can even set the rotation, XY position, and other properties of a label (if you have attribute fields allocated for the purpose), then edit these properties using the tools adjacent to the main Layer Labeling Options button:


(필요한 속성 항목이 존재하고 사용자가 편집 모드일 경우 이 도구들이 활성화될 것입니다.)
여러분 마음대로 라벨 작업 시스템의 가능성을 탐색해보십시오.
3.2.9. In Conclusion
이제 레이어 속성을 이용해서 동적인 라벨을 생성하는 방법을 배웠으니, 여러분의 맵을 더욱 유익하고 멋지게 만들 수 있게 됐습니다!
3.2.10. What’s Next?
이제 속성이 여러분의 맵에 어떻게 시각적인 변화를 줄 수 있는지 알게 됐으니, 오브젝트 그 자체의 심볼을 바꾸는 데 이용해보는 건 어떨까요? 이것이 바로 다음 강의의 주제입니다!