21. 답안지
21.1. Results For 인터페이스 개요
21.1.1.  개요 (Part 1)
인터페이스 레이아웃을 보여주는 이미지를 다시 참조하고, 스크린에 나타난 요소들의 명칭과 기능을 기억하는지 확인하십시오.
21.1.2. 개요 (Part 2)
Save as
Zoom to layer
Invert selection
Rendering on/off
Measure line
21.2. Results For 첫 레이어 추가
21.2.1. 준비
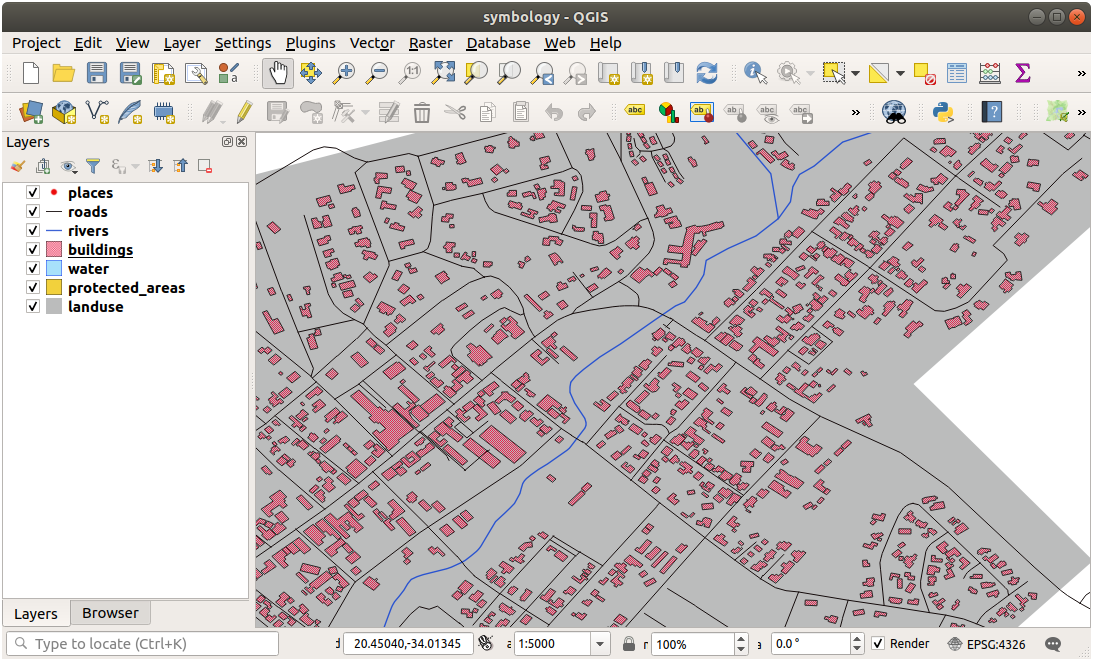
이 대화창의 주 영역에서 서로 다른 색상을 가진 많은 도형이 보일 것입니다. 각 도형은 왼쪽 패널에서 해당 도형의 색상으로 식별할 수 있는 레이어에 속합니다. (사용자 화면에 보이는 색상은 다음 그림의 색상과 다를 수도 있습니다):
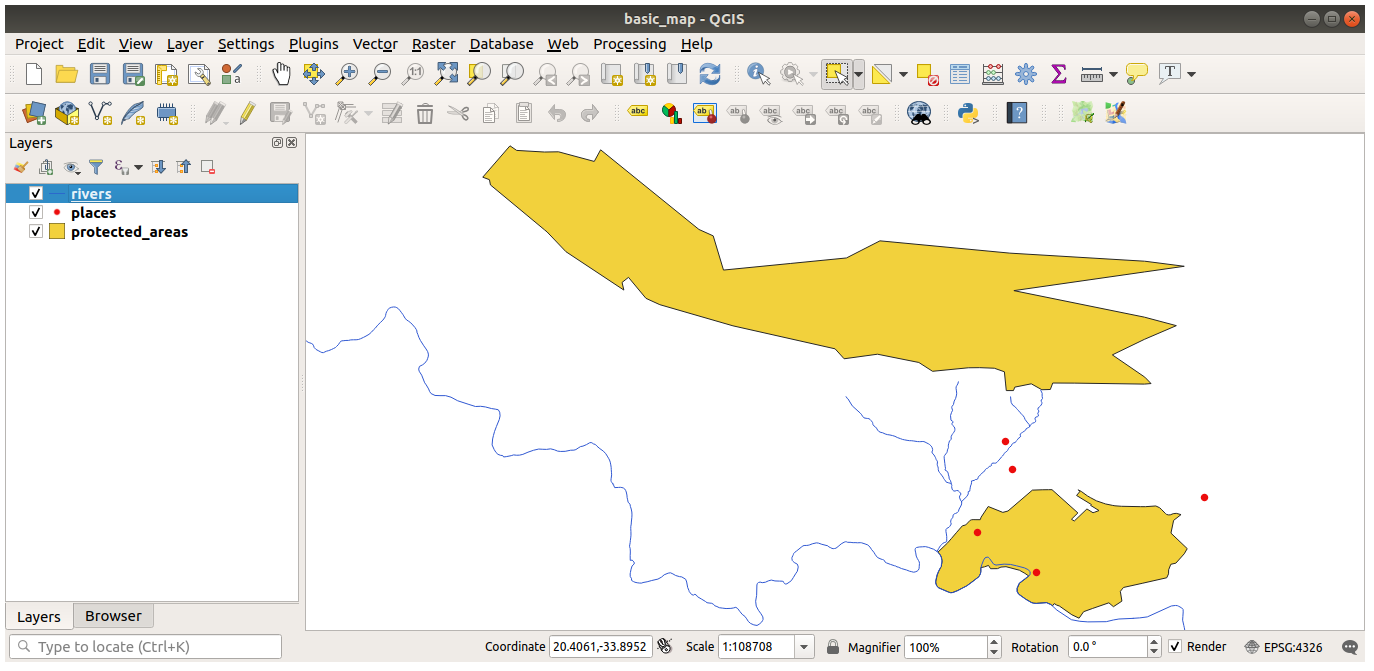
21.2.2. 데이터 불러오는 중
사용자 맵이 레이어 7개를 담고 있어야 합니다:
protected_areas
places
rivers
roads
landuse
(
training_data.gpkg에서 가져온) buildings 및(
exercise_data/shapefile에서 가져온) water.
21.3. Results For 심볼
21.3.1. 색상
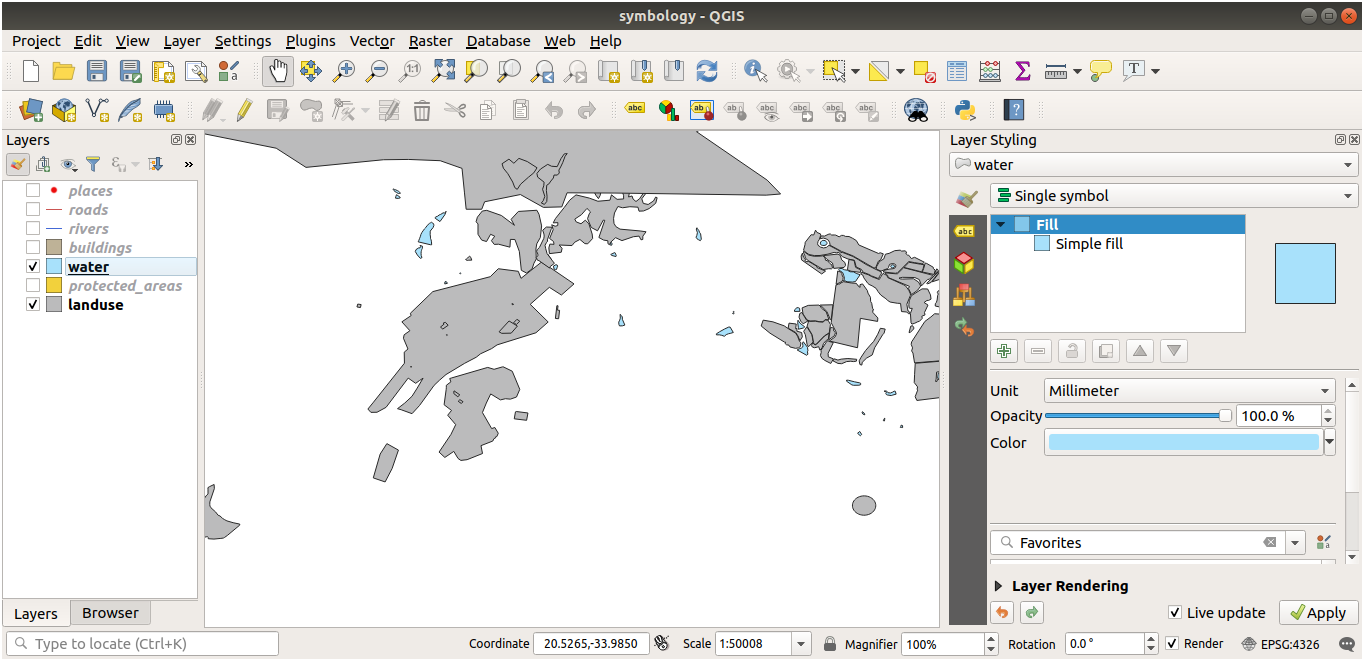
사용자가 예상한 대로 색상이 바뀌었는지 확인하십시오.
범례에서 water 레이어를 선택한 다음
 Open the Layer Styling panel 버튼을 누르면 끝입니다. 수면 레이어에 어울리는 색상으로 변경하십시오.
참고
다른 레이어에 신경쓰지 않고 한 번에 레이어 하나만 작업하고 싶다면 레이어 목록의 레이어명 옆에 있는 체크박스를 클릭해서 레이어를 숨길 수 있습니다. 체크박스에 표시가 없다면, 레이어를 숨긴 것입니다.
21.3.2. 심볼 구조
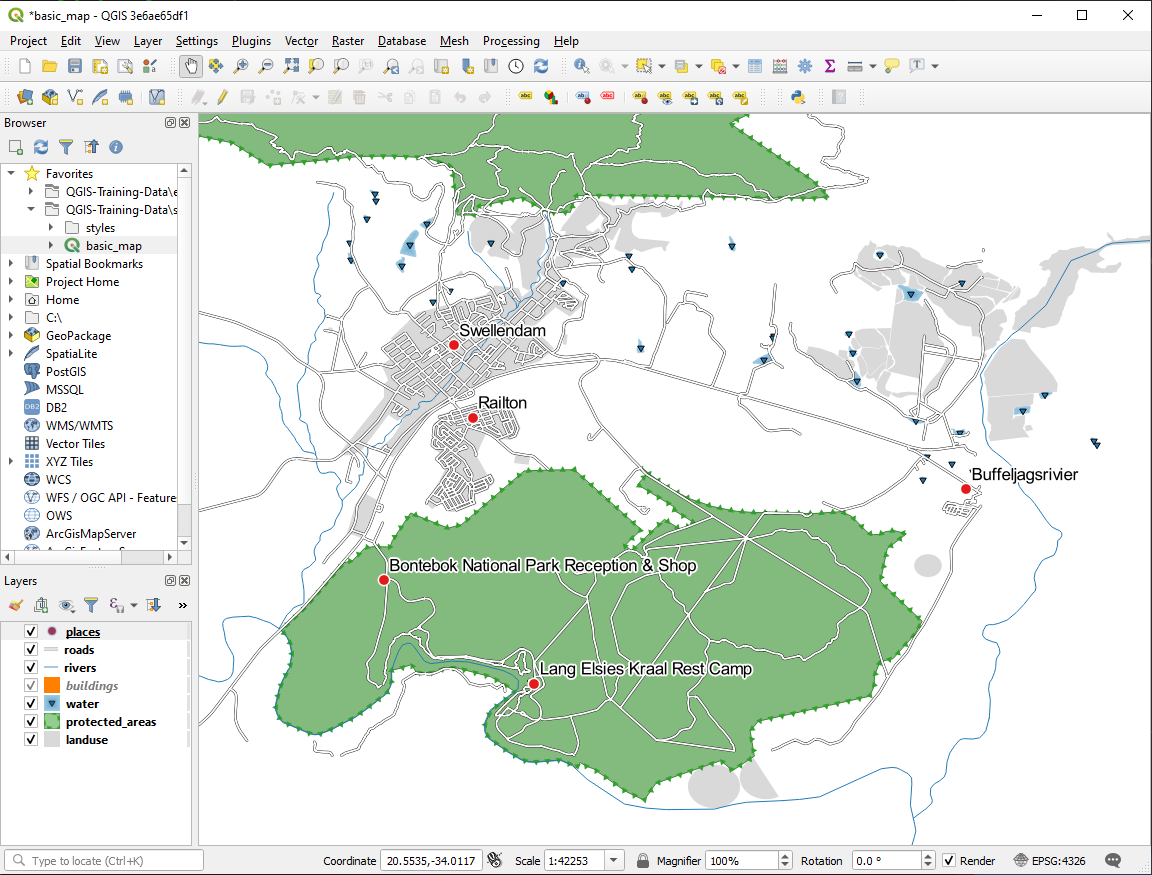
이제 사용자 맵이 이렇게 보여야 합니다.
초급 수준 사용자일 경우, 이 단계에서 멈춰도 됩니다.
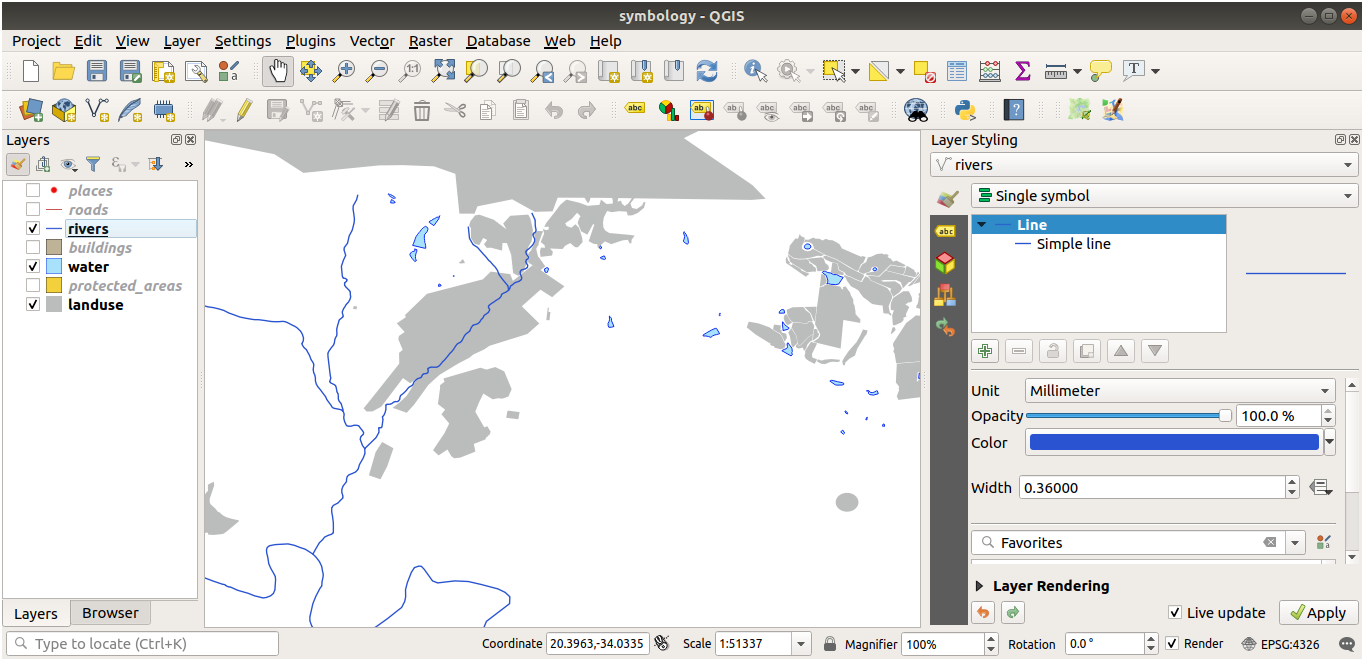
앞에서 언급한 방법을 이용해서 나머지 모든 레이어들의 색상 및 스타일을 변경하십시오.
오브젝트의 자연스러운 색상을 이용해보십시오. 예를 들어 도로는 빨강이나 파랑이 아니라 회색이나 검정이어야 합니다.
폴리곤에 대해 서로 다른 Fill style 및 Stroke style 설정도 마음대로 시험해보십시오.
21.3.3.  심볼 레이어
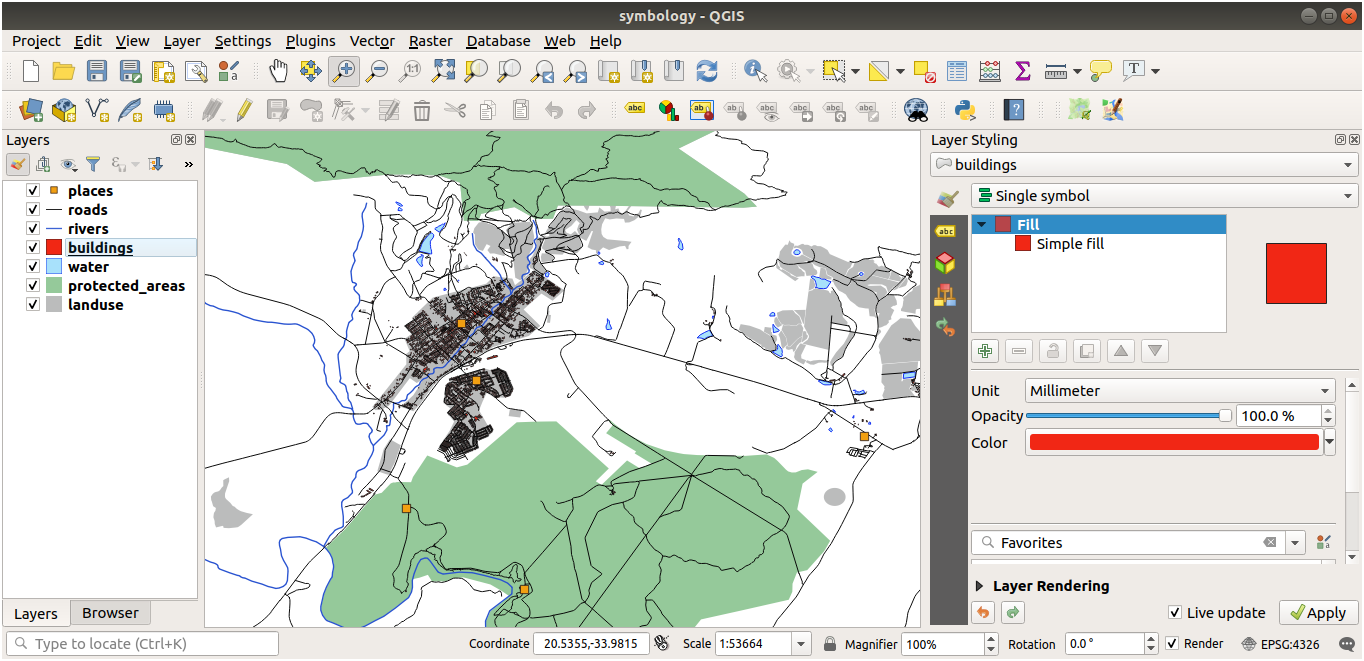
사용자가 원하는 대로 buildings 레이어를 사용자 지정하십시오. 그러나 맵 상에서 서로 다른 레이어를 쉽게 구별할 수 있어야 한다는 사실을 기억하십시오.
다음은 그 예시입니다.
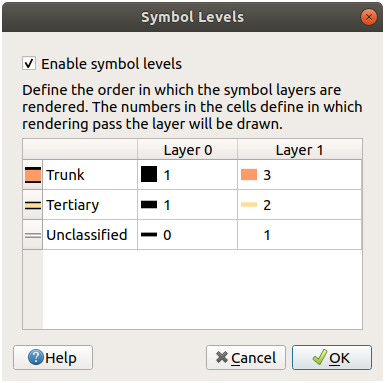
21.3.4. 심볼 수준
필요한 심볼을 만들려면, 다음 심볼 레이어 3개가 필요합니다:
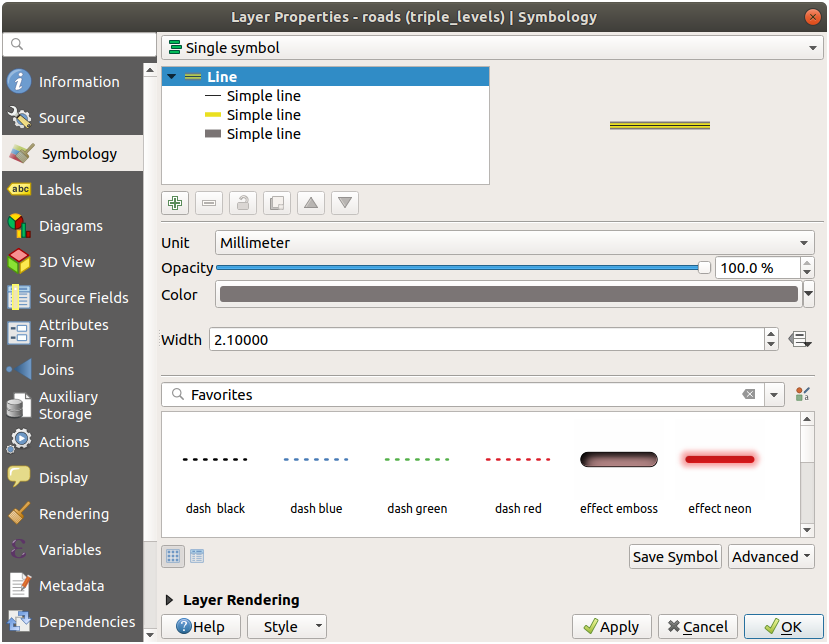
가장 낮은 심볼은 넓고 꽉 찬 회색 라인입니다. 그 위에 살짝 좁은 꽉 찬 노란색 라인이 있고, 마지막으로 가장 위에 더 좁은 꽉 찬 검은색 라인이 있습니다.
사용자의 심볼 레이어가 앞의 그림과 비슷하지만 원하는 결과가 나오지 않을 경우:
사용자 심볼이 다음과 같이 보이는지 확인하십시오:
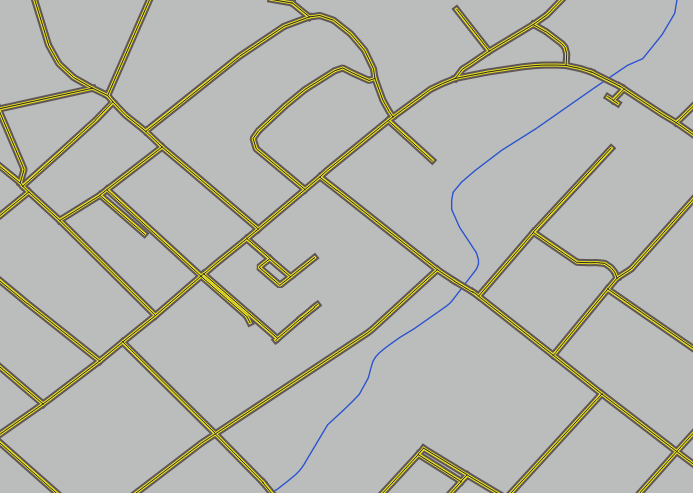
이제 사용자 맵이 이렇게 보여야 합니다.
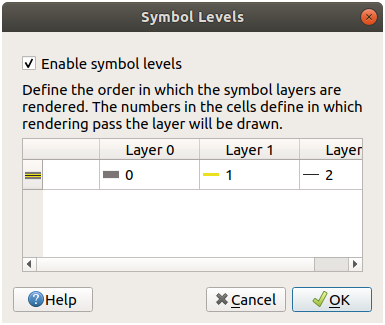
21.3.5.  심볼 수준
심볼 수준
사용자의 심볼 수준을 다음 값으로 조정하십시오.
다른 결과를 얻으려면 다른 값들을 시험해보십시오.
다음 예제를 해보기 전에 다시 원래 맵을 여십시오.
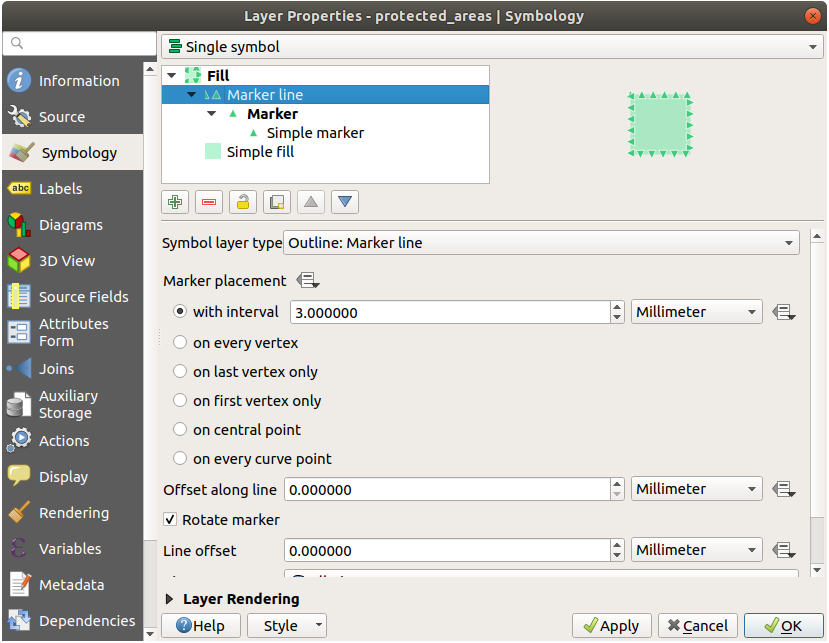
21.4. 외곽선 마커
다음은 심볼 구조의 예시입니다:
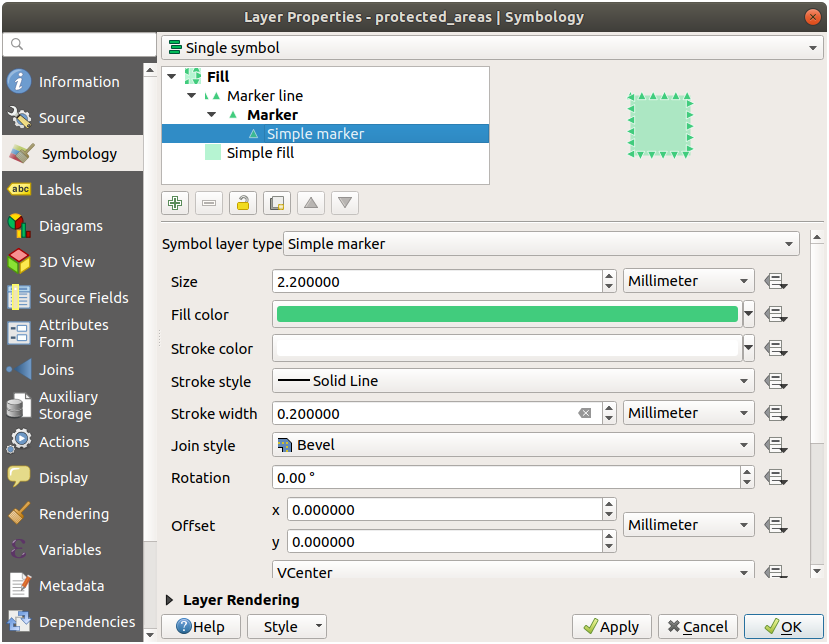
21.4.1. 도형 생성기 심볼
Click on the
 button to add another Symbol level.
Move the new symbol at the bottom of the list clicking the
 button.
Choose a good color to fill the water polygons.
Click on Marker of the Geometry generator symbology and change the circle with another shape as your wish.
Try experimenting other options to get more useful results.
21.5. Results For Vector Attribute Data
21.5.1. Exploring Vector Data Attributes
There should be 9 fields in the rivers layer:
Select the layer in the Layers panel.
Right-click and choose Open Attribute Table, or press the
 button on the Attributes Toolbar.
Count the number of columns.
팁
A quicker approach could be to double-click the rivers layer, open the tab, where you will find a numbered list of the table’s fields.
Information about towns is available in the places layer. Open its attribute table as you did with the rivers layer: there are two features whose place attribute is set to
town: Swellendam and Buffeljagsrivier. You can add comment on other fields from these two records, if you like.The
namefield is the most useful to show as labels. This is because all its values are unique for every object and are very unlikely to contain NULL values. If your data contains some NULL values, do not worry as long as most of your places have names.
21.6. Results For Labels
21.6.1. 사용자 지정 라벨 (Part 1)
Your map should now show the marker points and the labels should be offset by 2mm. The style of the markers and labels should allow both to be clearly visible on the map:
21.6.2. 사용자 지정 라벨 (Part 2)
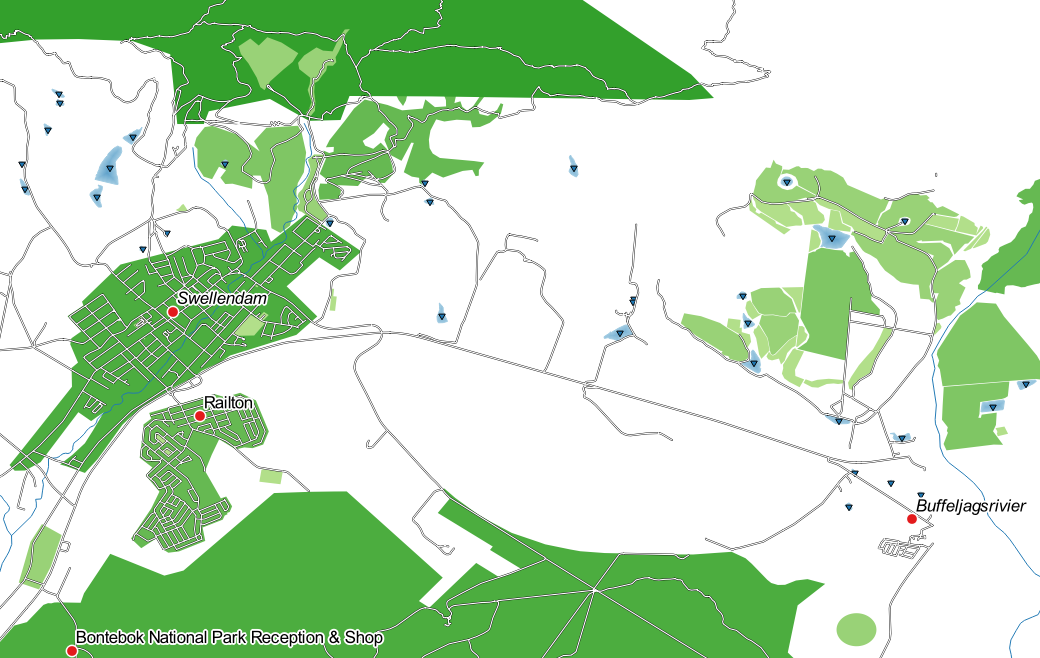
다음 최종 산출물을 생산하는 해법이 있습니다.
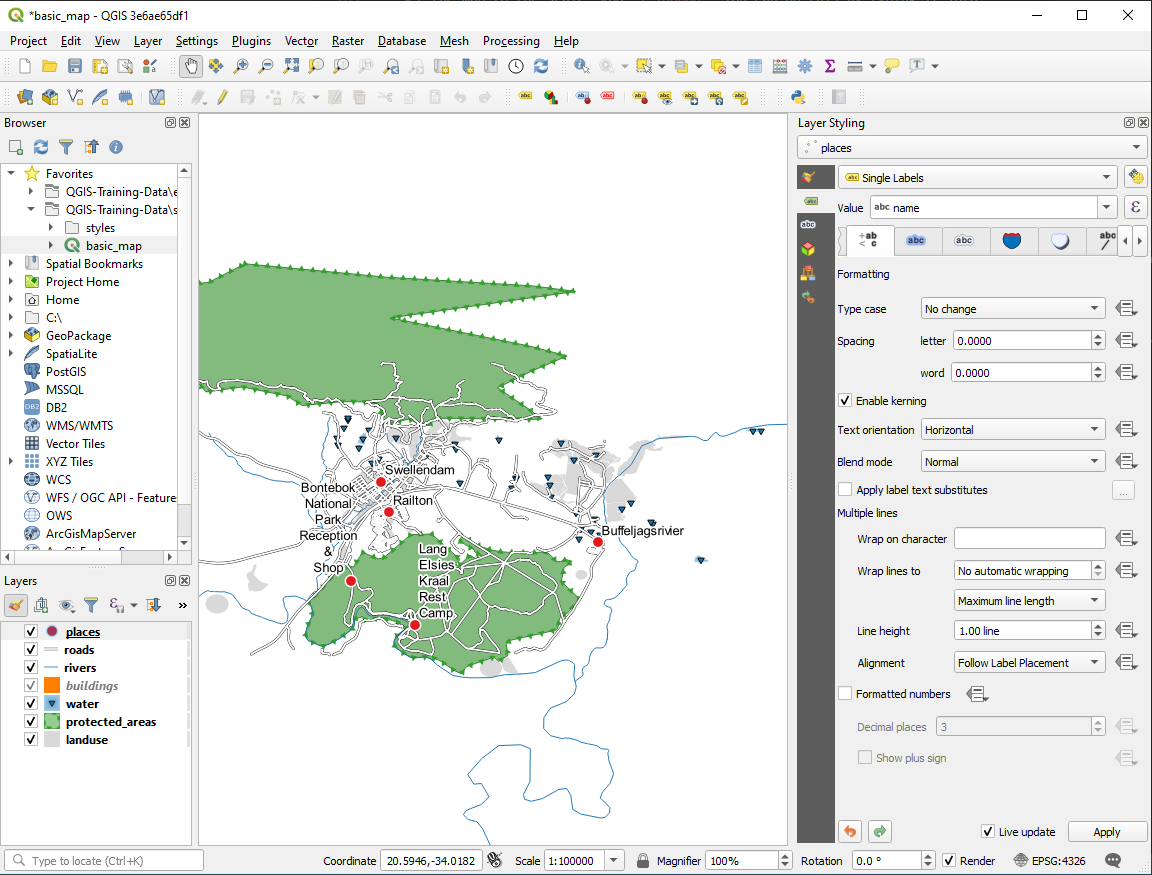
이 결과물을 산출하려면,
Use a font size of
10Use an around point placement distance of
1.5 mmUse a marker size of
3.0 mmIn addition, this example uses the Wrap on character option:
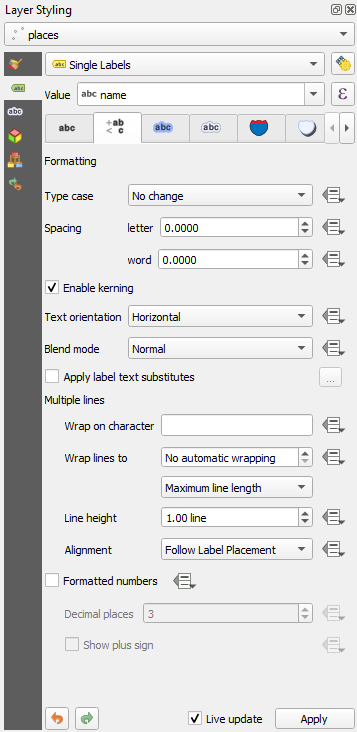
Enter a
spacein this field and click Apply to achieve the same effect. In our case, some of the place names are very long, resulting in names with multiple lines which is not very user friendly. You might find this setting to be more appropriate for your map.
21.6.3. 데이터 정의 설정 사용
Still in edit mode, set the
FONT_SIZEvalues to whatever you prefer. The example uses16for towns,14for suburbs,12for localities, and10for hamlets.Remember to save changes and exit edit mode
Return to the Text formatting options for the
placeslayer and selectFONT_SIZEin the Attribute field of the font size data defined override dropdown:
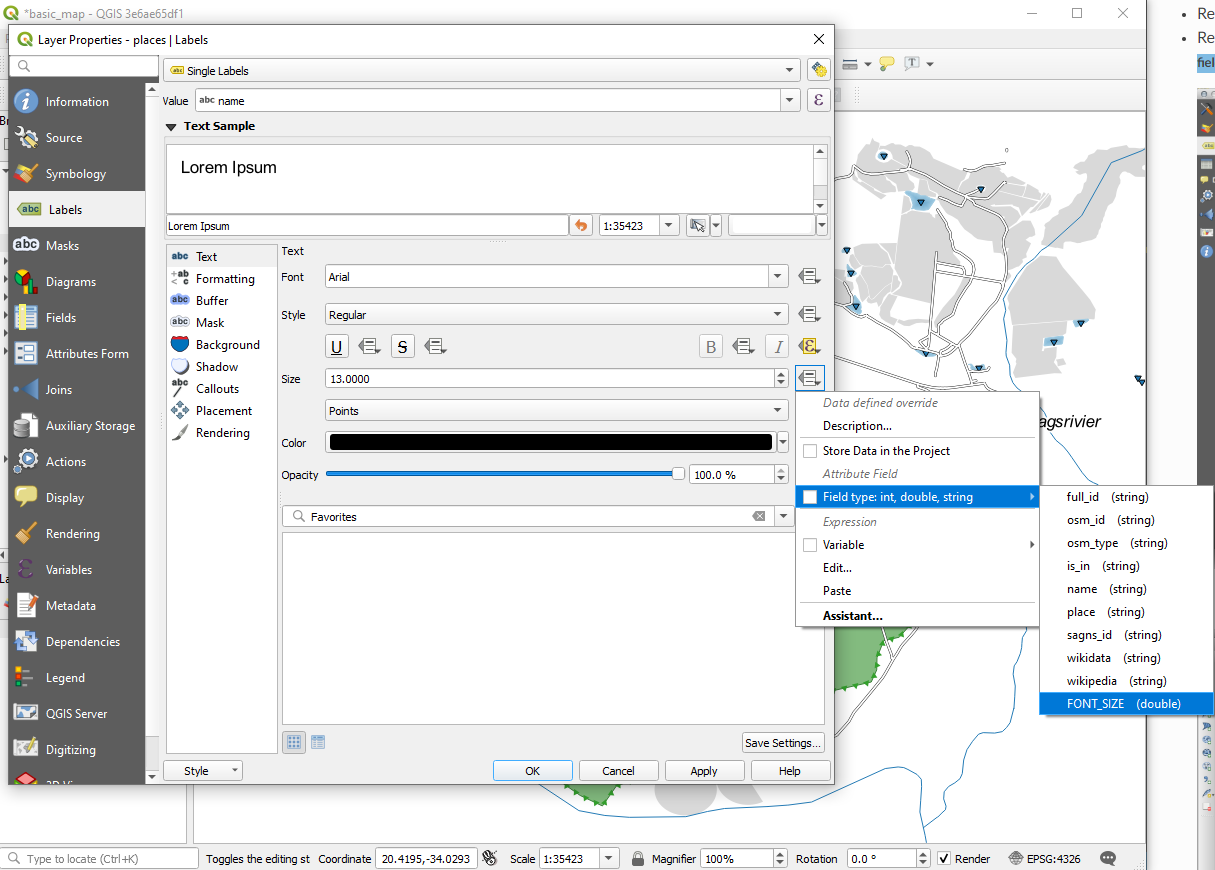
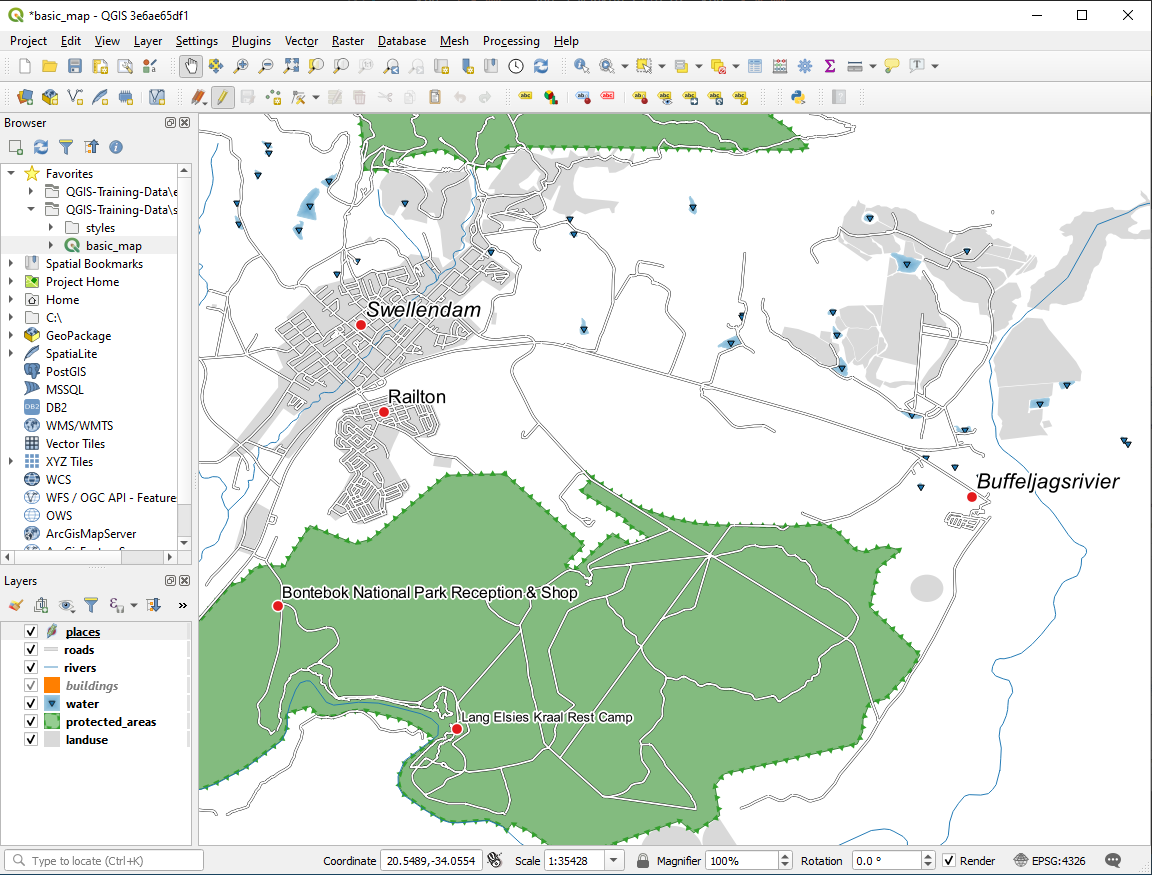
앞에서 설정한 값을 사용할 경우, 결과물이 다음과 같아야 합니다.
21.7. Results For 범주화
21.7.1. 범주화 개선
The settings you used might not be the same, but with the values
Classes = 6 and Mode = Natural Breaks
(Jenks) (and using the same colors, of course), the map will look like this:
21.8. Results For 새 벡터 데이터셋 생성
21.8.1. 디지타이징
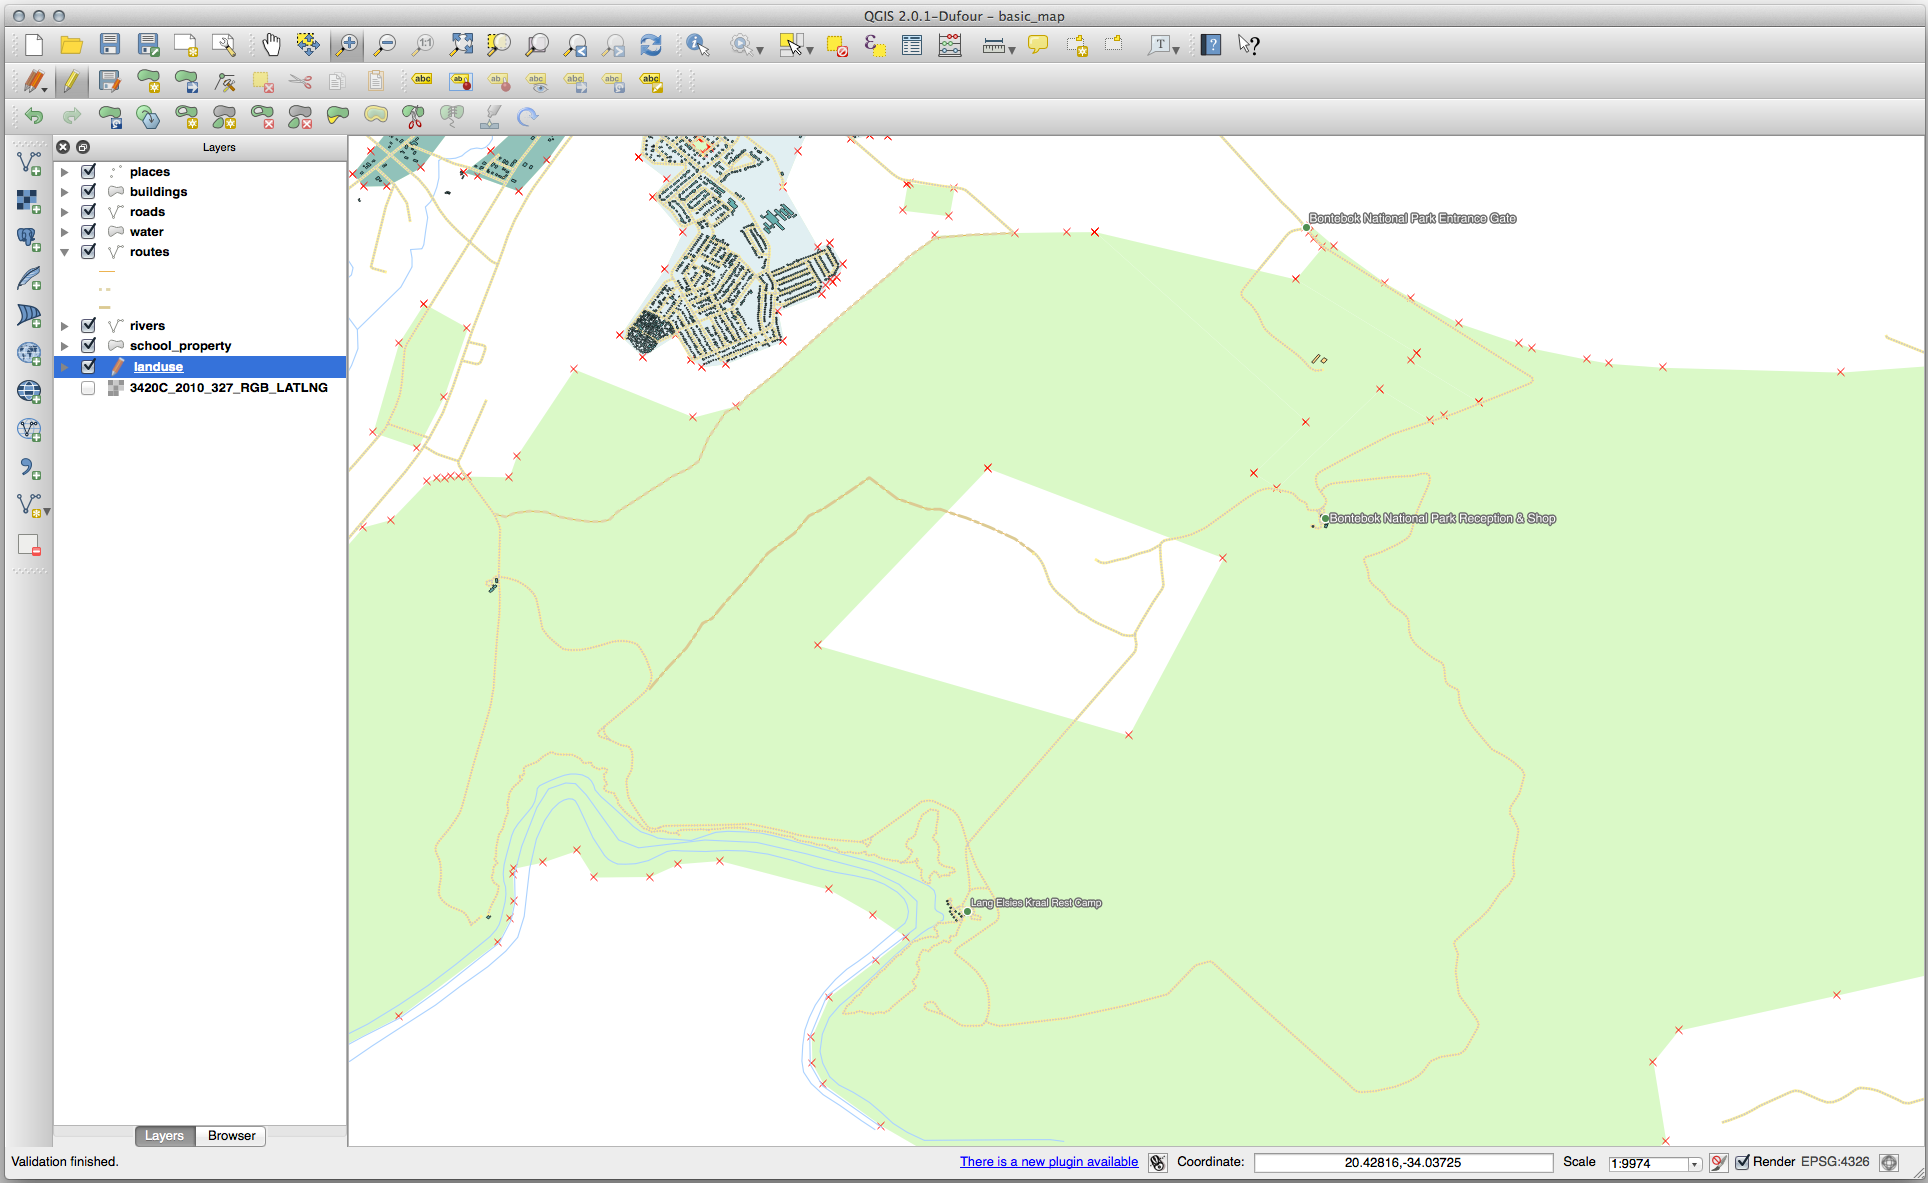
심볼과 상관 없이, 결과물이 다음과 비슷하게 보여야 합니다.
21.8.2. 위상 : 고리 추가 도구
정확한 모양에 상관 없이, 사용자 피처 가운데에 다음과 같이 구멍이 생겨야 합니다.
다음 도구에 대한 예제를 해보기 전에 편집 내용을 되돌리십시오.
21.8.3. 위상 : 부분 추가 도구
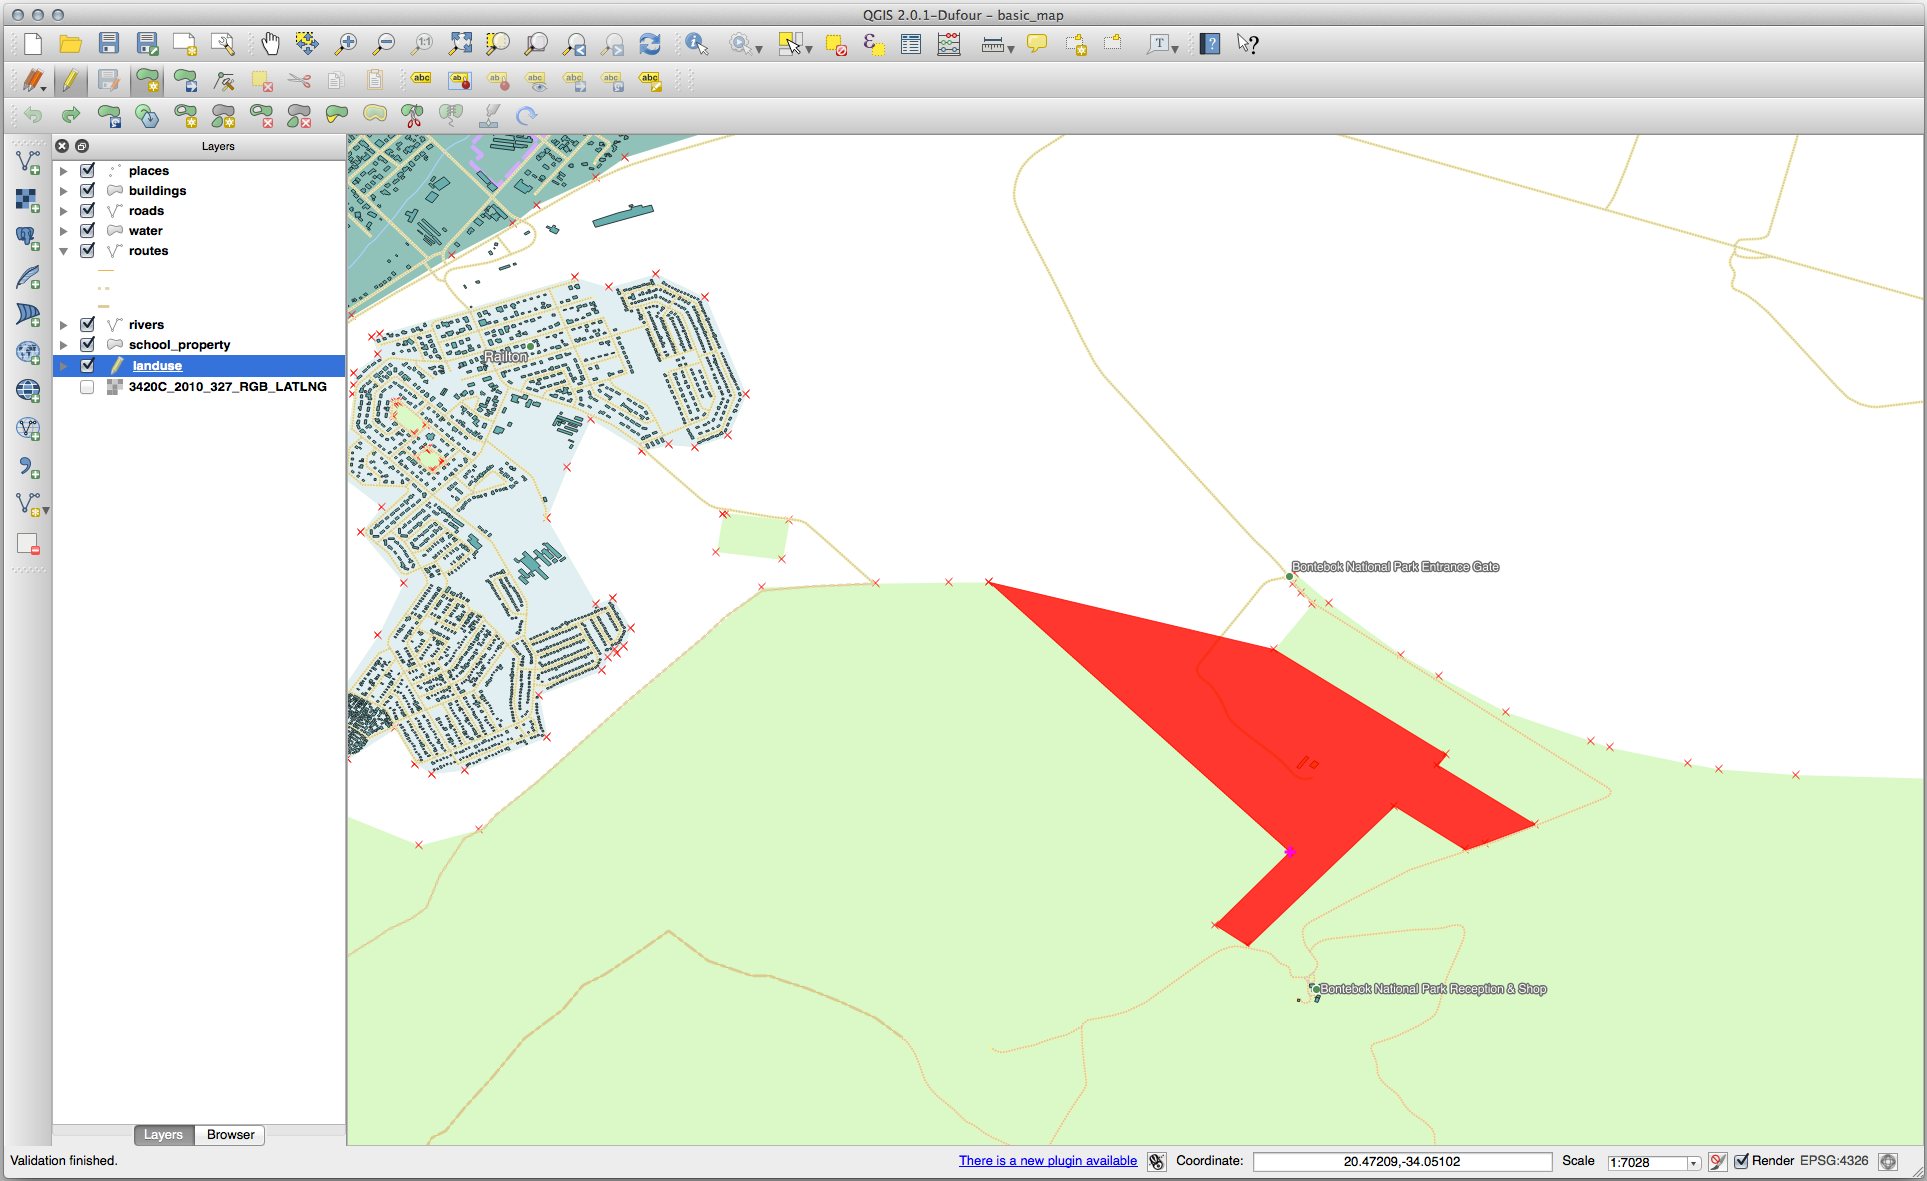
먼저 Bontebok National Park 를 선택하십시오.
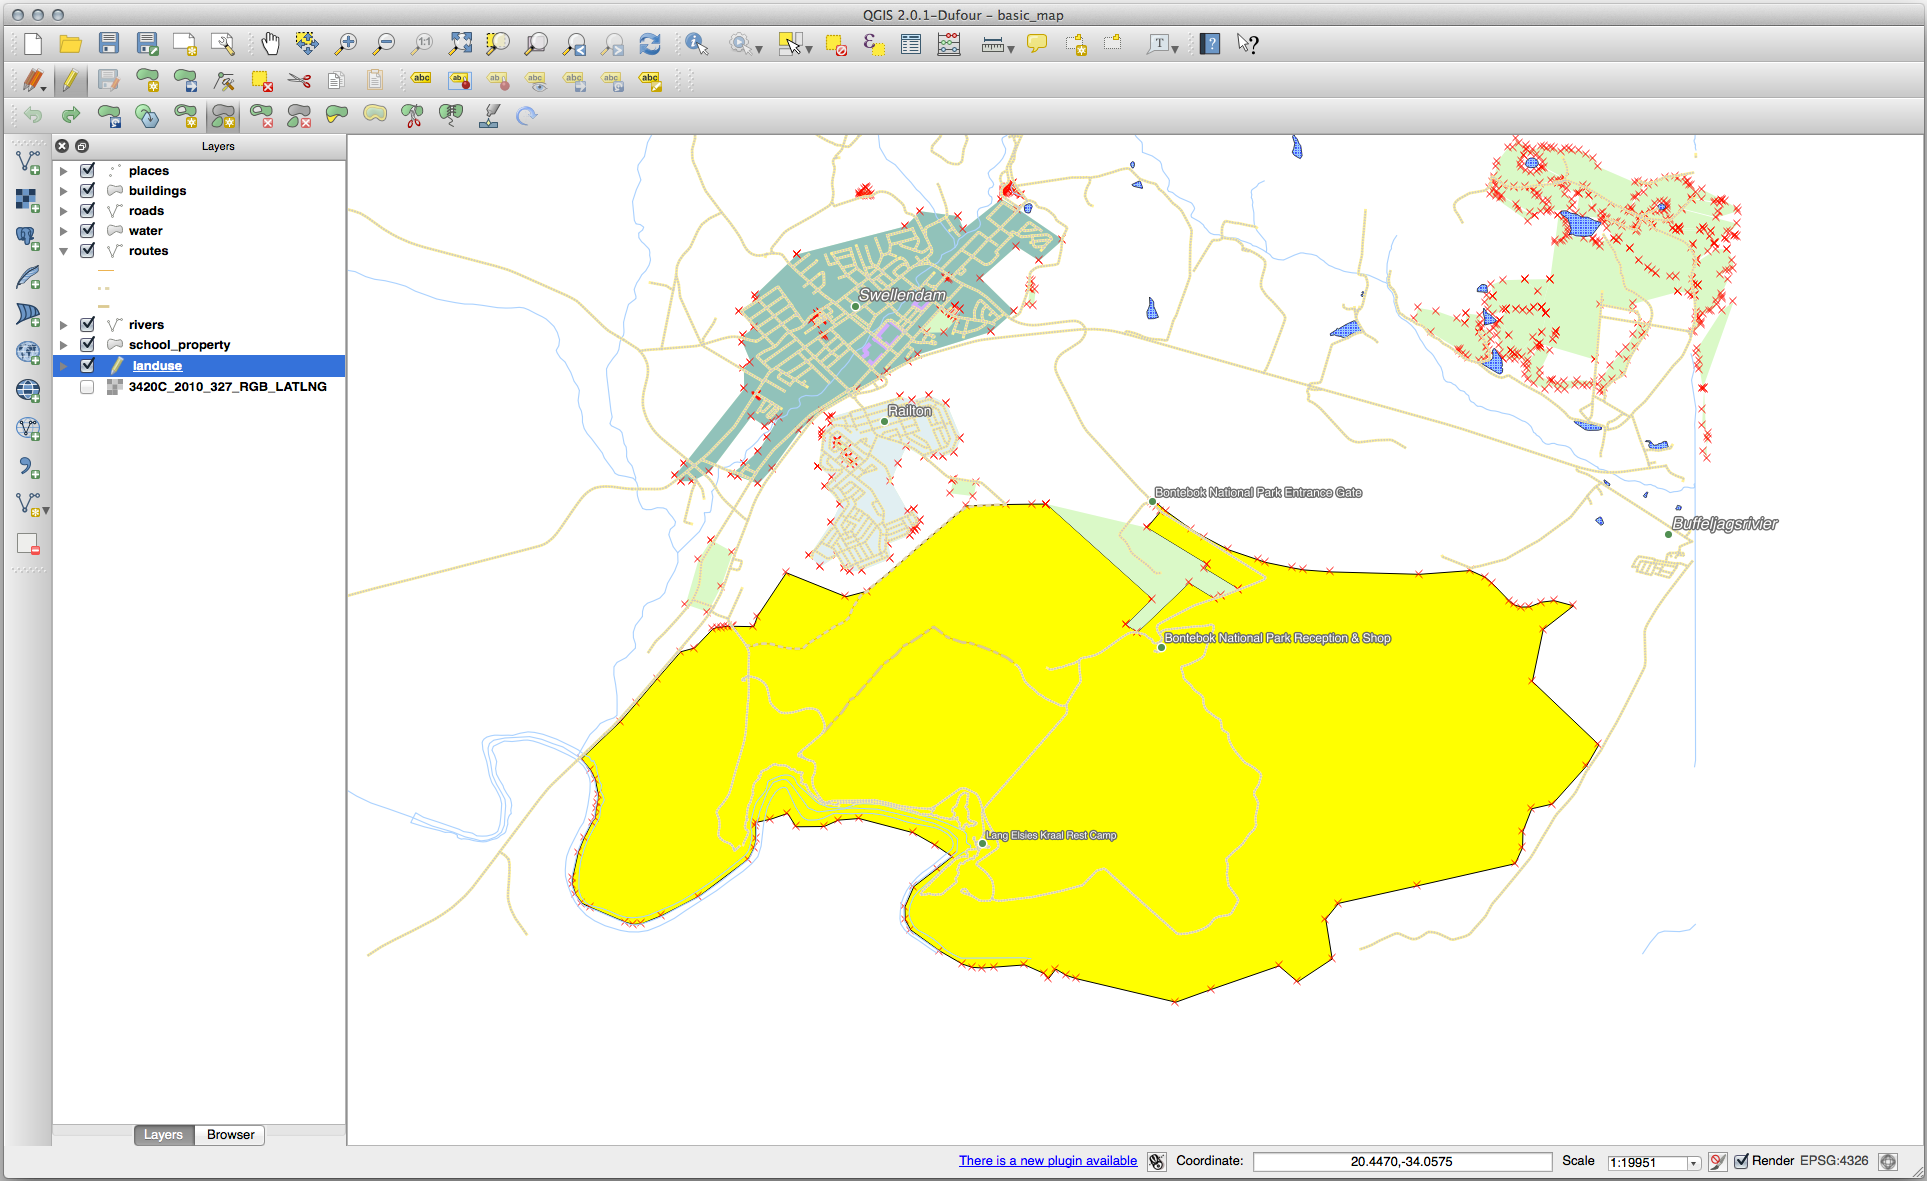
새 부분을 추가하십시오.
다음 도구에 대한 예제를 해보기 전에 편집 내용을 되돌리십시오.
21.8.4. 피처 합치기
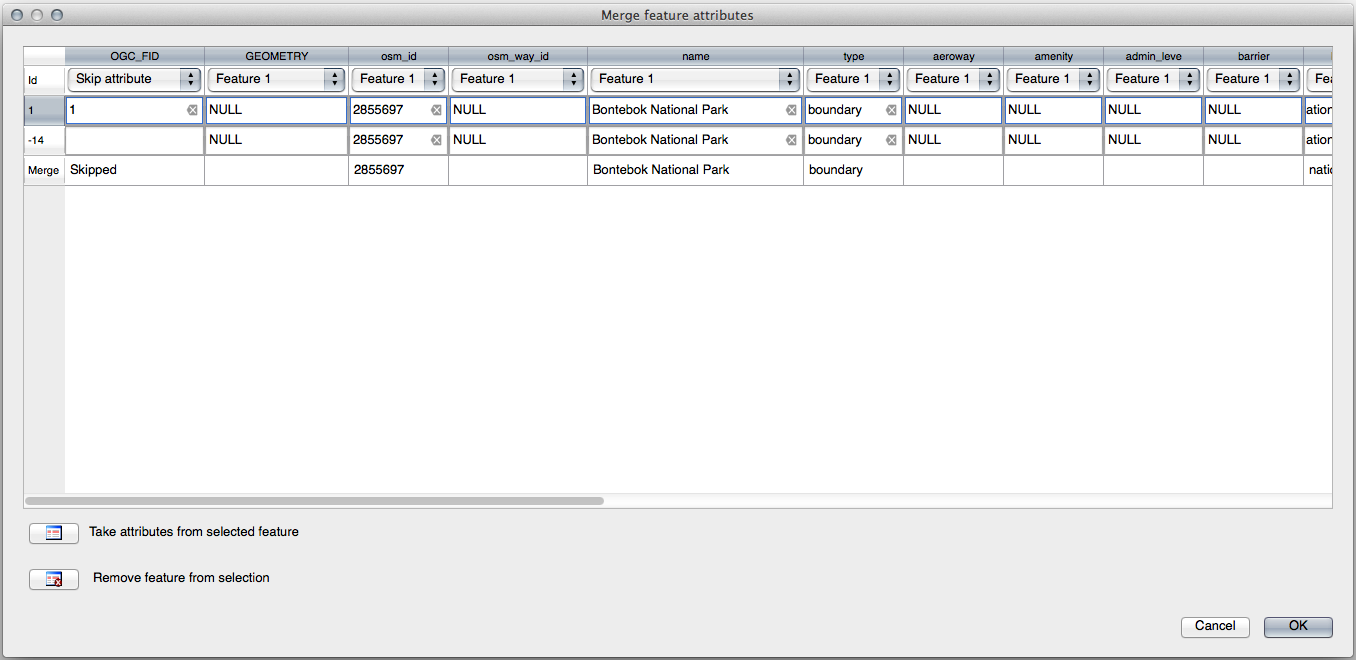
Merge Selected Features 도구를 이용, 먼저 사용자가 합치고자 하는 폴리곤을 둘 다 선택하도록 하십시오.
사용자 속성의 소스로 OGC_FID 를 1 로 설정해서 피처를 사용하십시오. (대화 창에서 해당 항목을 클릭한 다음, Take attributes from selected feature 버튼을 클릭하십시오.)
참고
If you’re using a different dataset, it is highly likely that your
original polygon’s OGC_FID will not be 1. Just choose the
feature which has an OGC_FID.
참고
Merge Attributes of Selected Features 도구를 사용하면 계속 도형들을 구분할 수 있지만, 동일한 속성을 부여할 것입니다.
21.8.5. 서식
TYPE 의 경우, 도로가 가질 수 있는 유형은 분명히 제한되어 있습니다. 이 레이어의 속성 테이블을 확인해보면, 이미 유형이 정의되어 있다는 사실을 알 수 있습니다.
위젯을 Value Map 으로 설정하고 Load Data from Layer 를 클릭하십시오.
Label 드롭다운 메뉴에서 roads 를 선택하고, Value 및 Description 에 대해 모두 highway 를 선택하십시오.
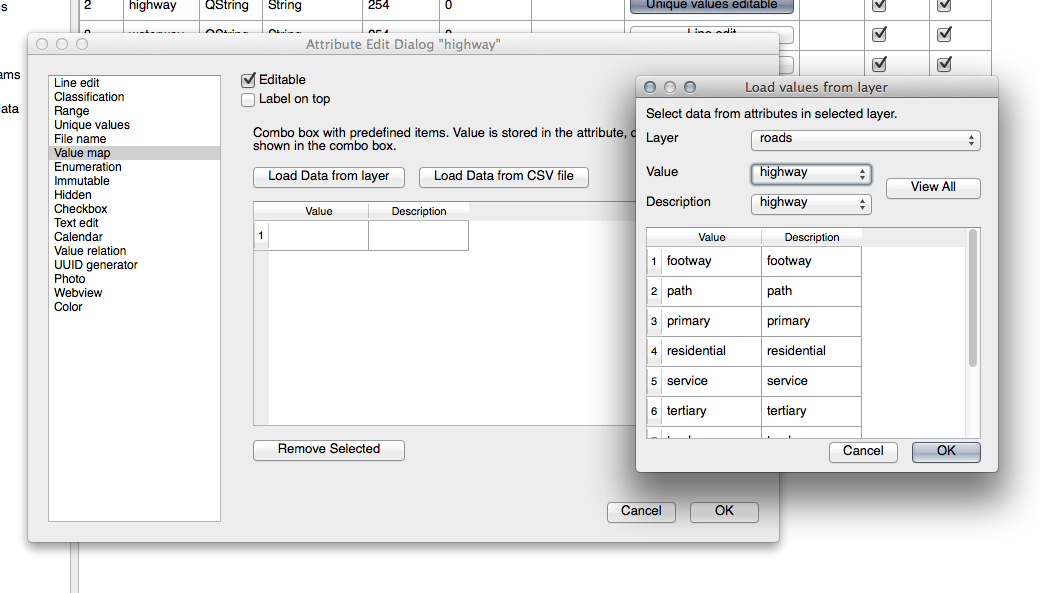
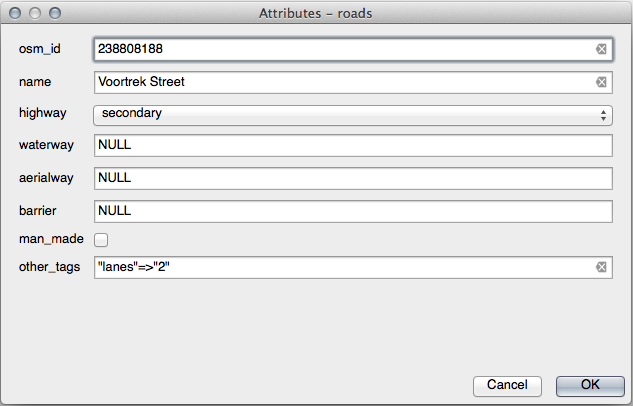
Click OK three times.
이제 편집 모드에 들어간 상태에서 도로에 대해 Identify 도구를 사용해보면, 다음과 같은 대화 창이 나타날 것입니다.
21.9. Results For 벡터 분석
21.9.1. 고등학교로부터의 거리
버퍼 대화 창이 다음과 같이 보여야 합니다.
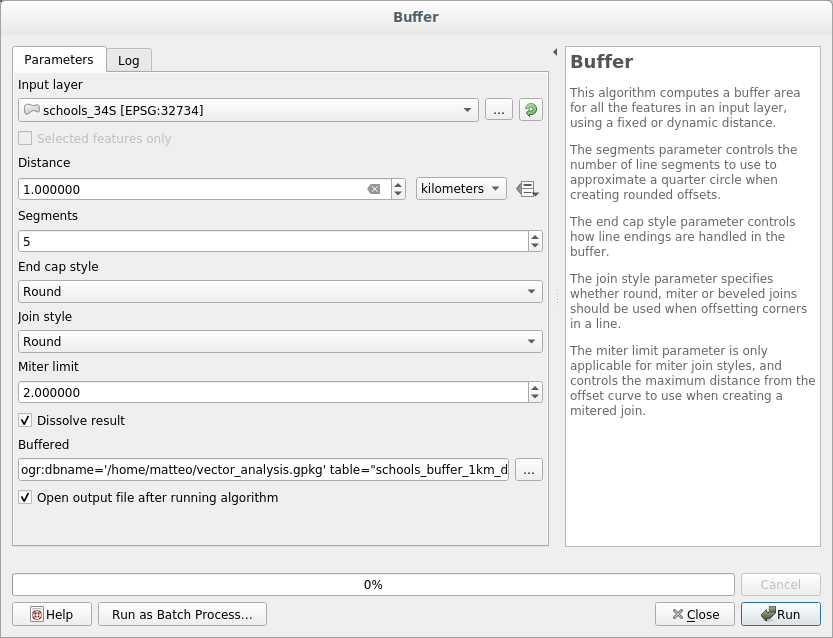
The Buffer distance is 1 kilometer.
The Segments to approximate value is set to 20. This is optional, but it’s recommended, because it makes the output buffers look smoother. Compare this:
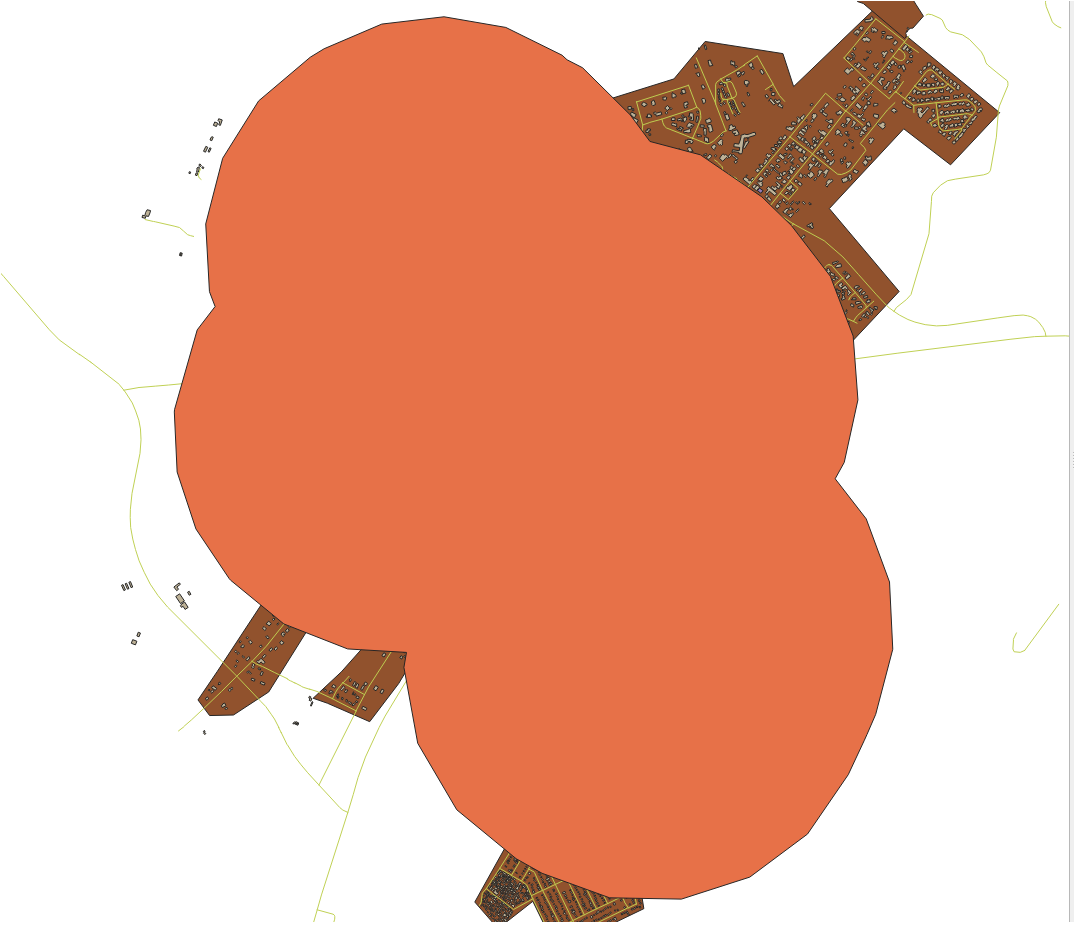
이 그림과 비교해 보십시오.
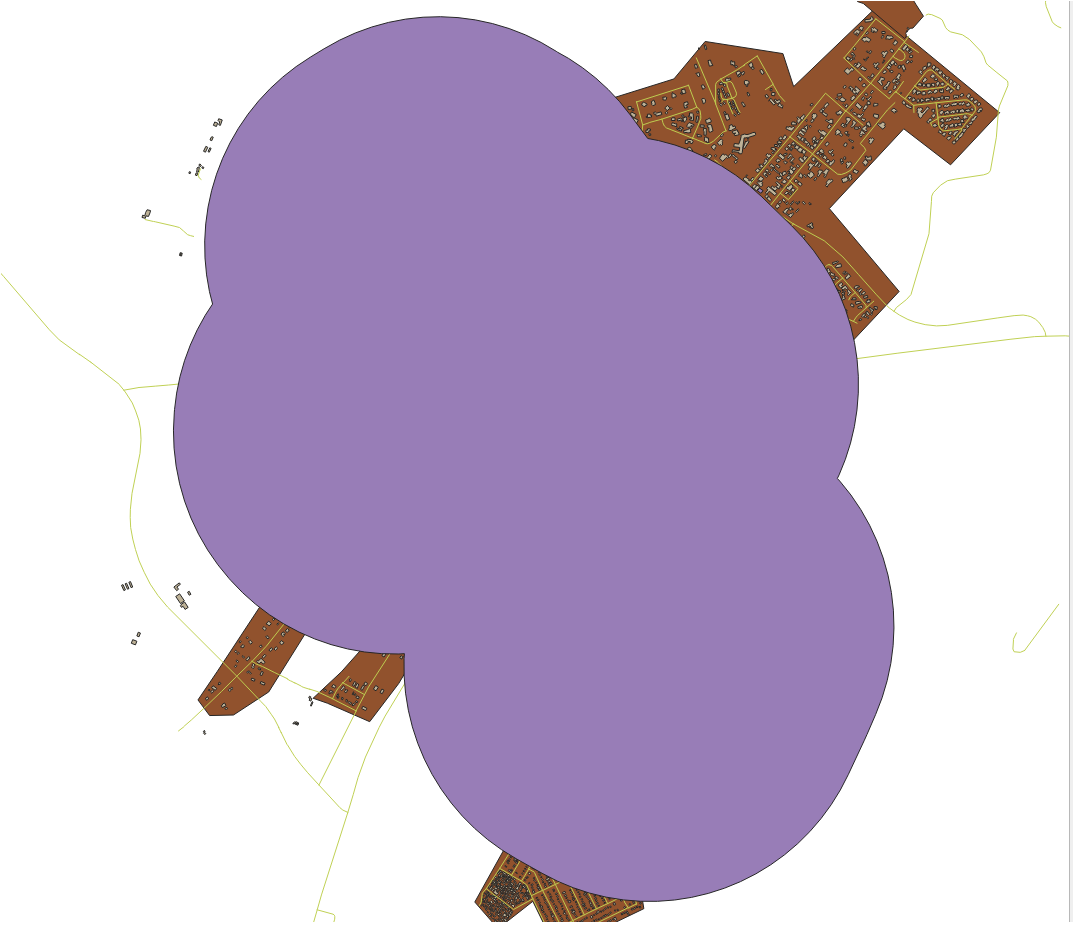
The first image shows the buffer with the Segments to approximate value set to 5 and the second shows the value set to 20. In our example, the difference is subtle, but you can see that the buffer’s edges are smoother with the higher value.
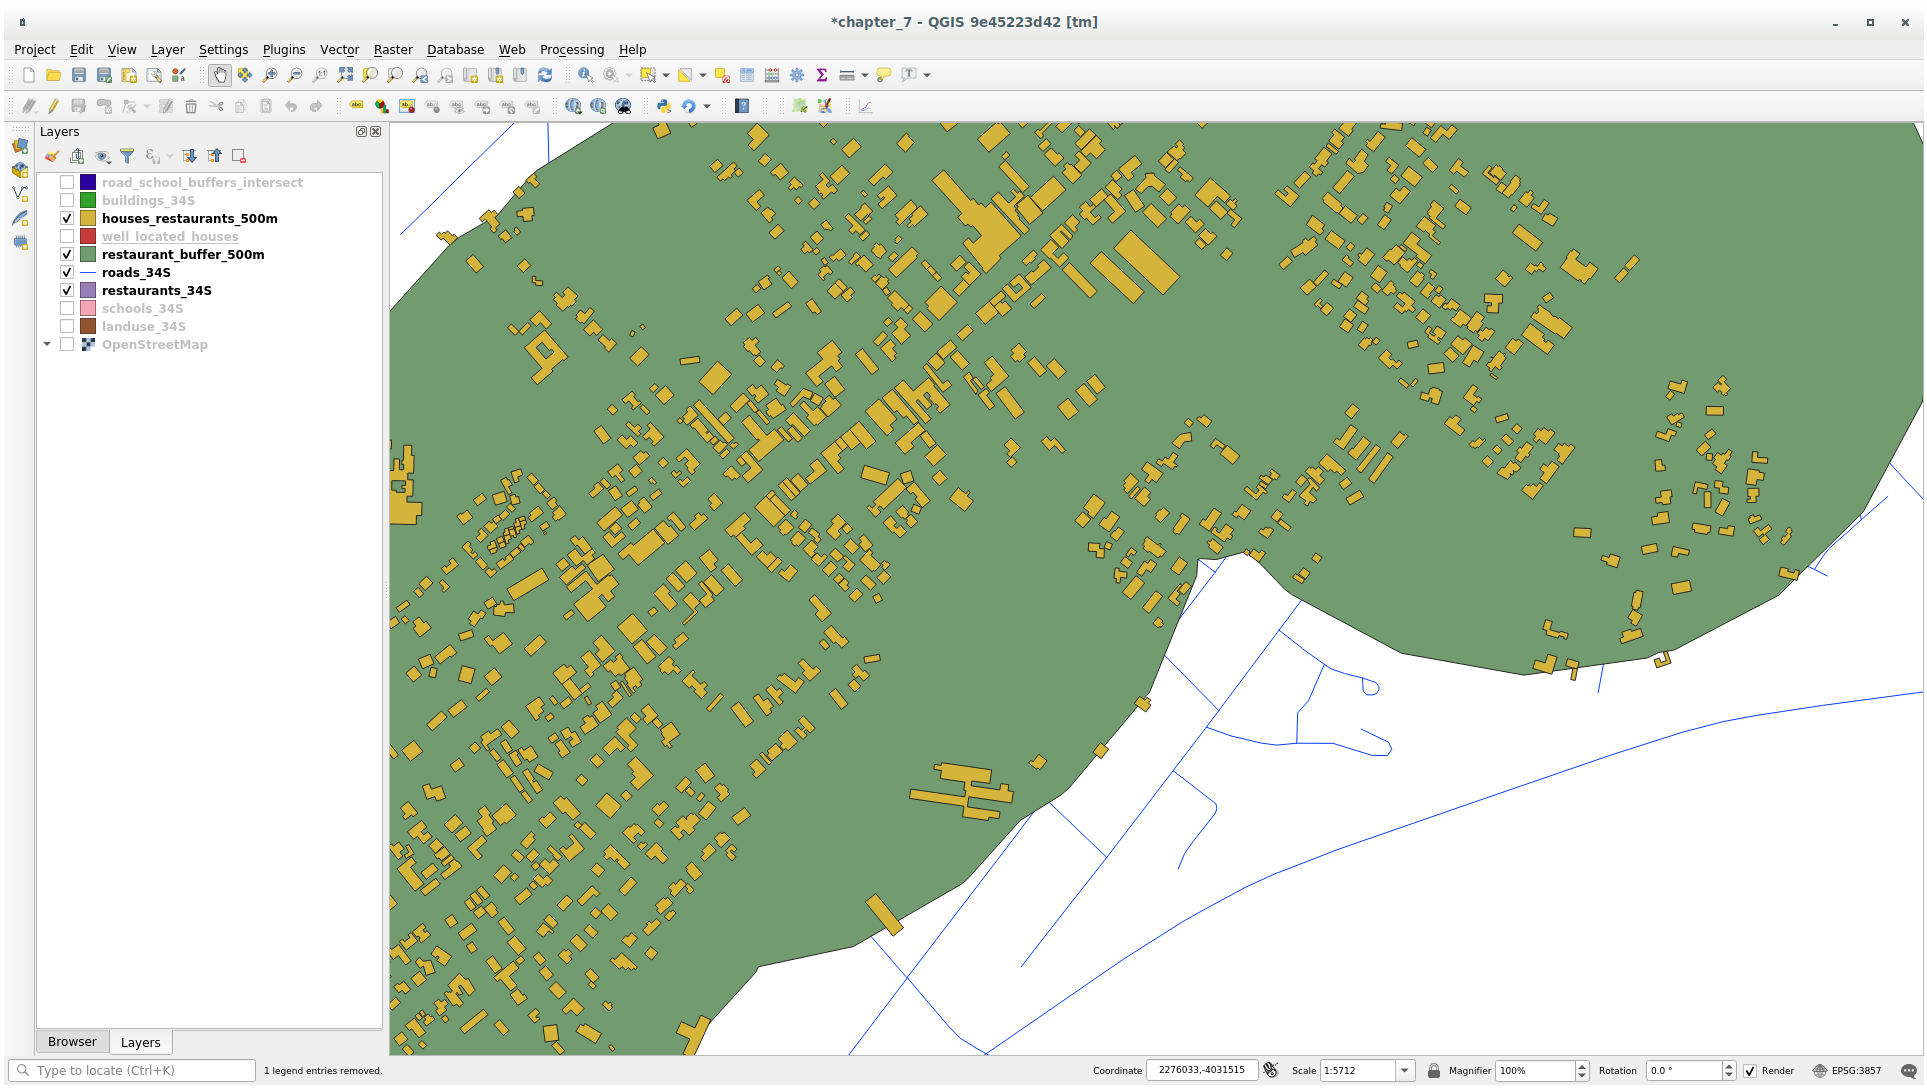
21.9.2. 식당으로부터의 거리
To create the new houses_restaurants_500m layer, we go through a two step process:
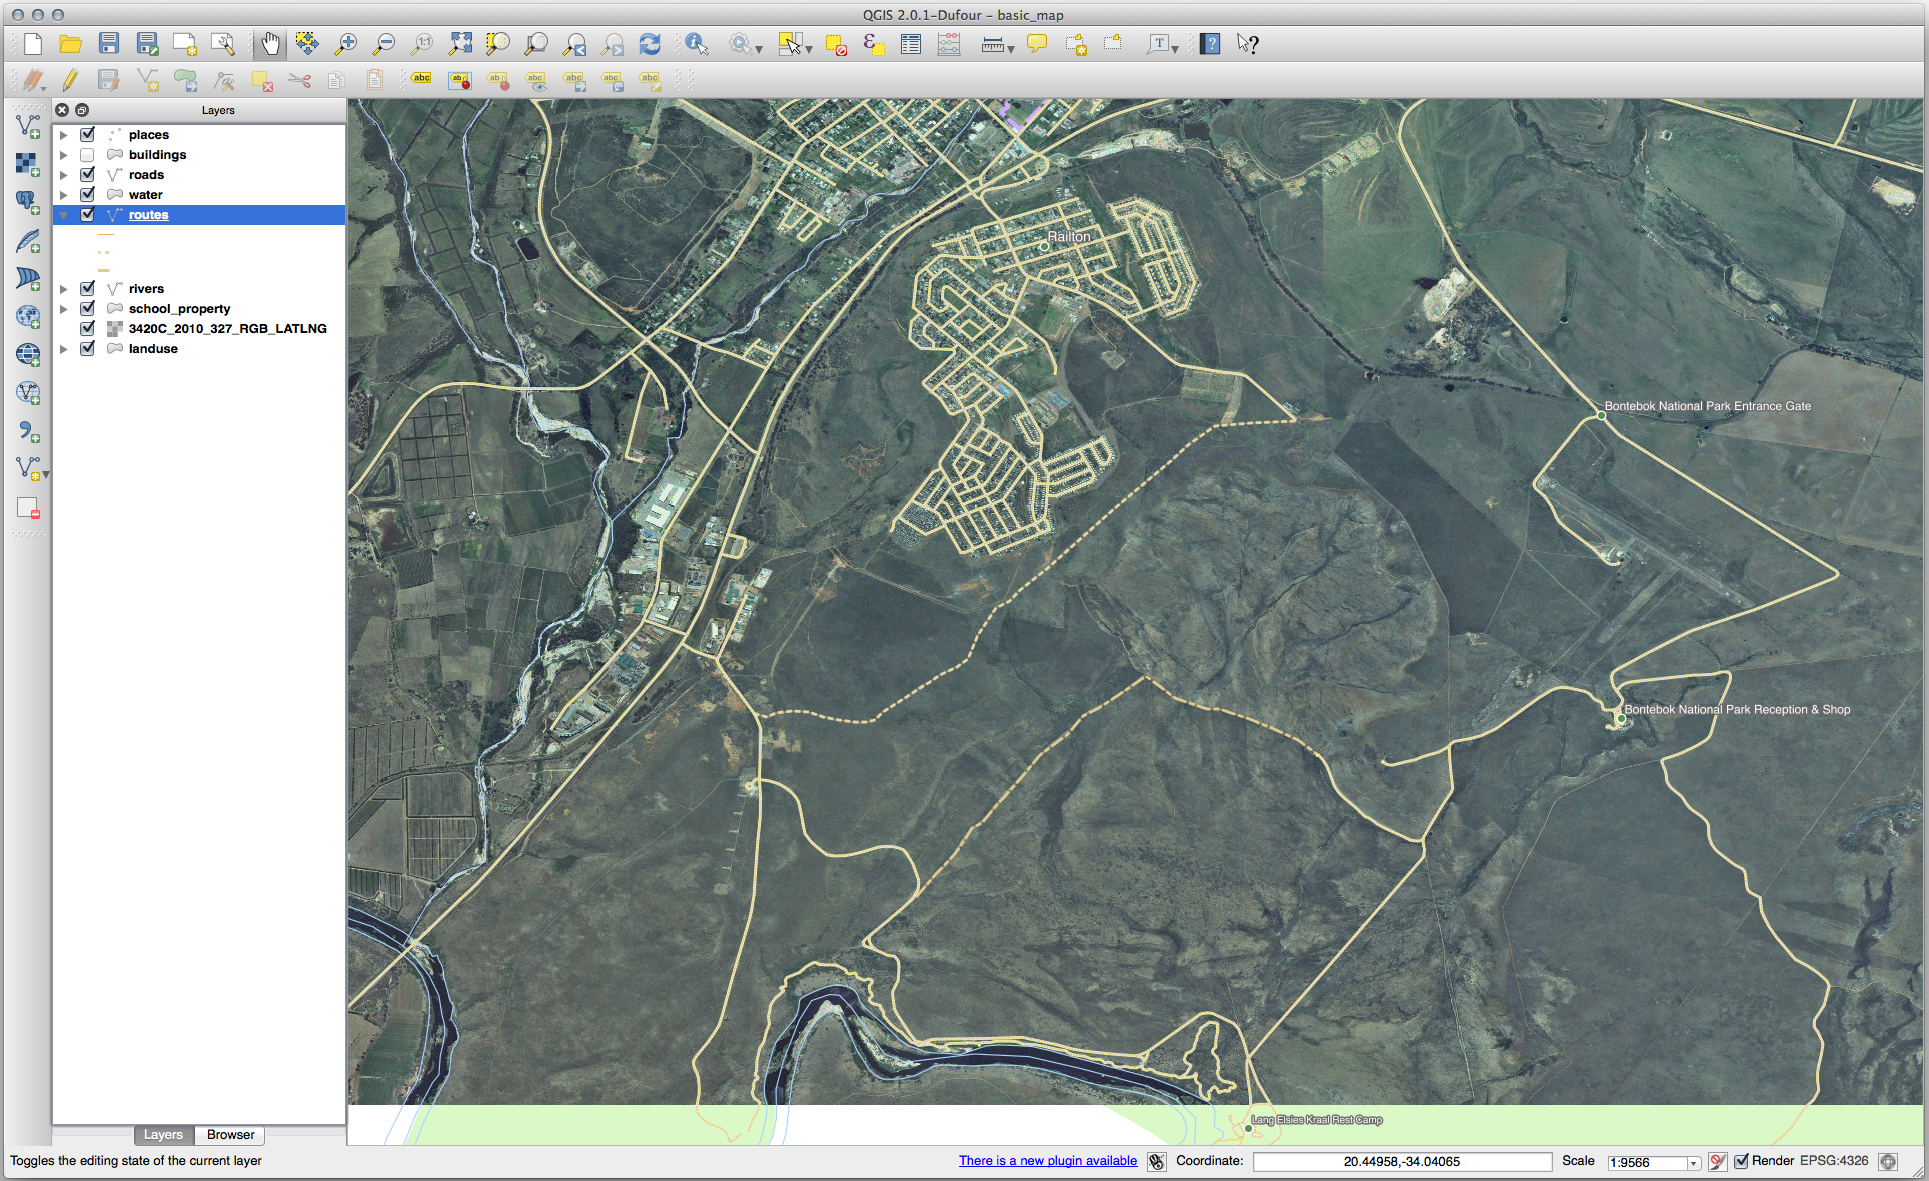
먼저, 다음과 같이 식당 주위에 500미터의 버퍼를 생성하고 레이어를 맵에 추가합니다.
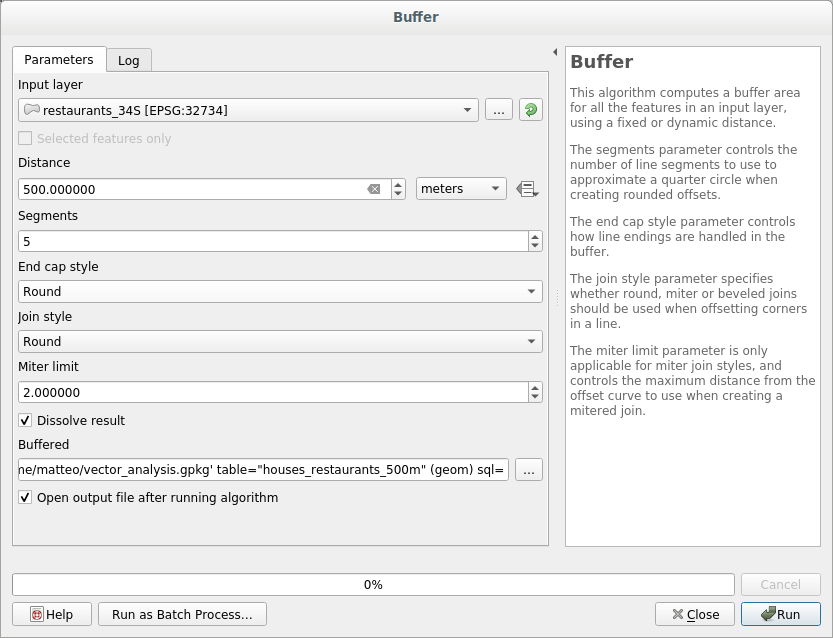
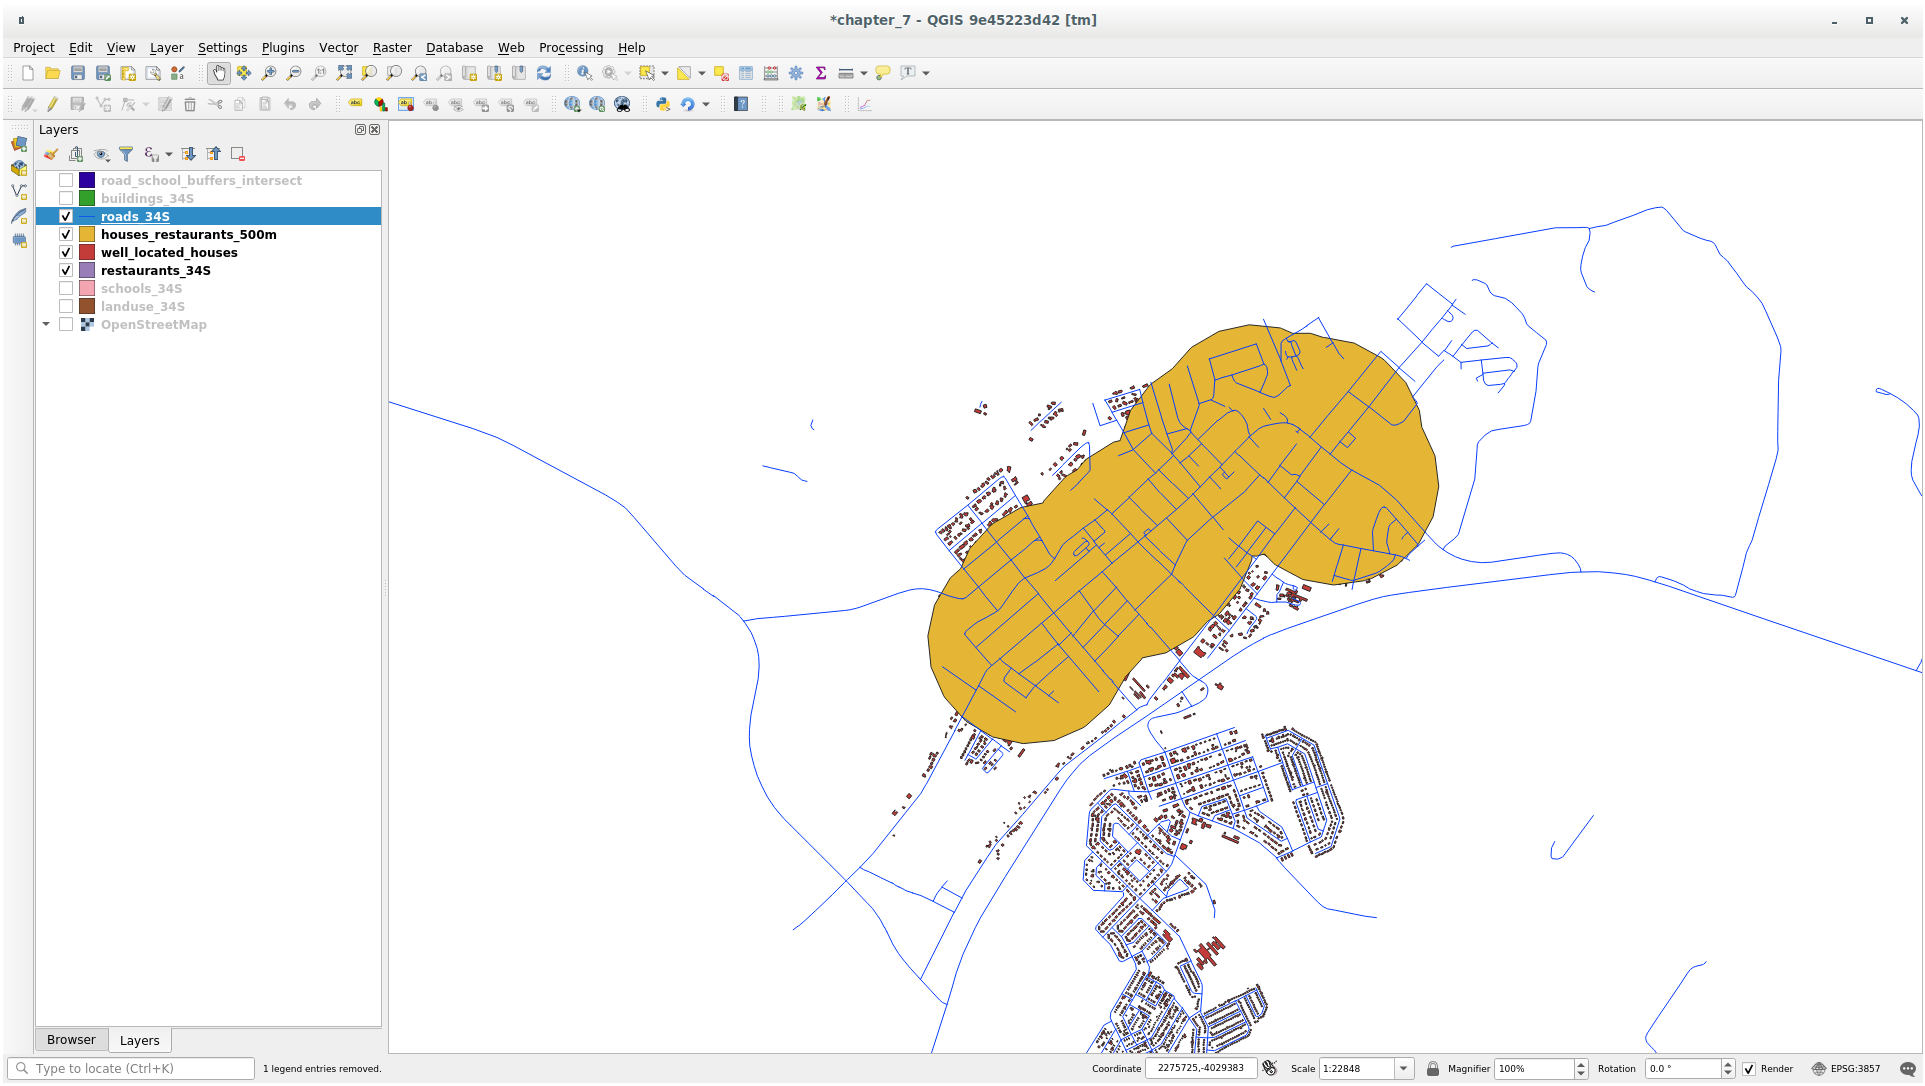
Next, extract buildings within that buffer area:
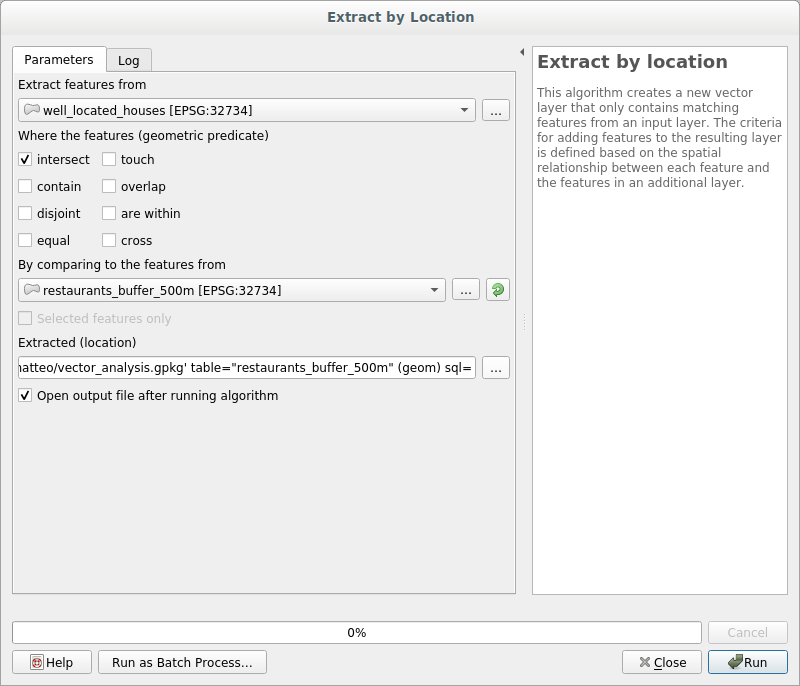
이제 사용자 맵에 도로에서 50미터, 학교에서 1킬로미터, 식당에서 500미터 이내에 있는 건물들만 나타날 것입니다.
21.10. Results For Network Analysis
21.11. Fastest path
Open and fill the dialog as:
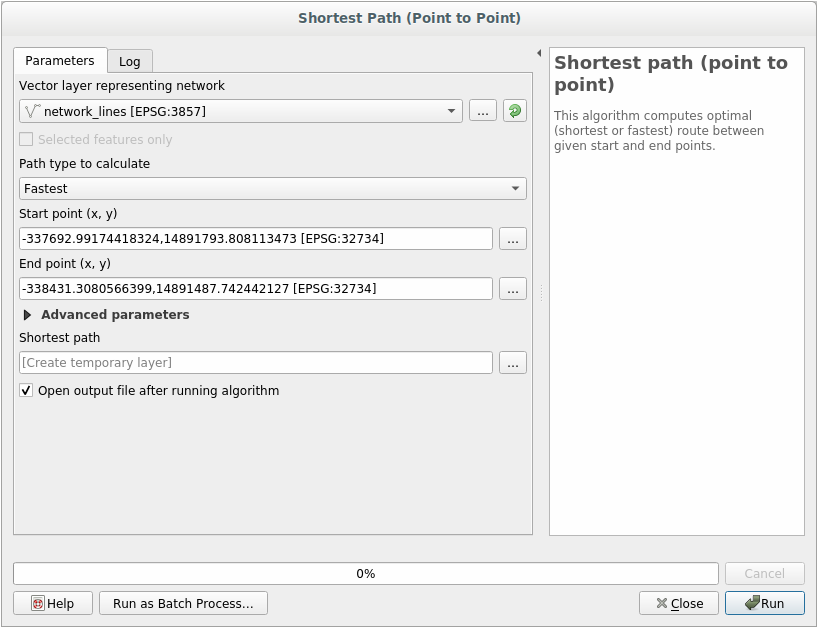
Make sure that the Path type to calculate is Fastest.
Click on Run and close the dialog.
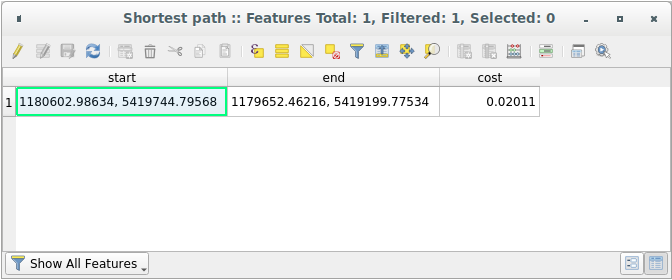
Open now the attribute table of the output layer. The cost field contains the travel time between the two points (as fraction of hours):
21.12. Results For 레스터 분석
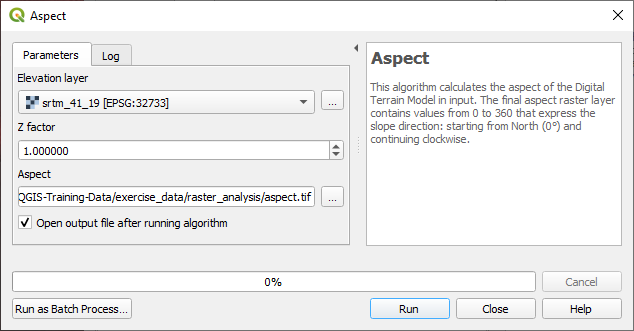
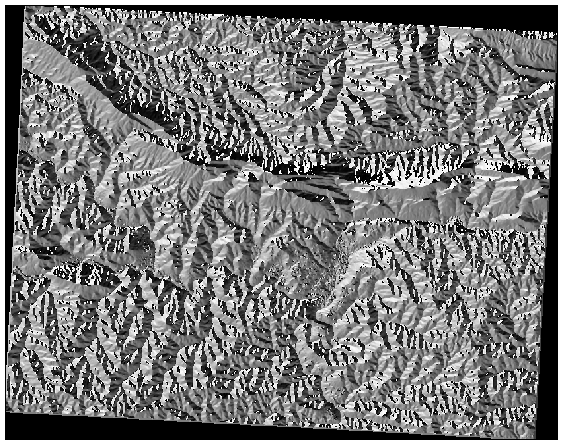
21.12.1. 향 계산
Set your Aspect dialog up like this:
결과 :
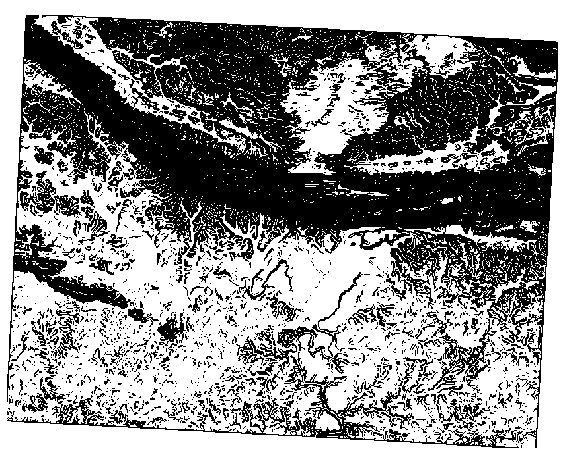
21.12.2. 경사도 계산 (2도, 5도 미만)
Set your Raster calculator dialog up with:
the following expression:
slope@1 <= 2the
slopelayer as the Reference layer(s)
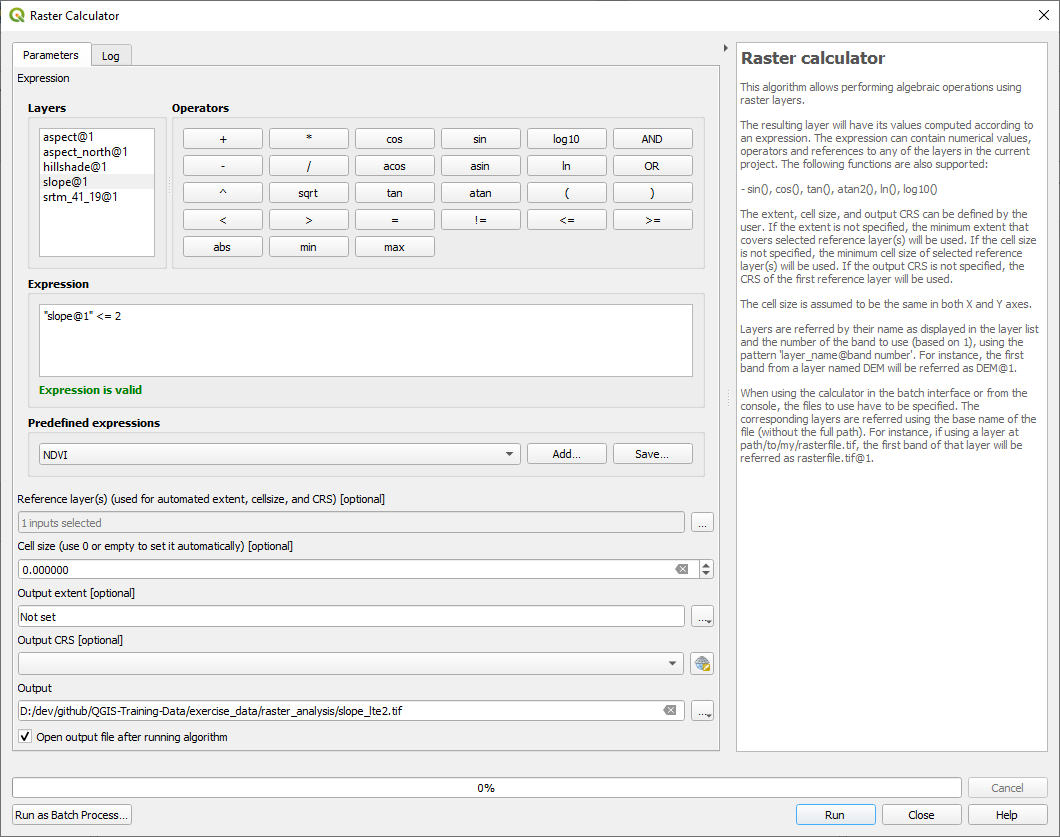
For the 5 degree version, replace the
2in the expression and file name with5.
결과 :
2도 :
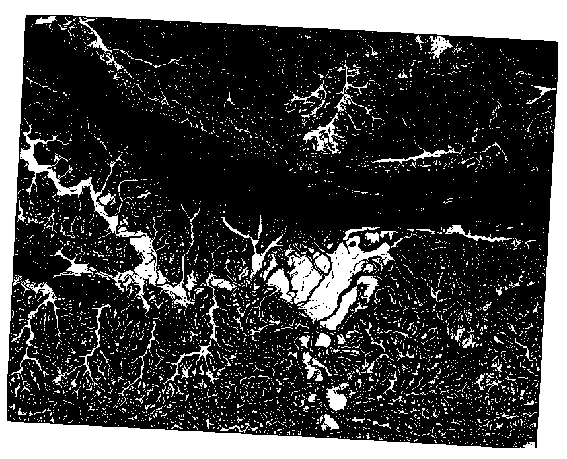
5도 :
21.13. Results For 분석의 완성
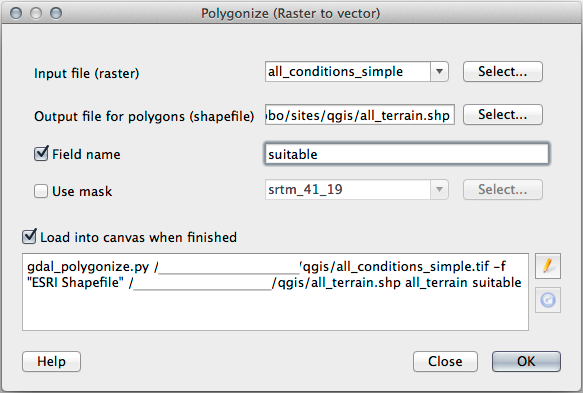
21.13.1. 래스터를 벡터화
Open the Query Builder by right-clicking on the all_terrain layer in the Layers panel, and selecting the tab.
Then build the query
"suitable" = 1.OK 를 클릭해서 이 기준을 만족하지 못 하는 모든 폴리곤을 필터링하십시오.
원래 래스터 위에 겹쳐보면, 다음과 같이 영역들이 완전히 일치해야 합니다.
You can save this layer by right-clicking on the all_terrain layer in the Layers panel and choosing Save As…, then continue as per the instructions.
21.13.2. 결과 점검
You may notice that some of the buildings in your new_solution layer have
been “sliced” by the Intersection tool. This shows that only part of the
building - and therefore only part of the property - lies on suitable terrain.
We can therefore sensibly eliminate those buildings from our dataset.
21.13.3. 분석 개선
이 시점에서, 사용자의 분석이 이렇게 보여야 합니다.
모든 방향으로 100미터씩 이어지는 원형 영역을 떠올려보십시오.
해당 영역의 반경이 100미터 이상일 경우, (모든 방향으로부터) 크기를 100미터 줄이면 다음과 같이 가운데에 영역의 일부가 남게 됩니다.
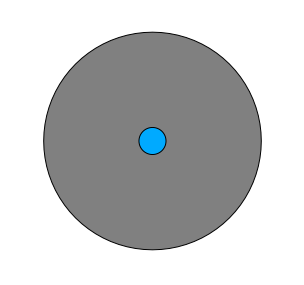
따라서, 기존 suitable_terrain 벡터 레이어에 대해 100미터 크기의 내부 버퍼(interior buffer) 를 실행할 수 있습니다. 이 버퍼 기능의 산출물에서, 원래 레이어로부터 남은 모든 영역이 100미터를 넘어서는 적합한 지역이 있는 영역을 나타내게 됩니다.
시연 :
메뉴에서 도구를 클릭해서 Buffer(s) 대화 창을 띄우십시오.
다음과 같이 설정하십시오.
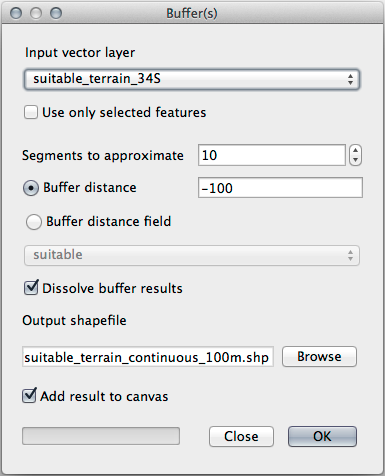
Use the suitable_terrain layer with
10segments and a buffer distance of-100. (The distance is automatically in meters because your map is using a projected CRS.)Save the output in
exercise_data/residential_development/assuitable_terrain_continuous100m.shp.If necessary, move the new layer above your original suitable_terrain layer.
결과물이 다음과 같이 보일 것입니다.

이제 Select by Location 도구를 실행하십시오. ()
다음과 같이 설정하십시오.
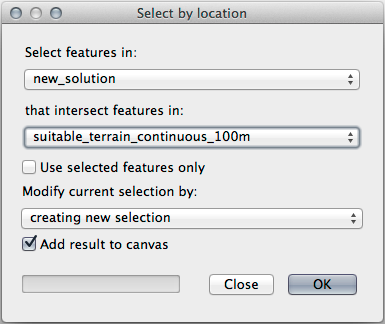
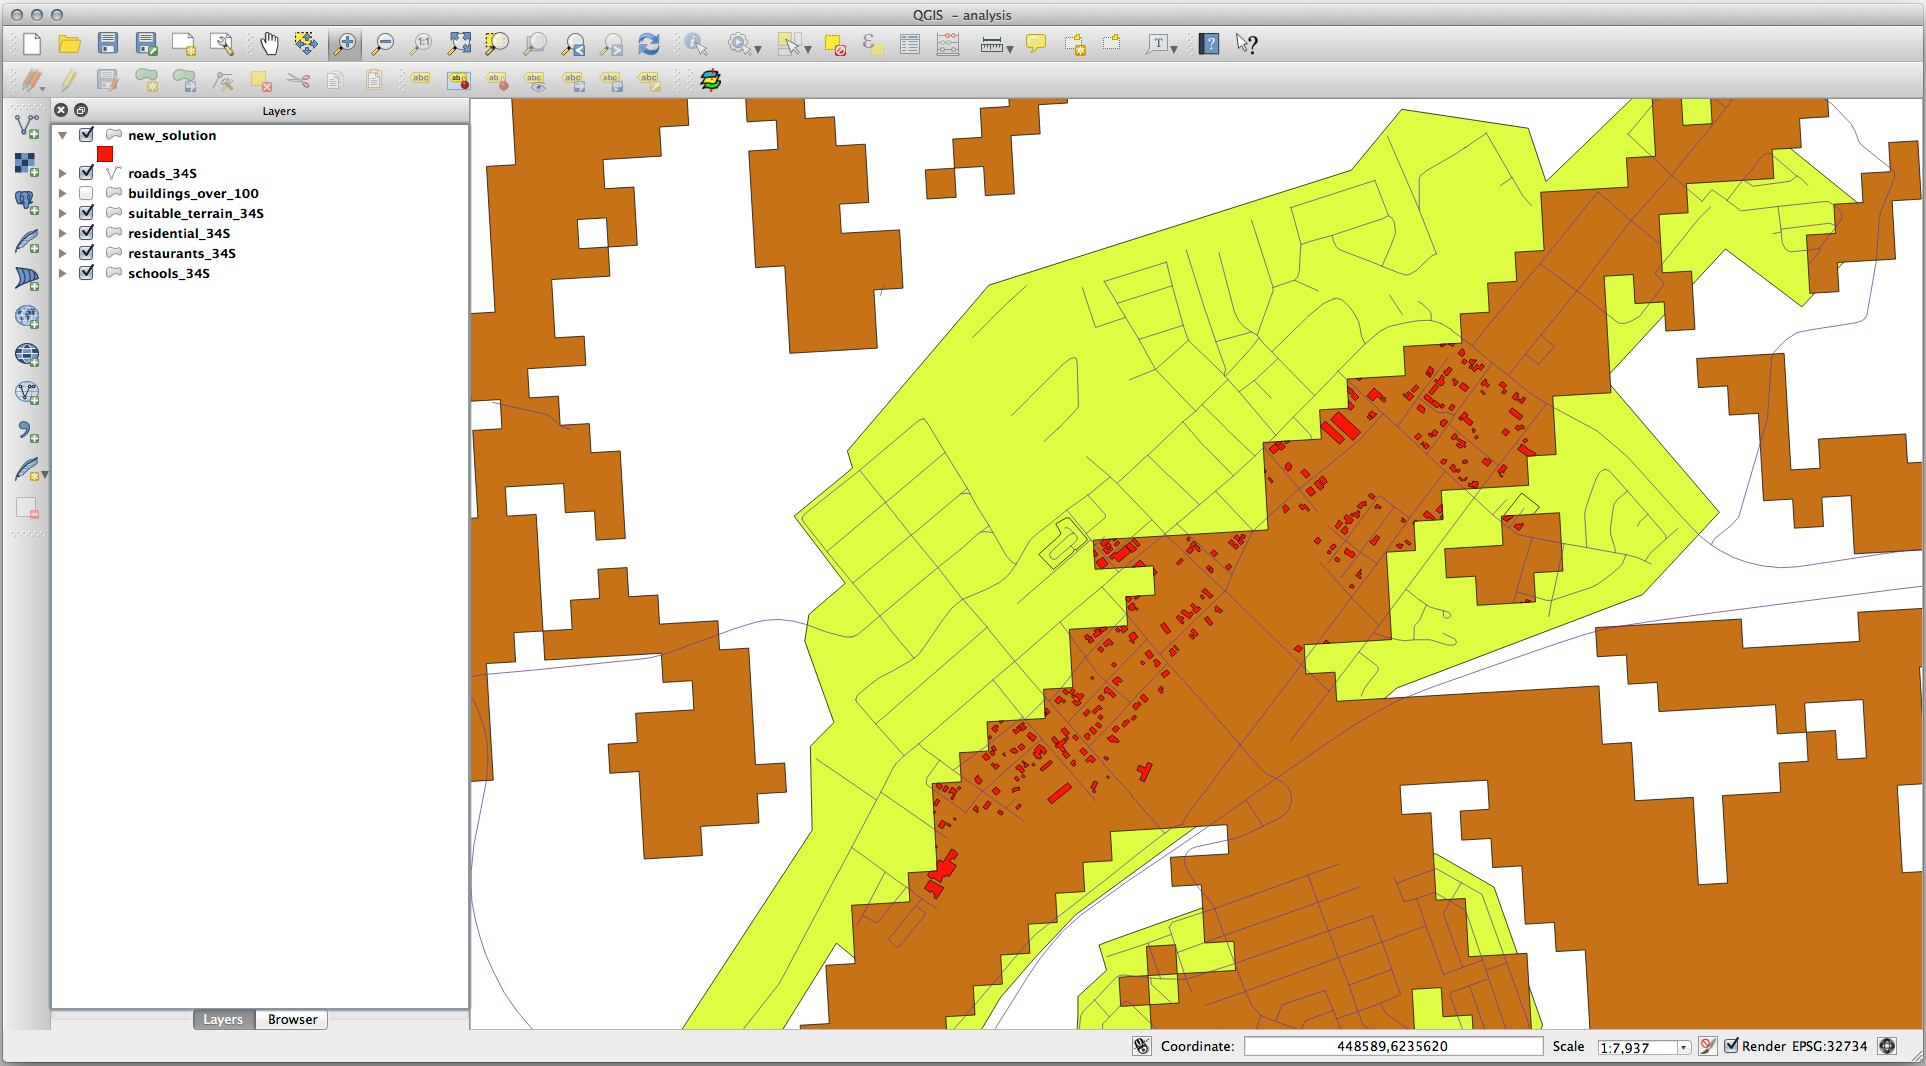
suitable_terrain_continuous100m.shp 가 담고 있는 피처와 교차(intersect)하는 new_solution 의 피처를 선택하십시오.
결과물은 다음과 같습니다.
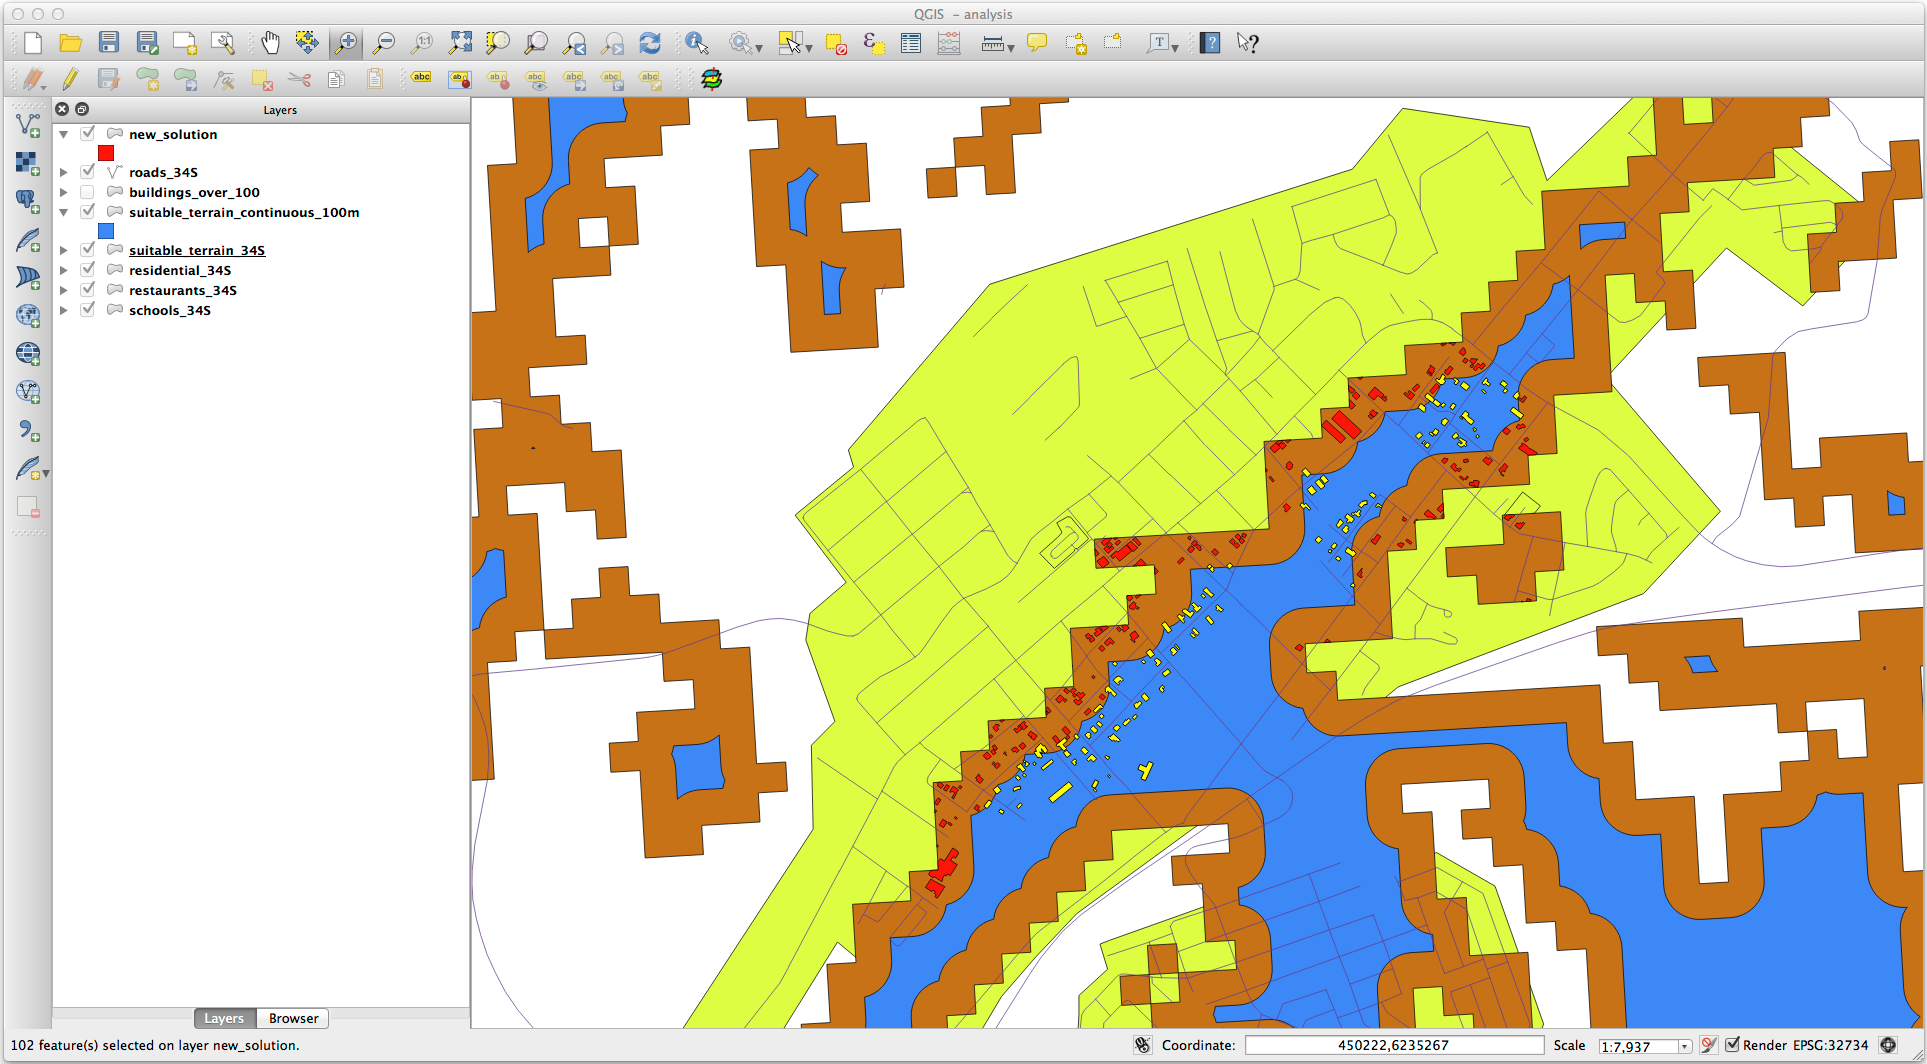
The yellow buildings are selected. Although some of the buildings fall partly outside the new suitable_terrain_continuous100m layer, they lie well within the original suitable_terrain layer and therefore meet all of our requirements.
Save the selection under
exercise_data/residential_development/asfinal_answer.shp.
21.14. Results For WMS
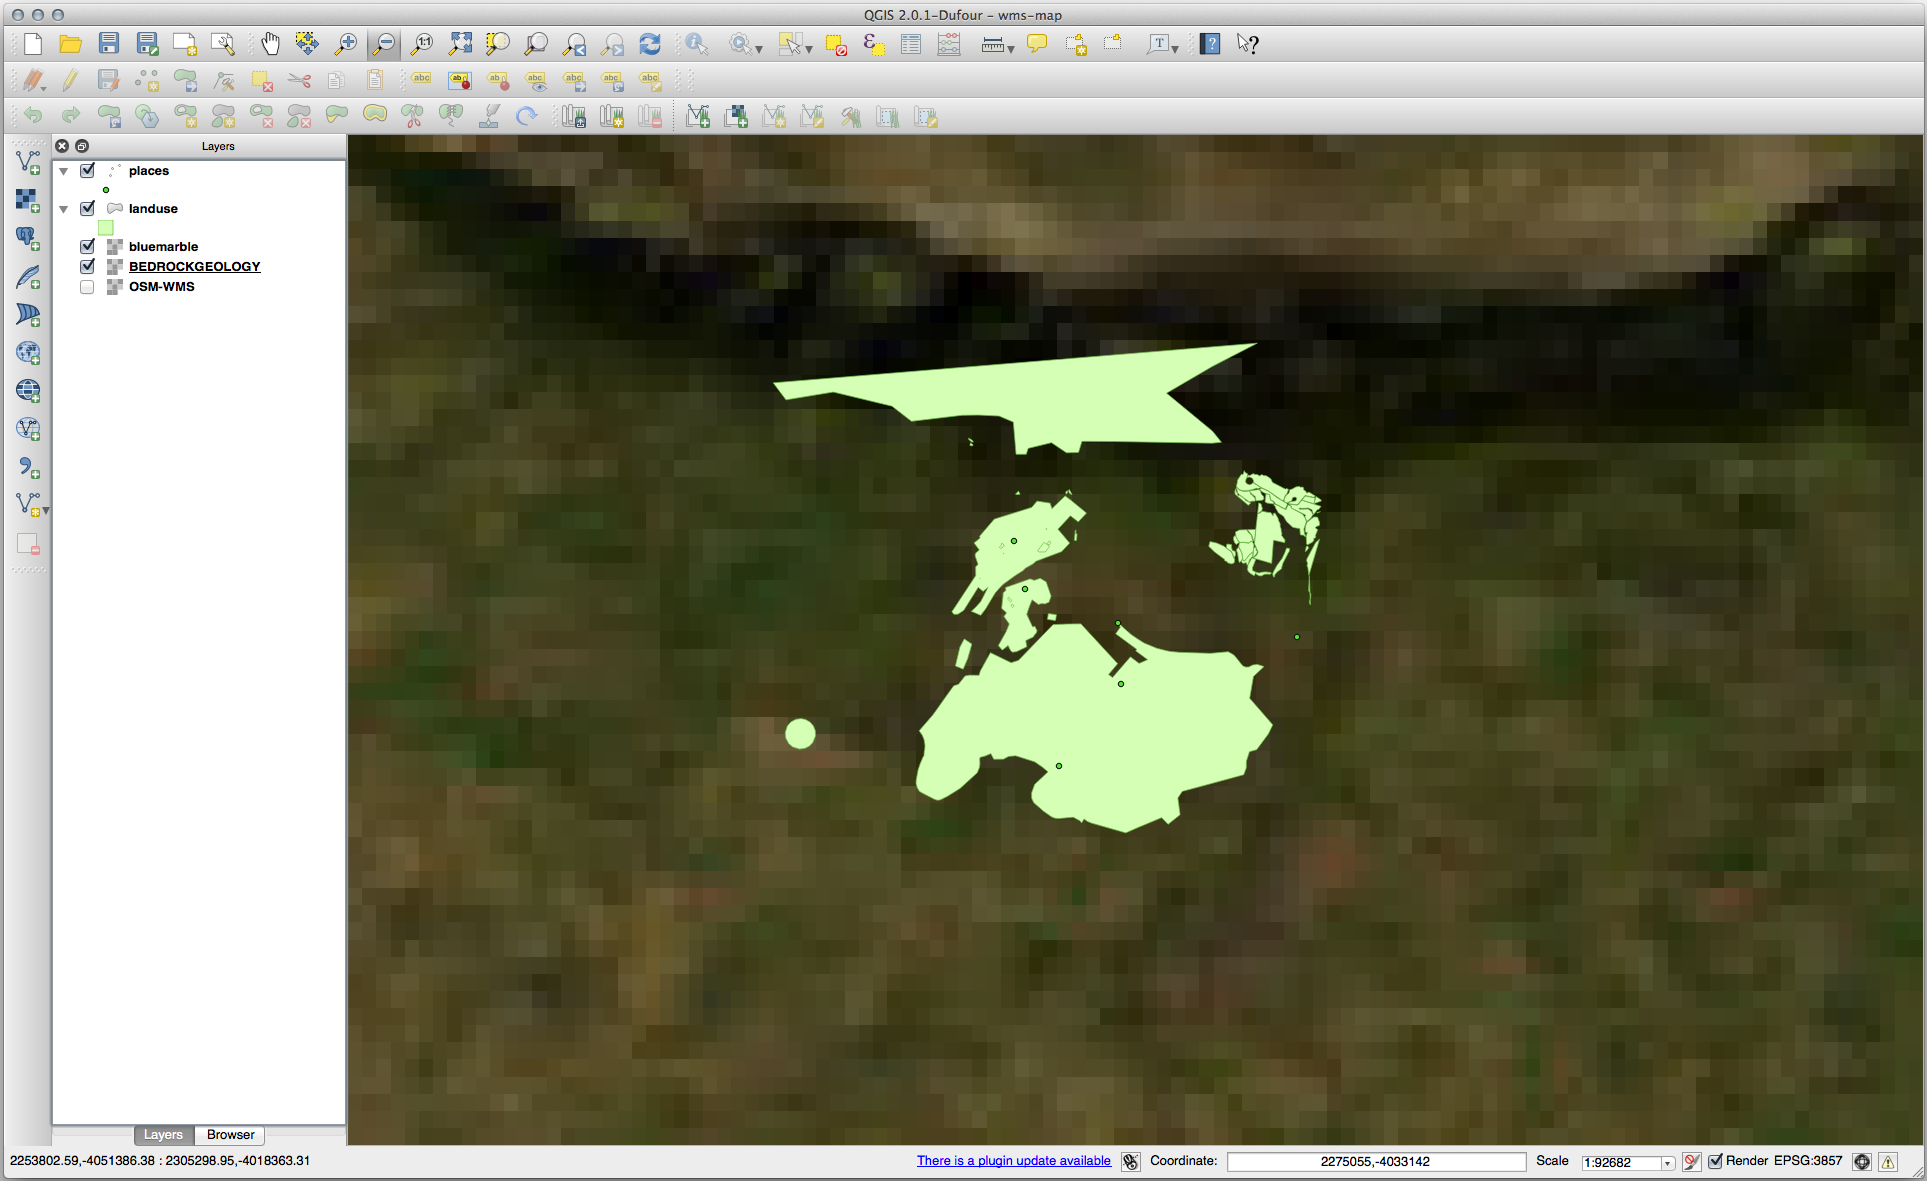
21.14.1. 또다른 WMS 레이어 추가
사용자 맵이 다음처럼 보여야 합니다. (레이어 순서를 변경해야 할 수도 있습니다.)
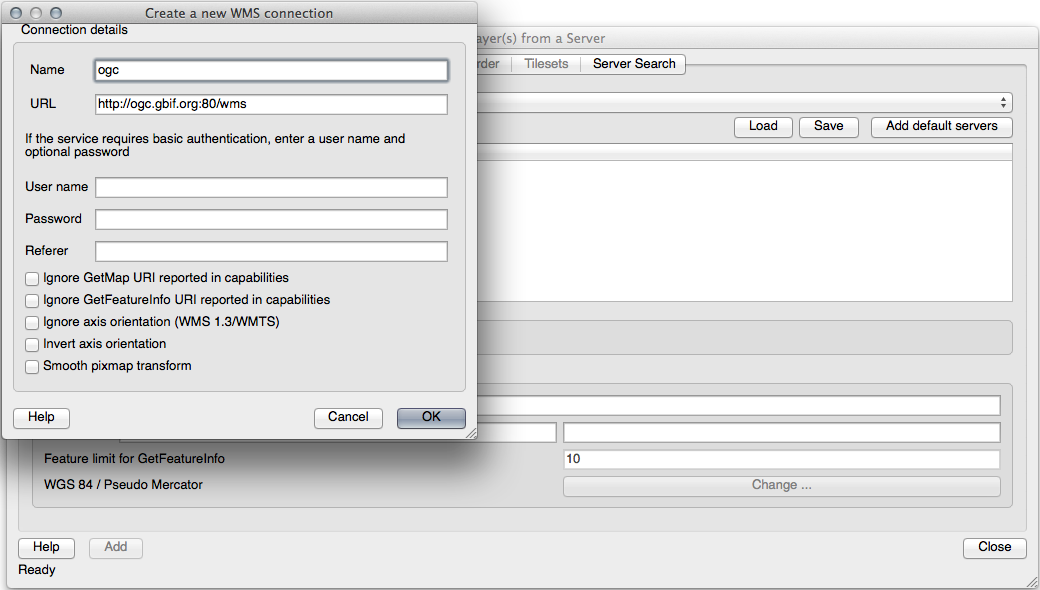
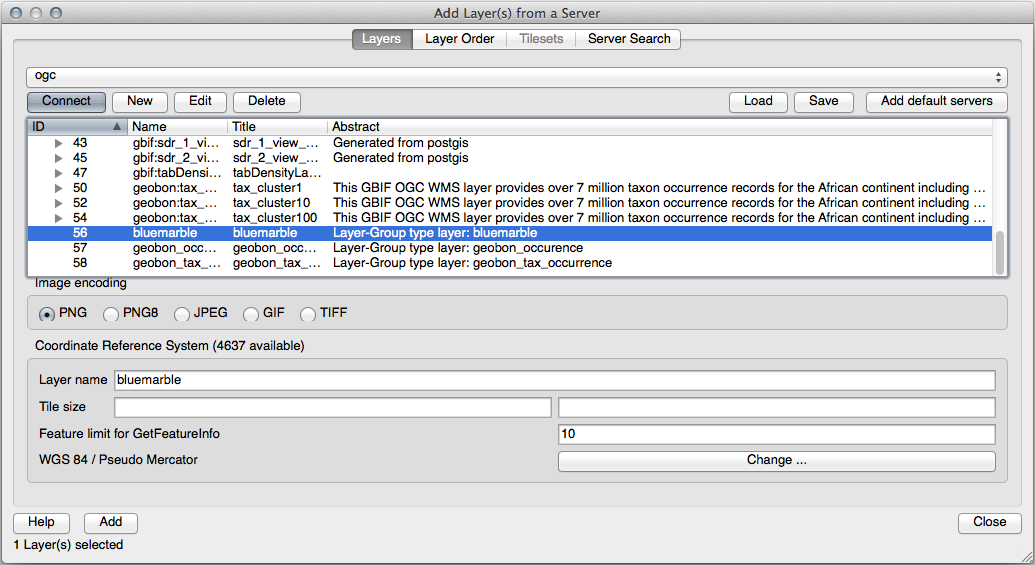
21.14.2. 새 WMS 서버 추가
이전과 동일한 방법으로 새 서버 및 해당 서버가 호스팅하고 있는 적합한 레이어를 추가하십시오.
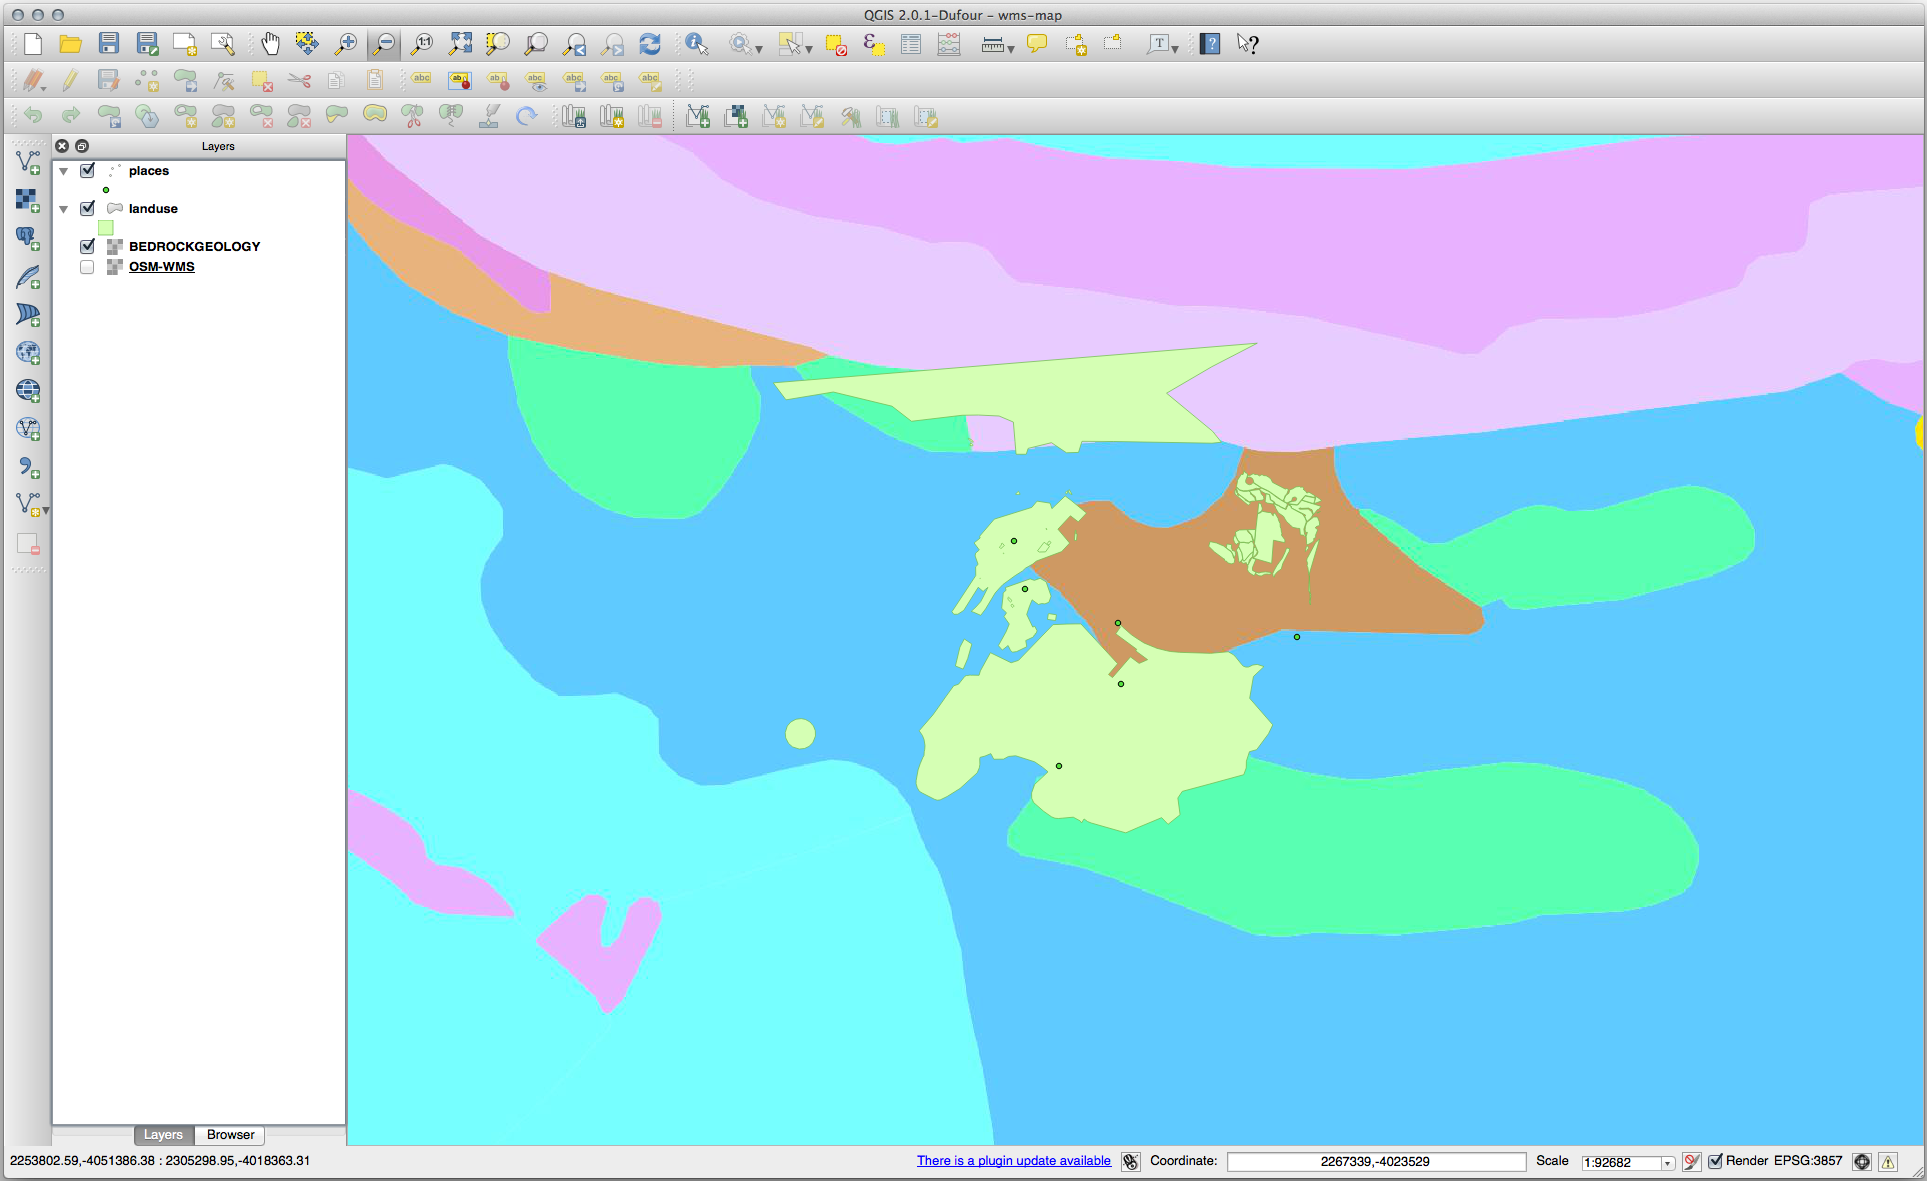
Swellendam 지역으로 줌인할 경우, 이 데이터셋의 해상도가 낮다는 사실을 알 수 있습니다.
따라서, 현재 맵에서 이 데이터를 사용하지 않는 편이 좋습니다. Blue Marble 데이터는 전 세계 또는 국가 단위 수준에 적합합니다.
21.14.3. WMS 서버 찾기
You may notice that many WMS servers are not always available. Sometimes this is temporary, sometimes it is permanent. An example of a WMS server that worked at the time of writing is the World Mineral Deposits WMS at http://apps1.gdr.nrcan.gc.ca/cgi-bin/worldmin_en-ca_ows. It does not require fees or have access constraints, and it is global. Therefore, it does satisfy the requirements. Keep in mind, however, that this is merely an example. There are many other WMS servers to choose from.
21.15. Results For GRASS Integration
21.15.1. Add Layers to Mapset
You can add layers (both vector and raster) into a GRASS Mapset by drag and drop
them in the Browser (see Follow Along: Load data using the QGIS Browser) or by using the v.in.gdal.qgis
for vector and r.in.gdal.qgis for raster layers.
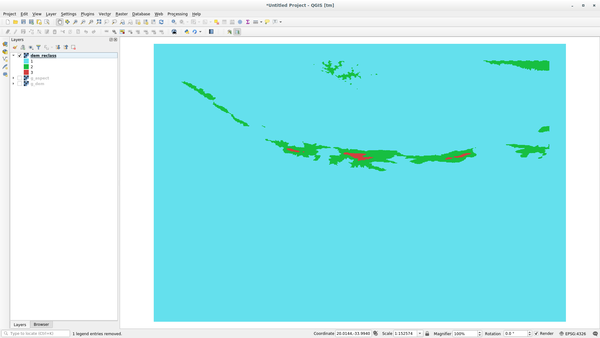
21.15.2. Reclassify raster layer
To discover the maximum value of the raster run the r.info tool: in the console you will see that the maximum value is 1699.
You are now ready to write the rules. Open a text editor and add the following rules:
0 thru 1000 = 1
1000 thru 1400 = 2
1400 thru 1699 = 3
save the file as a my_rules.txt file and close the text editor.
Run the r.reclass tool, choose the g_dem layer and load the file containing the rules you just have saved.
Click on Run and then on View Output. You can change the colors and the final result should look like the following picture:
21.16. Results For 데이터베이스 개념들
21.16.1. 주소 테이블 속성
우리의 이론적인 address 테이블의 경우, 다음 속성들을 저장하고자 할 수도 있습니다.
House Number
Street Name
Suburb Name
City Name
Postcode
Country
주소 오브젝트를 나타내는 테이블을 생성할 때, 이 속성들을 하나하나 나타내는 열을 생성하고 SQL을 준수하며 가능한 경우 축약된 명칭을 부여할 것입니다.
house_number
street_name
suburb
city
postcode
country
21.16.2. 인물 테이블 정규화
people 테이블의 큰 문제는 한 인물의 주소 전체를 담고 있는 주소 필드가 하나뿐이라는 사실입니다. 이 강의 이전 단계의 이론적인 address 테이블을 생각해보면, 우리는 주소가 서로 다른 여러 속성으로 이루어져 있다는 것을 알고 있습니다. 이 모든 속성들을 필드 하나에 저장한다면, 데이터를 업데이트하거나 쿼리하는 작업이 더욱 힘들어집니다. 따라서 주소 필드를 다양한 속성들로 나누어 다음과 같은 구조의 테이블을 생성해야 할 것입니다.
id |     name      | house_no |  street_name   |    city    |   phone_no
 --+---------------+----------+----------------+------------+-----------------
 1 | Tim Sutton    |     3    | Buirski Plein  | Swellendam | 071 123 123
 2 | Horst Duester |     4    | Avenue du Roix | Geneva     | 072 121 122
참고
다음 섹션에서, 이 예제의 데이터베이스 구조를 더욱 향상시킬 수 있는 외래 키 관계에 대해 배울 것입니다.
21.16.3. 인물 테이블 심화 정규화
현재 people 테이블은 다음과 같이 보입니다.
id |     name     | house_no | street_id |  phone_no
---+--------------+----------+-----------+-------------
 1 | Horst Duster |        4 |         1 | 072 121 122
street_id 열은 ‘people’ 오브젝트 및 관련 ‘street’ 오브젝트 사이의 ‘일대다’ 관계를 나타냅니다. 이때 ‘street’ 오브젝트는 streets 테이블에 있습니다.
테이블을 심도 있게 정규화하는 방법 가운데 하나는 명칭 필드를 다음과 같이 first_name 과 last_name 으로 나누는 것입니다.
id | first_name | last_name  | house_no | street_id |  phone_no
---+------------+------------+----------+-----------+------------
 1 |    Horst   |   Duster   |     4    |     1     | 072 121 122
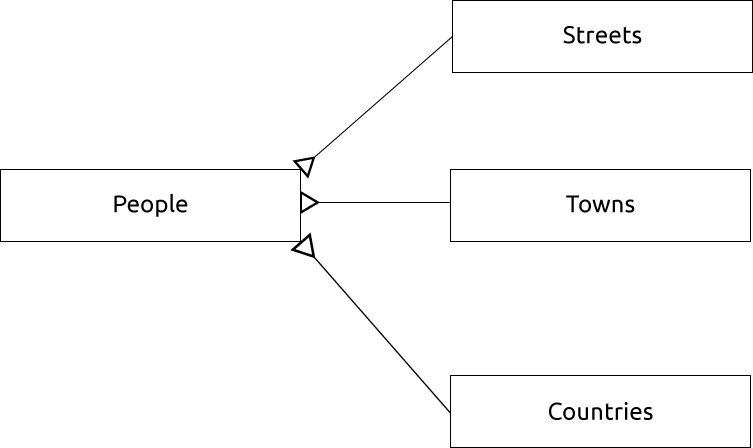
또한 마을이나 도시 명칭 및 국가를 위한 개별 테이블을 생성하고, 이들을 ‘일대다’ 관계를 통해 people 테이블에 연결할 수도 있습니다.
id | first_name | last_name | house_no | street_id | town_id | country_id
---+------------+-----------+----------+-----------+---------+------------
 1 |    Horst   |   Duster  |     4    |     1     |    2    |     1
이에 대한 ER 도표를 그린다면 다음과 같이 보일 것입니다.
21.16.4. 인물 테이블 생성
정확한 people 테이블을 생성하기 위해 필요한 SQL은 다음과 같습니다.
create table people (id serial not null primary key,
                     name varchar(50),
                     house_no int not null,
                     street_id int not null,
                     phone_no varchar null );
이 테이블의 스키마는 다음과 같습니다. (:kbd:` d people` 입력)
Table "public.people"

Column     |         Type          |                      Modifiers
-----------+-----------------------+-------------------------------------
id         | integer               | not null default
           |                       | nextval('people_id_seq'::regclass)
name       | character varying(50) |
house_no   | integer               | not null
street_id  | integer               | not null
phone_no   | character varying     |
Indexes:
  "people_pkey" PRIMARY KEY, btree (id)
참고
보기 쉽게 하기 위해, 일부러 외래 키 제약을 제외했습니다.
21.16.5. DROP 명령어
이 경우 DROP 명령어가 먹히지 않는 이유는 people 테이블이 streets 테이블에 외래 키 제약을 갖추고 있기 때문입니다. 즉 streets 테이블을 드롭하면 (또는 삭제하면) people 테이블이 존재하지 않는 streets 데이터를 참조하게 됩니다.
참고
CASCADE 명령어를 사용하면 streets 테이블을 ‘강제로’ 삭제할 수 있지만, 동시에 people 테이블은 물론 streets 테이블과 관계가 있는 모든 테이블을 삭제하게 됩니다. 조심해서 사용하세요!
21.16.6. 새 도로 삽입
The SQL command you should use looks like this (you can replace the street name with a name of your choice):
insert into streets (name) values ('Low Road');
21.16.7. 외래 키 관계를 가진 새 인물 추가
정확한 SQL 선언문은 다음과 같습니다.
insert into streets (name) values('Main Road');
insert into people (name,house_no, street_id, phone_no)
  values ('Joe Smith',55,2,'072 882 33 21');
다시 (이전과 동일한 선택 선언문을 써서) streets 테이블을 보면, Main Road 항목에 대한 id 값이 2 라는 것을 알 수 있습니다.
이것이 앞에서 단순히 숫자 2 만 입력해도 됐던 이유입니다. 앞의 선언문에서 Main Road 라고 전부 풀어 쓰지 않아도, 데이터베이스가 street_id 값이 2 인 레코드들을 모두 연결할 수 있습니다.
참고
이미 새로운 street 오브젝트를 추가했다면, 새 Main Road 의 ID가 2 가 아닌 3 임을 볼 수 있을 것입니다.
21.16.8. 도로명 반환
사용자가 사용해야 할 정확한 SQL 선언문은 다음과 같습니다.
select count(people.name), streets.name
from people, streets
where people.street_id=streets.id
group by streets.name;
결과 :
count |    name
------+-------------
    1 | Low Street
    2 | High street
    1 | Main Road
(3 rows)
참고
이미 테이블 명칭들을 (people.name 이나 streets.name 처럼) 정해놓았다는 사실을 알아차렸을 겁니다. 항목명이 모호할 경우에 (데이터베이스 내부의 모든 테이블에서 유일하지 않을 경우) 이런 조치가 필요합니다.
21.17. Results For 공간 쿼리
21.17.1. 공간 쿼리에 사용되는 단위들
예제 쿼리가 사용하는 단위는 도(degree)입니다. 해당 레이어가 사용하는 CRS가 WGS84이기 때문입니다. WGS84는 지리 CRS로, 지리 CRS는 도를 단위로 사용합니다. UTM 투영체와 같은 투영 CRS는 미터를 단위로 사용합니다.
쿼리 작성 시 레이어의 CRS가 사용하는 단위를 알아야 한다는 사실을 기억하십시오. 그래야만 사용자가 예상하는 결과를 반환하는 쿼리를 작성할 수 있습니다.
21.17.2. 공간 인덱스 생성
CREATE INDEX cities_geo_idx
  ON cities
  USING gist (the_geom);
21.18. Results For 도형 구성
21.18.1. 라인스트링 생성
alter table streets add column the_geom geometry;
alter table streets add constraint streets_geom_point_chk check
     (st_geometrytype(the_geom) = 'ST_LineString'::text OR the_geom IS NULL);
insert into geometry_columns values ('','public','streets','the_geom',2,4326,
     'LINESTRING');
create index streets_geo_idx
  on streets
  using gist
  (the_geom);
21.18.2. 테이블 연결
delete from people;
alter table people add column city_id int not null references cities(id);
(QGIS에서 도시를 캡처하십시오.)
insert into people (name,house_no, street_id, phone_no, city_id, the_geom)
   values ('Faulty Towers',
           34,
           3,
           '072 812 31 28',
           1,
           'SRID=4326;POINT(33 33)');

insert into people (name,house_no, street_id, phone_no, city_id, the_geom)
   values ('IP Knightly',
           32,
           1,
           '071 812 31 28',
           1,F
           'SRID=4326;POINT(32 -34)');

insert into people (name,house_no, street_id, phone_no, city_id, the_geom)
   values ('Rusty Bedsprings',
           39,
           1,
           '071 822 31 28',
           1,
           'SRID=4326;POINT(34 -34)');
다음 오류 메시지를 반환받을 경우,
ERROR:  insert or update on table "people" violates foreign key constraint
        "people_city_id_fkey"
DETAIL: Key (city_id)=(1) is not present in table "cities".
cities 테이블에 대해 폴리곤을 생성하려 하는 동안 일부를 삭제하고 다시 시작해야 한다는 의미입니다. 사용자의 cities 테이블에 있는 항목들을 확인하고 존재하는 id 를 사용하십시오.
21.19. Results For 단순 피처 모델
21.19.1. 테이블에 값 채우기
create table cities (id serial not null primary key,
                     name varchar(50),
                     the_geom geometry not null);
 alter table cities
 add constraint cities_geom_point_chk
 check (st_geometrytype(the_geom) = 'ST_Polygon'::text );
21.19.2. ‘geometry_columns’ 테이블 채우기
insert into geometry_columns values
      ('','public','cities','the_geom',2,4326,'POLYGON');
21.19.3. 도형 추가
select people.name,
       streets.name as street_name,
       st_astext(people.the_geom) as geometry
from   streets, people
where  people.street_id=streets.id;
결과 :
     name     | street_name |   geometry
--------------+-------------+---------------
 Roger Jones  | High street |
 Sally Norman | High street |
 Jane Smith   | Main Road   |
 Joe Bloggs   | Low Street  |
 Fault Towers | Main Road   | POINT(33 -33)
(5 rows)
제약 조건 덕분에 데이터베이스에 Null 값을 추가할 수 있다는 사실을 알 수 있습니다.