21. 답안지
21.1. Results For 첫 레이어 추가
21.2. Results For 인터페이스 개요
21.3. Results For 벡터 데이터 작업
21.3.1.  Shapefiles
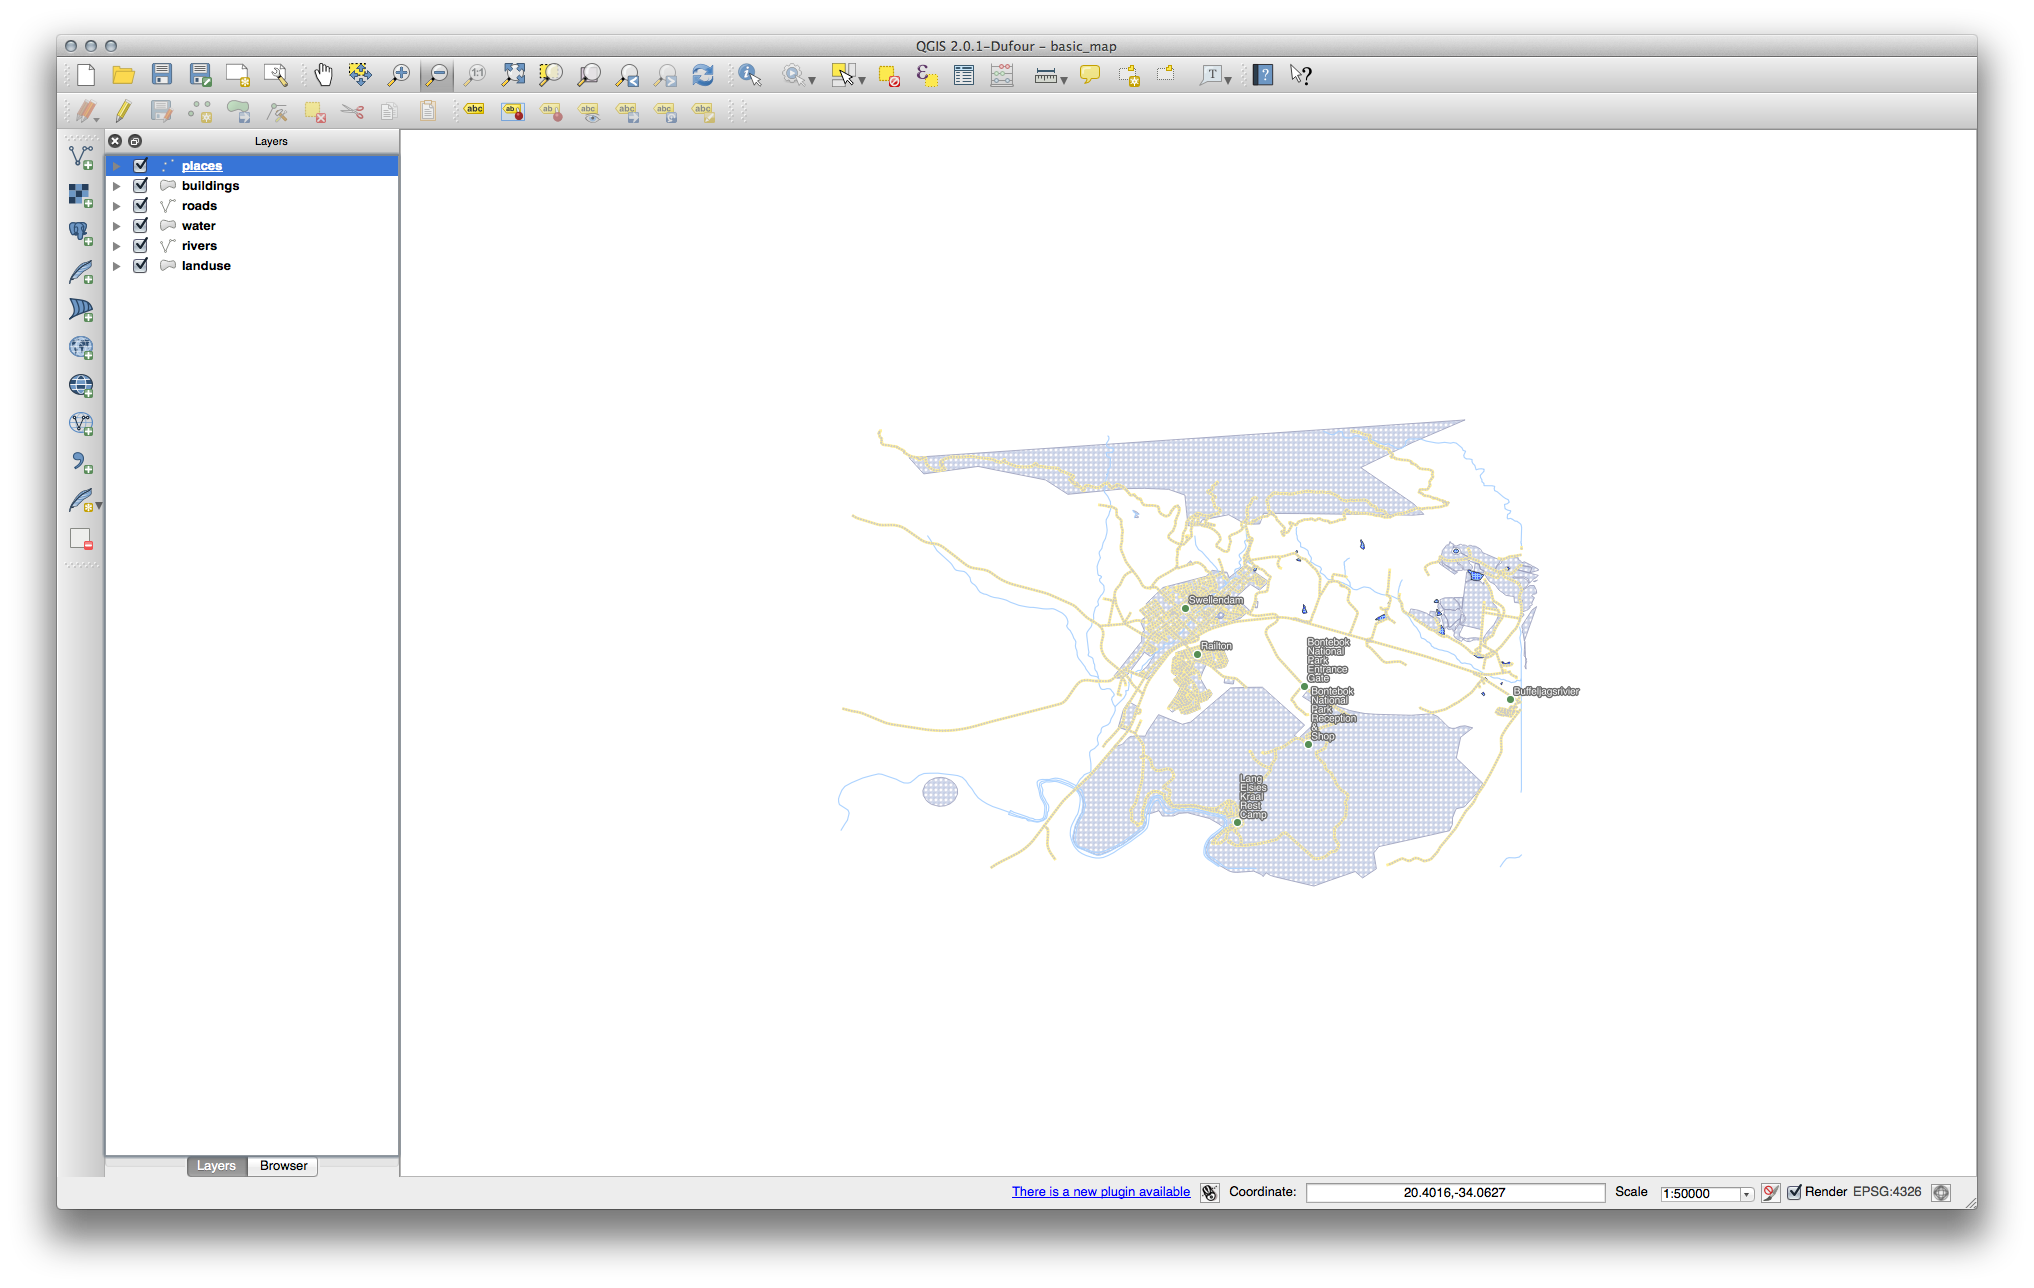
There should be five layers on your map:
- places
- water
- buildings
- rivers and
- roads.
21.3.2. Databases
All the vector layers should be loaded into the map. It probably won’t look nice yet though (we’ll fix the ugly colors later).
21.4. Results For 심볼
21.4.1. 색상
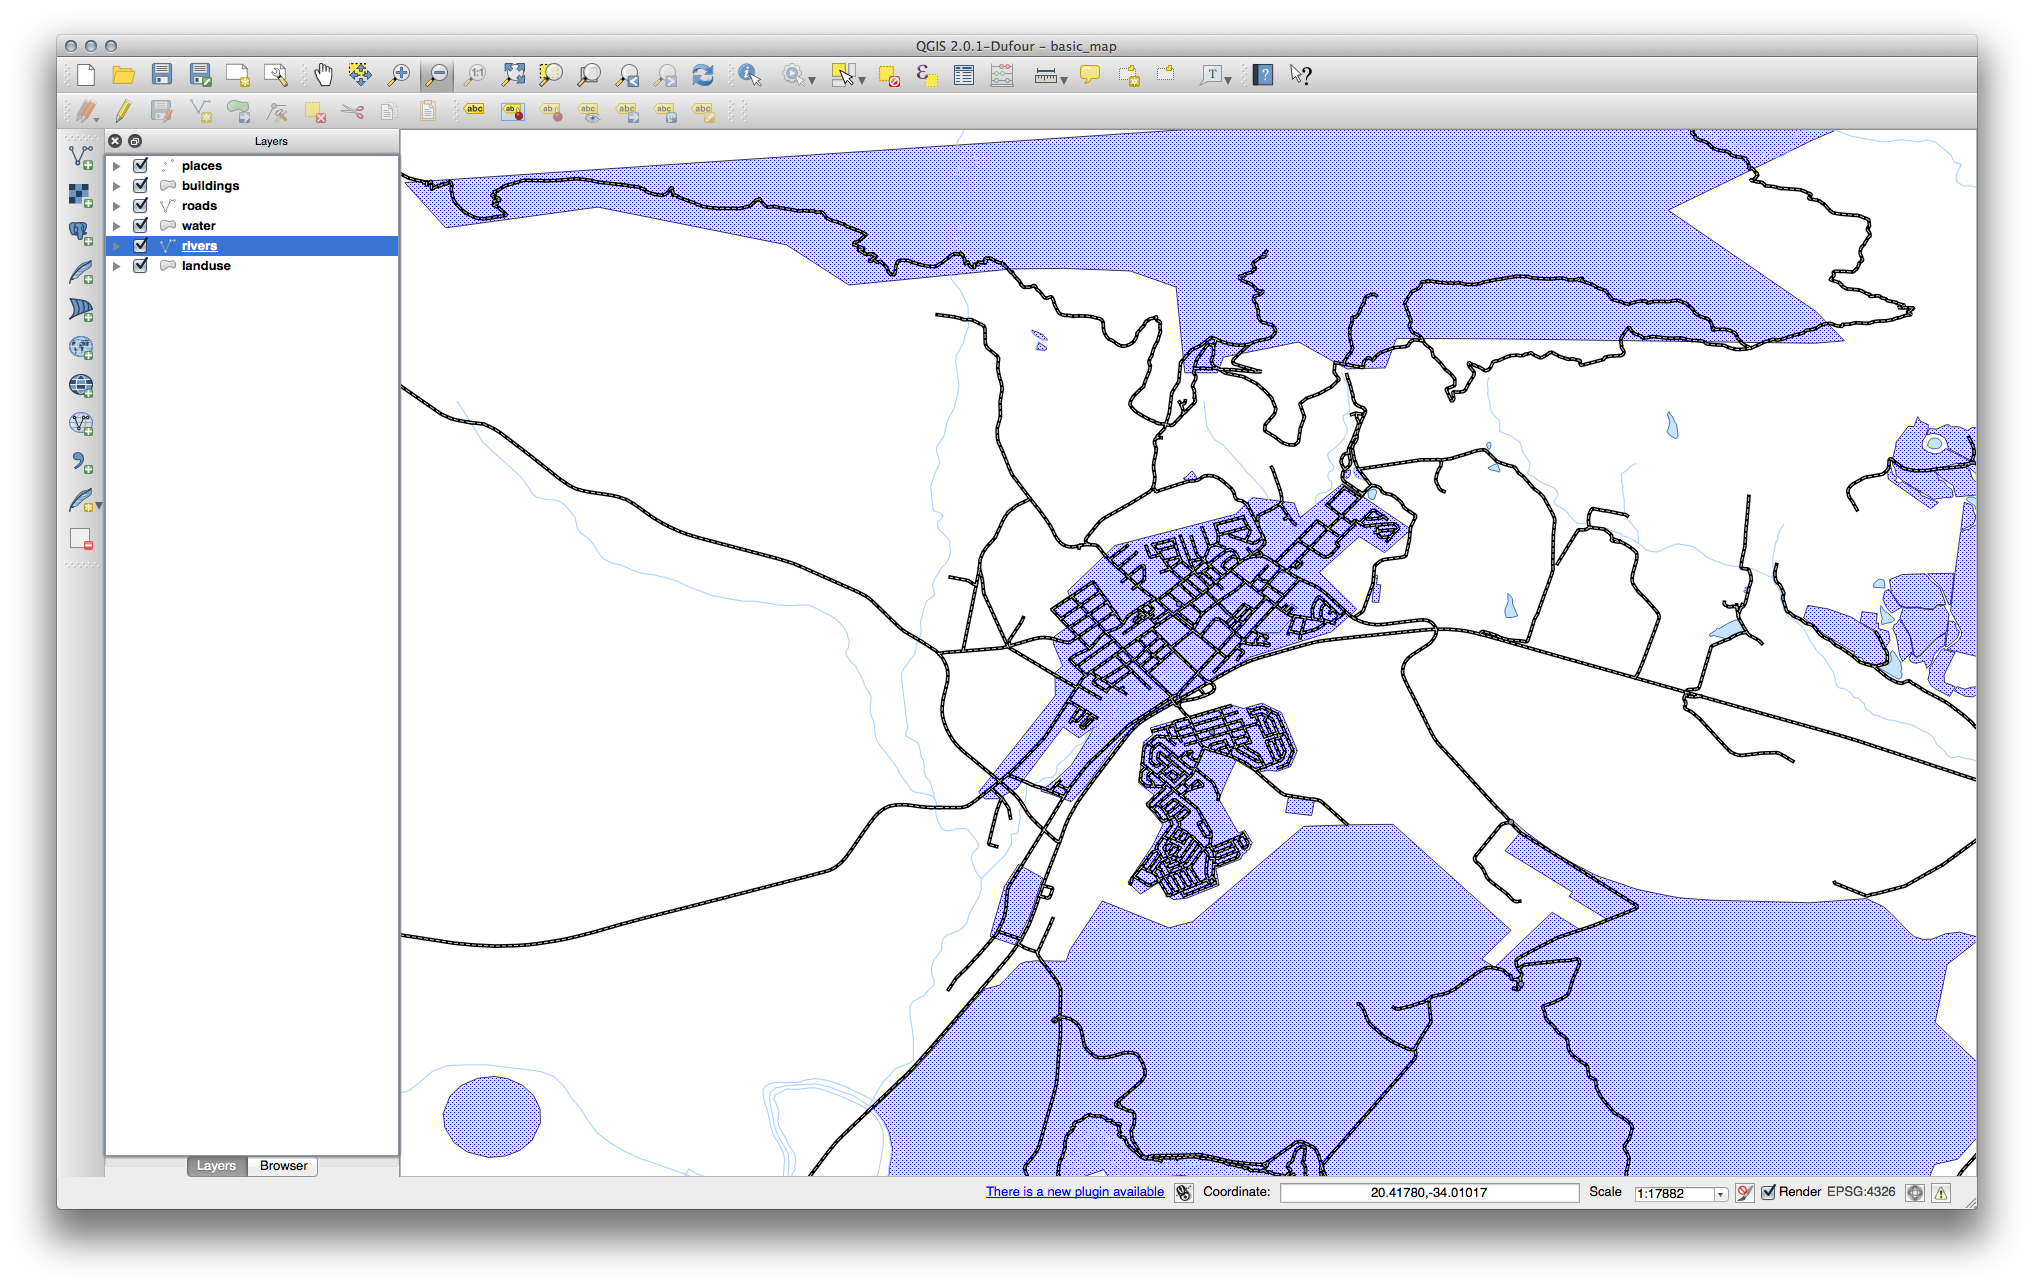
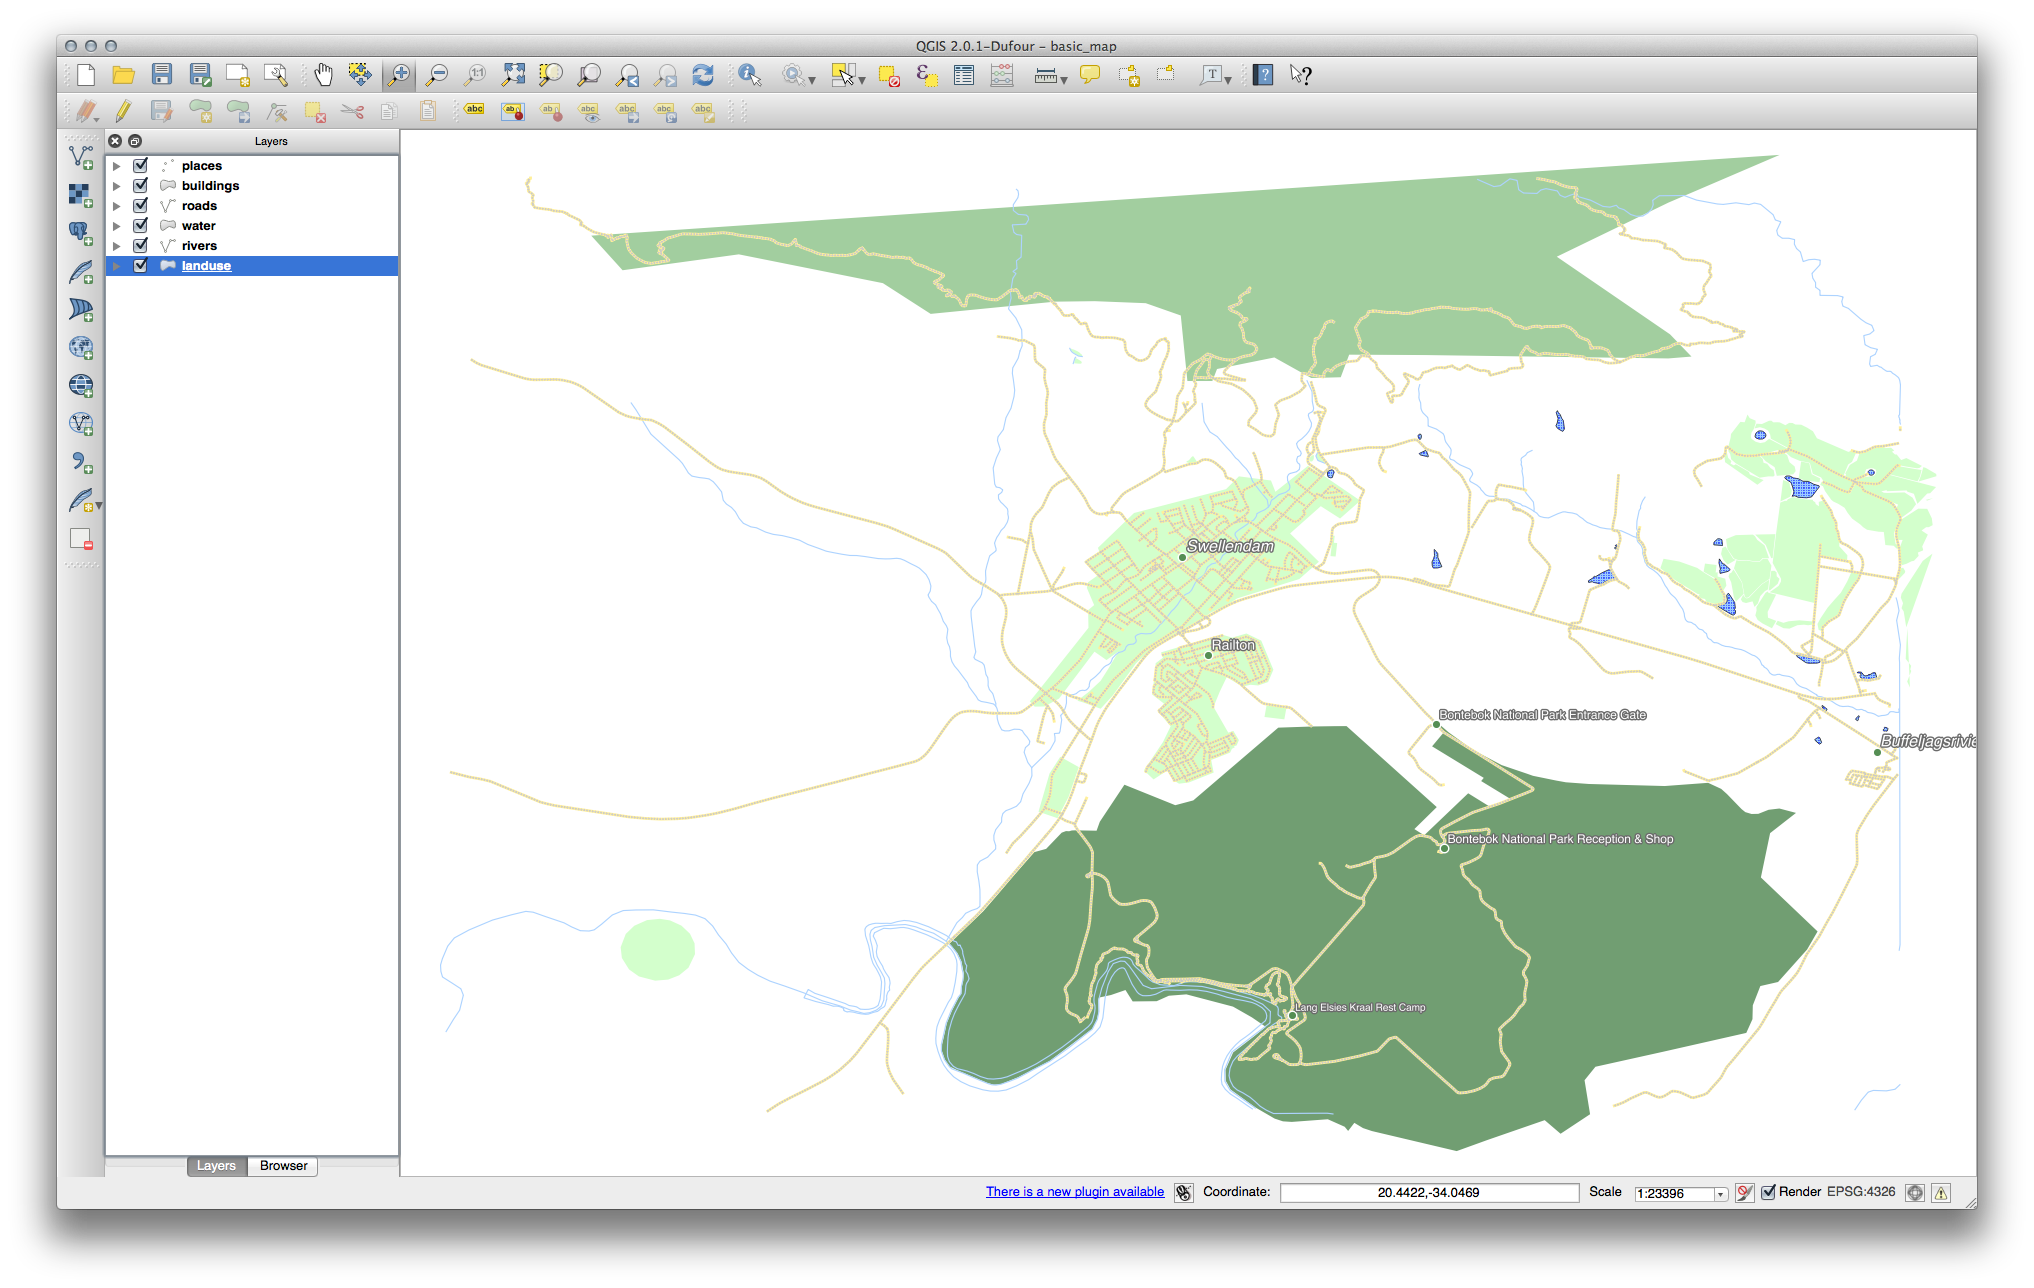
사용자가 예상한 대로 색상이 바뀌었는지 확인하십시오.
- It is enough to change only the water layer for now. An example is below, but may look different depending on the color you chose.
주석
If you want to work on only one layer at a time and don’t want the other layers to distract you, you can hide a layer by clicking in the check box next to its name in the Layers list. If the box is blank, then the layer is hidden.
21.4.2. 심볼 구조
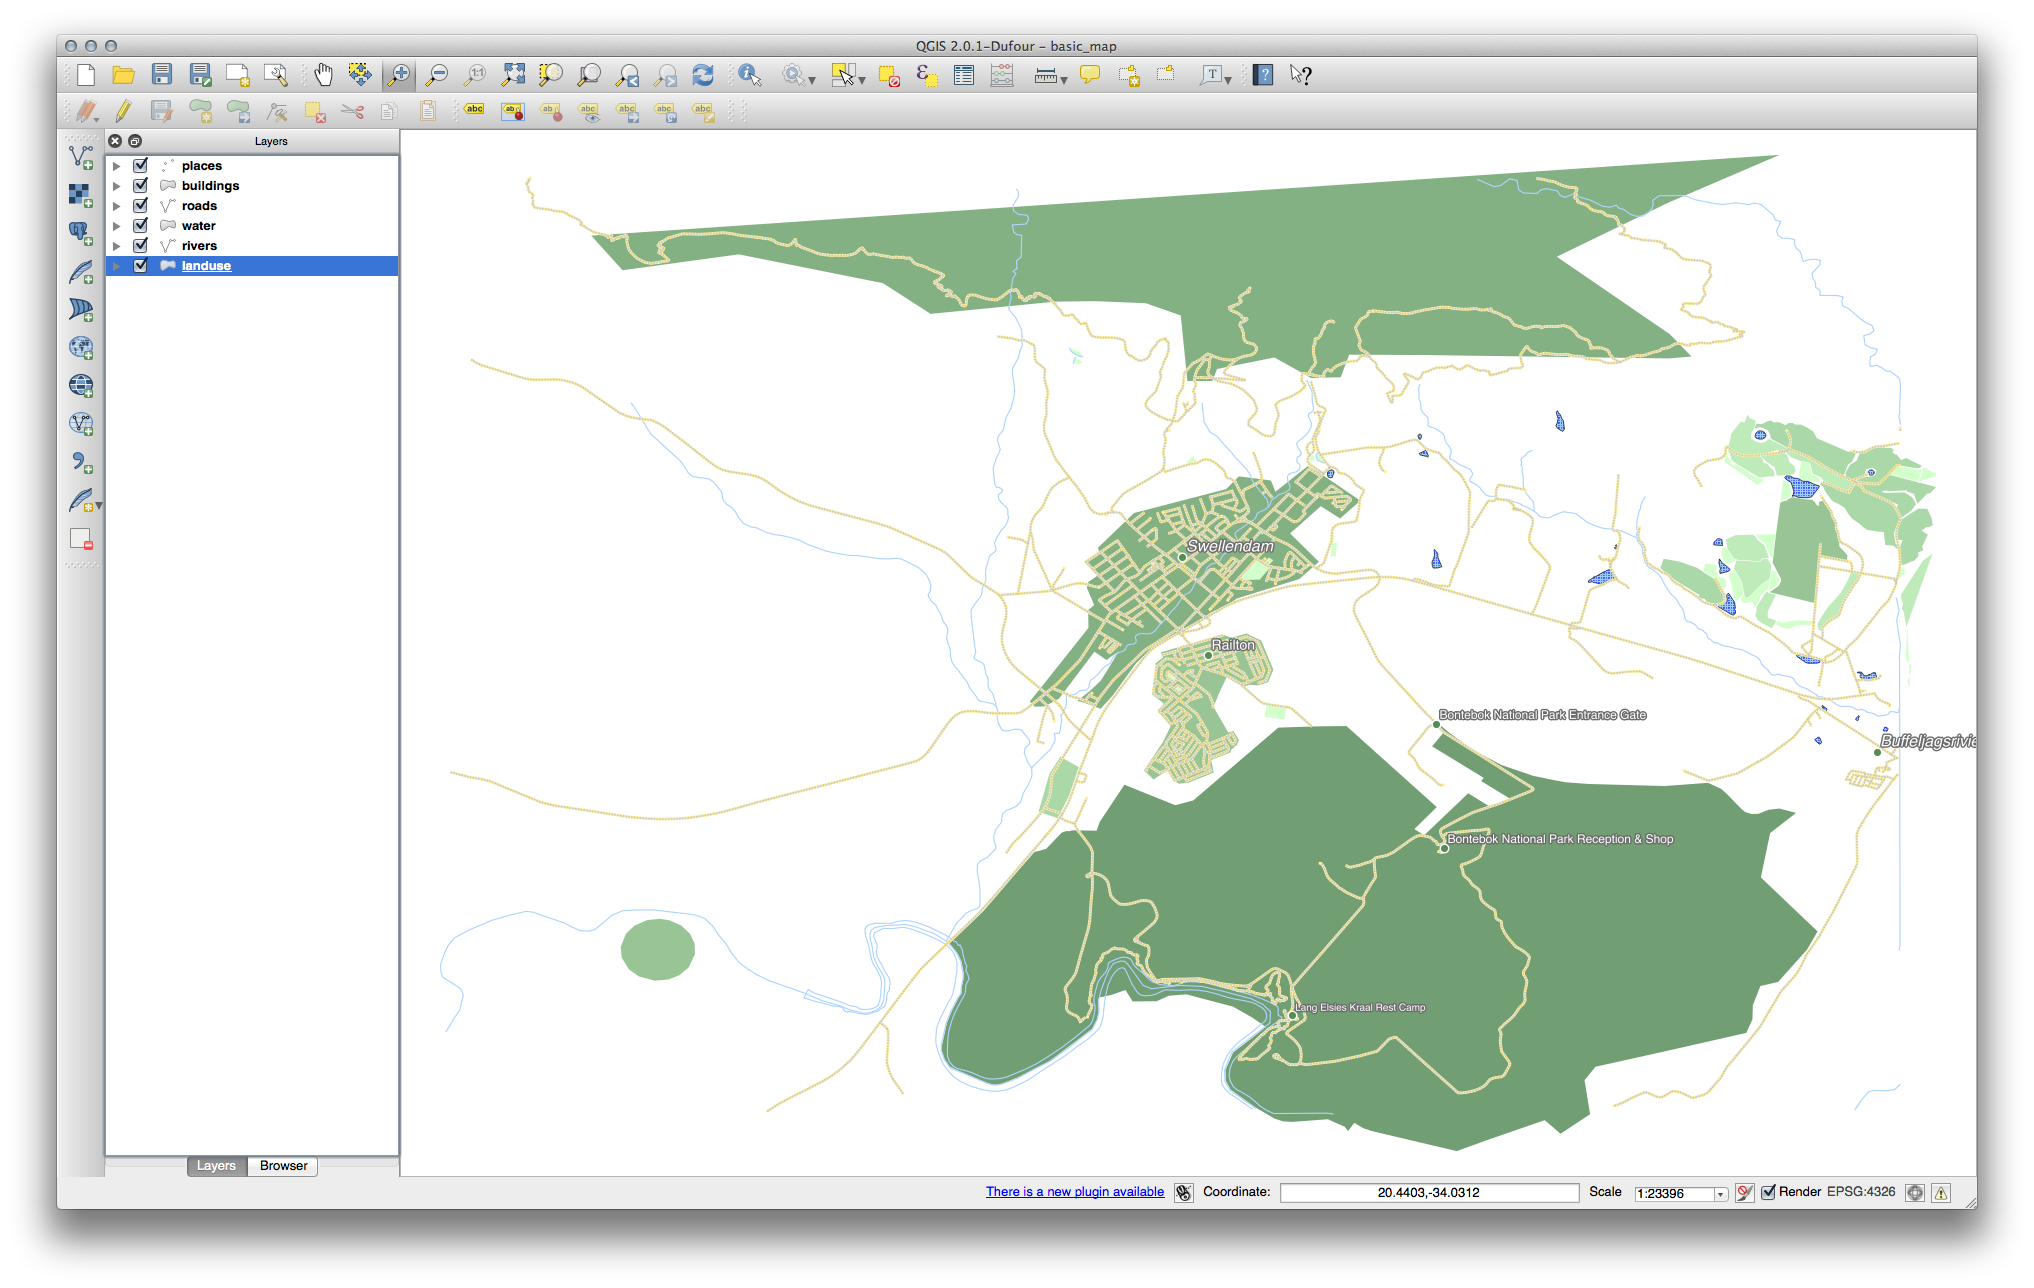
이제 사용자 맵이 이렇게 보여야 합니다.
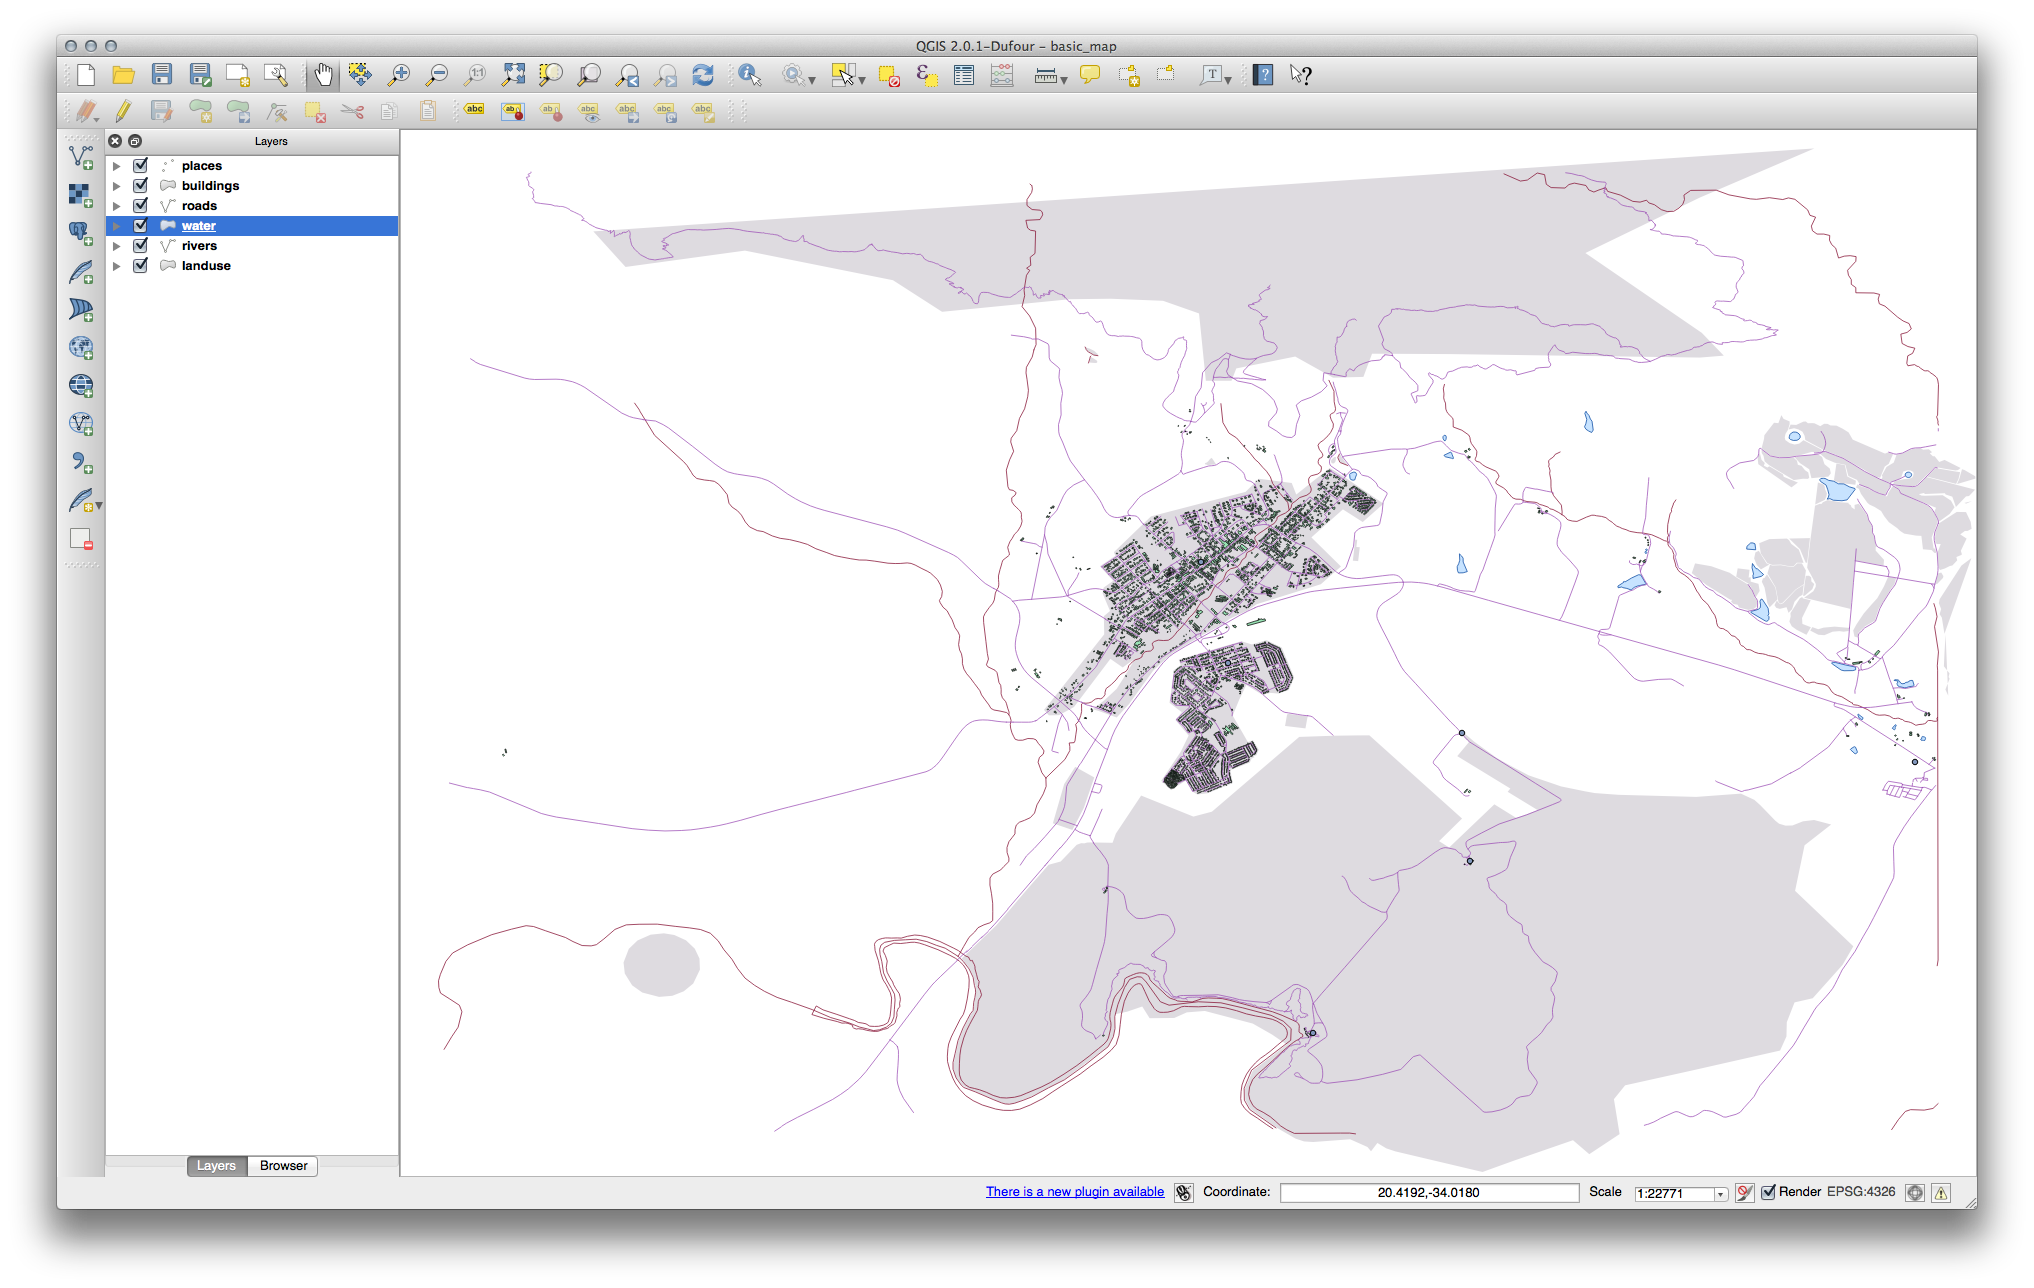
초급 수준 사용자일 경우, 이 단계에서 멈춰도 됩니다.
앞에서 언급한 방법을 이용해서 나머지 모든 레이어들의 색상 및 스타일을 변경하십시오.
오브젝트의 자연스러운 색상을 이용해보십시오. 예를 들어 도로는 빨강이나 파랑이 아니라 회색이나 검정이어야 합니다.
- Also feel free to experiment with different Fill Style and Border Style settings for the polygons.
21.4.3.  심볼 레이어
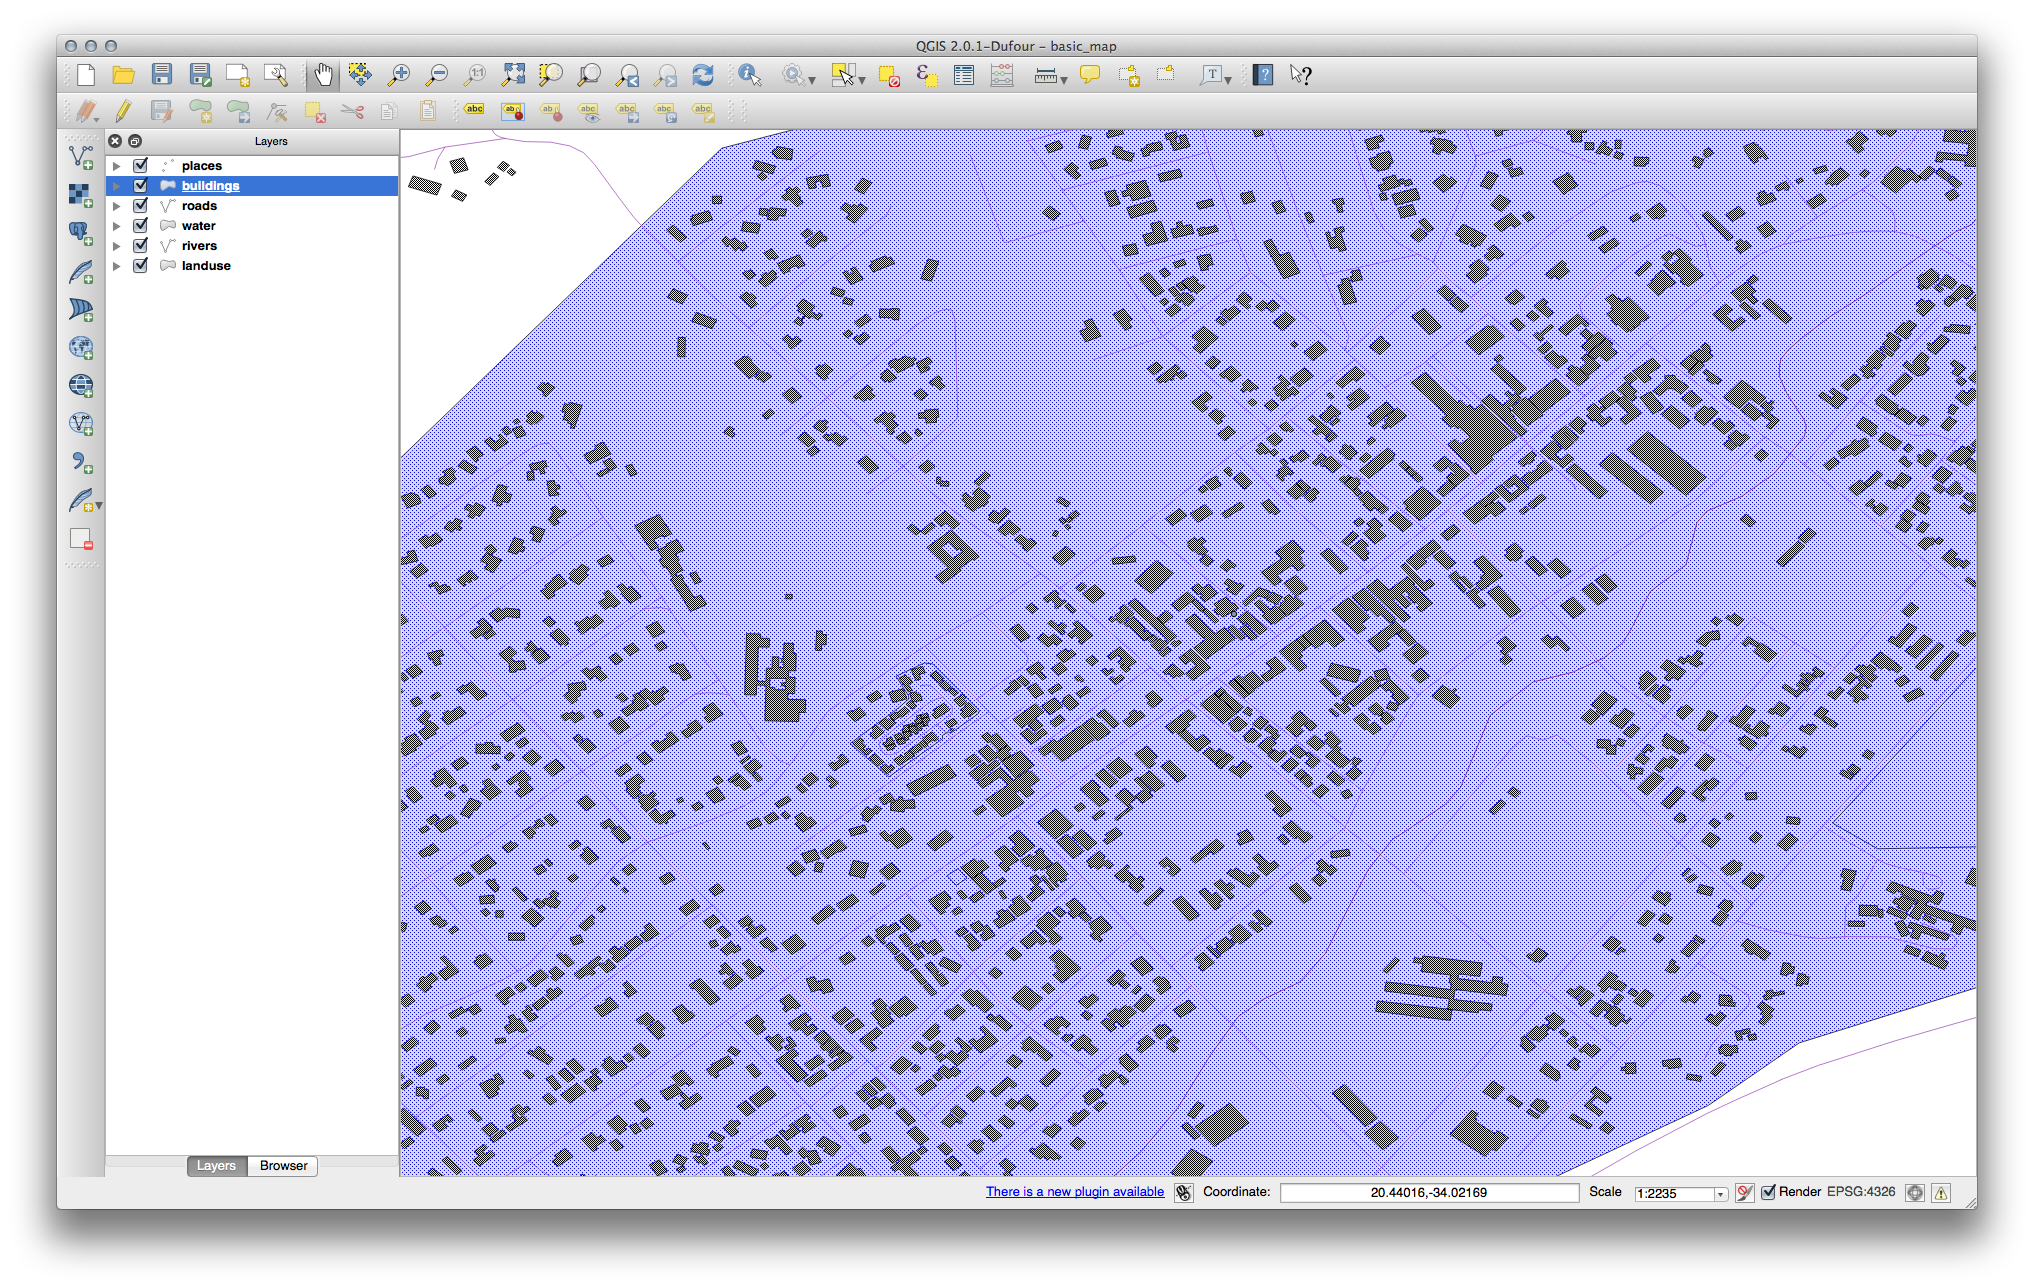
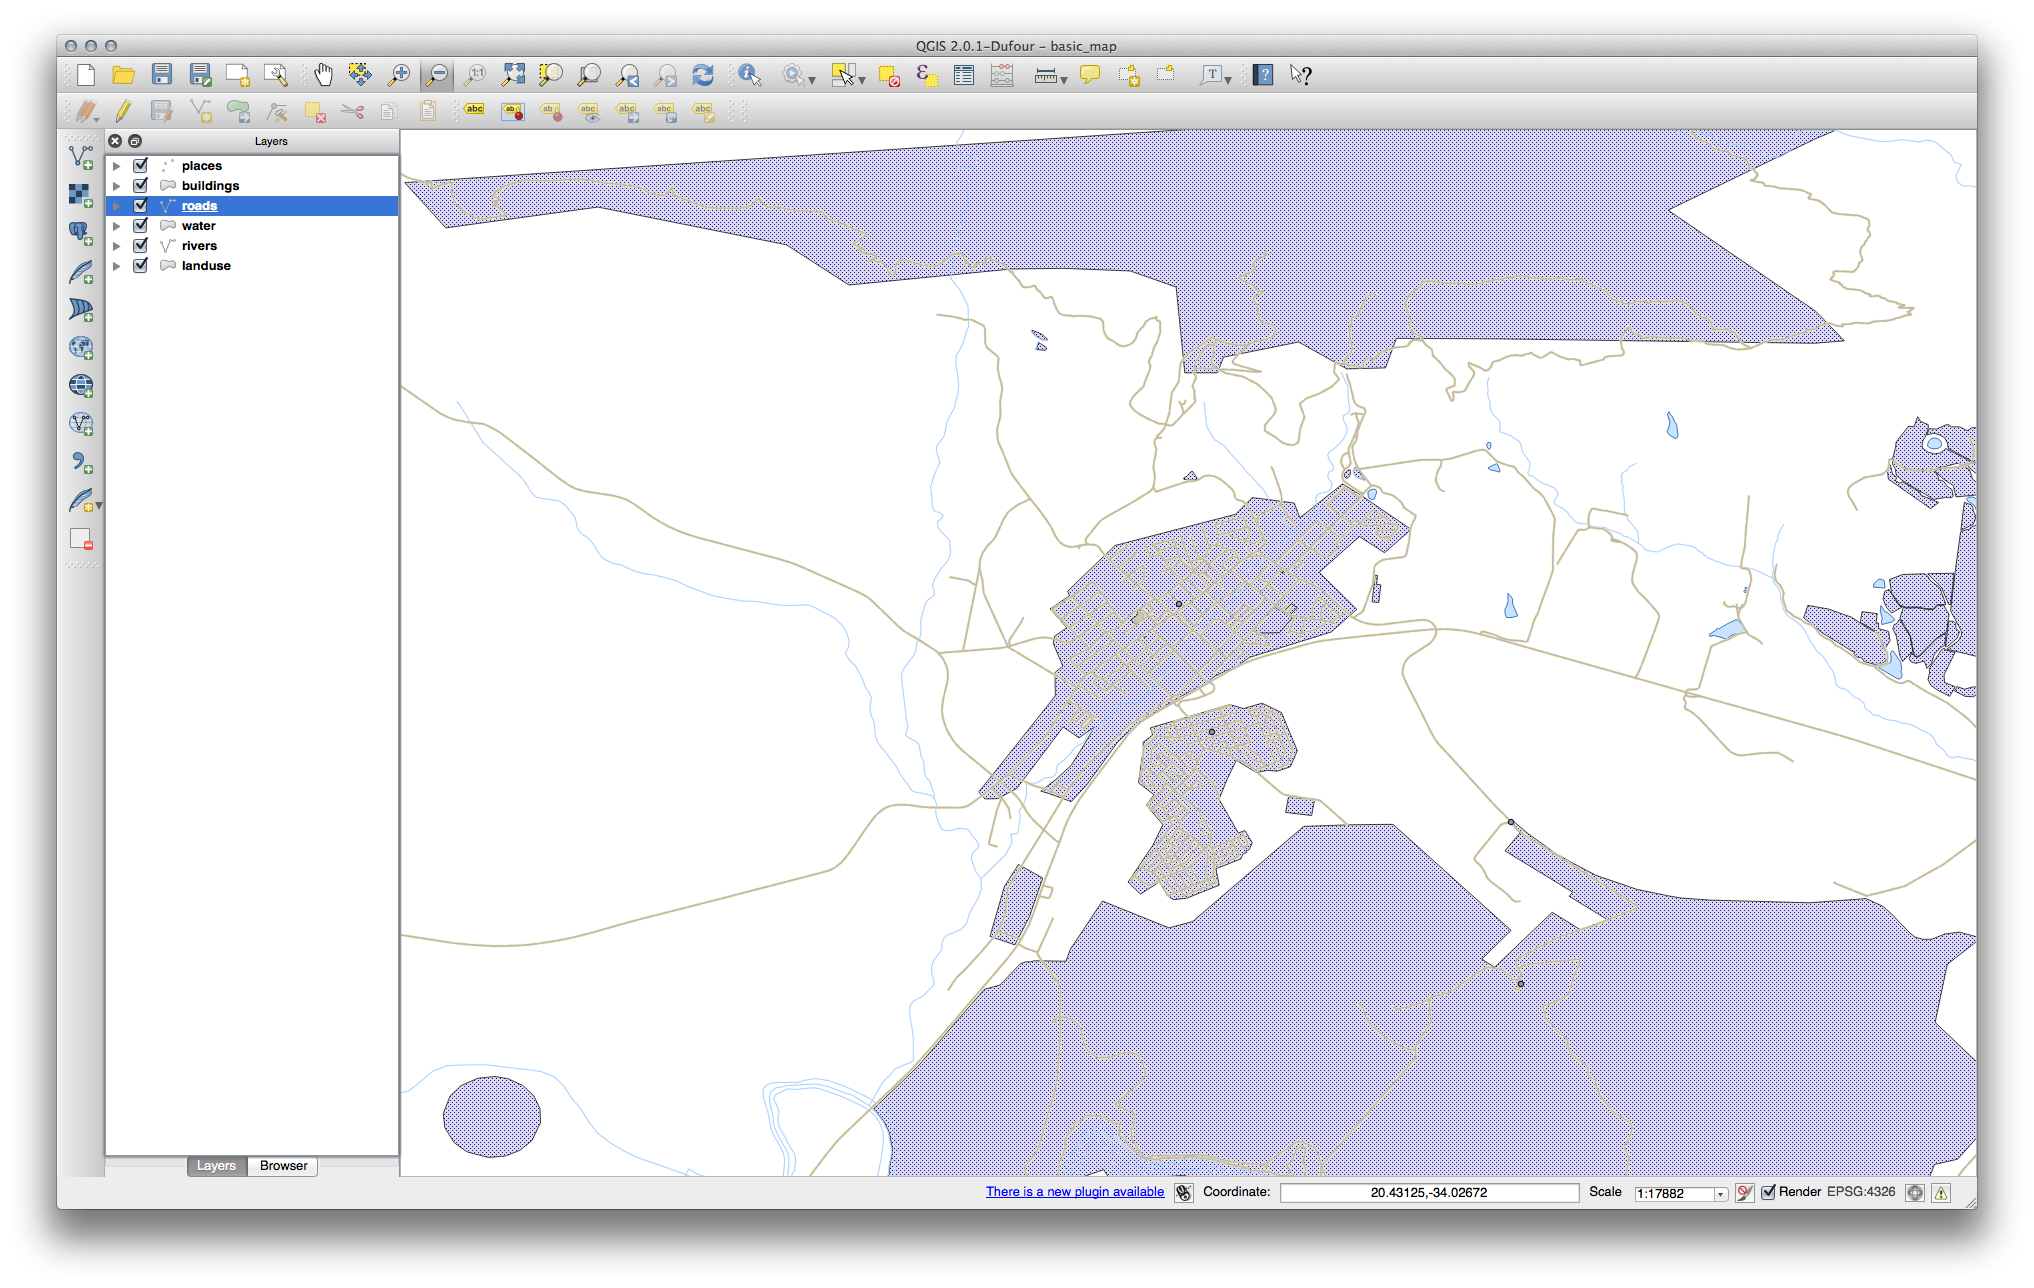
사용자가 원하는 대로 buildings 레이어를 사용자 지정하십시오. 그러나 맵 상에서 서로 다른 레이어를 쉽게 구별할 수 있어야 한다는 사실을 기억하십시오.
다음은 그 예시입니다.
21.4.4. 심볼 수준
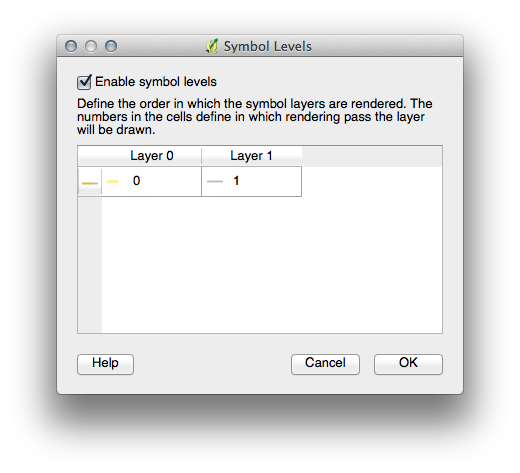
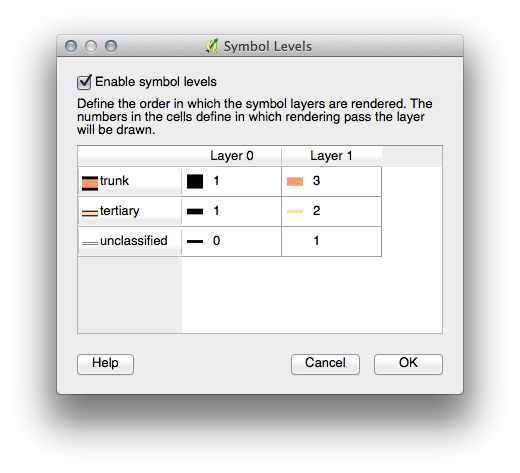
To make the required symbol, you need two symbol layers:
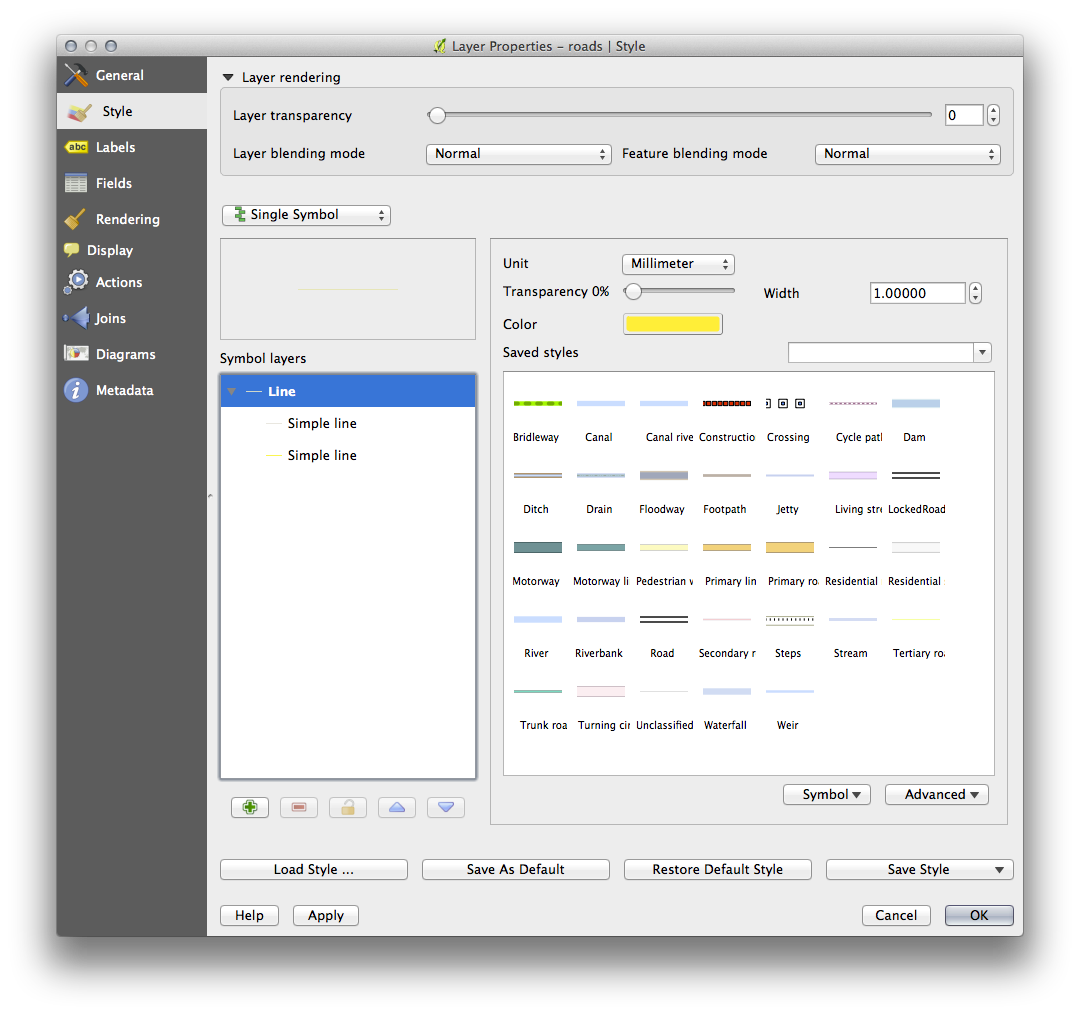
The lowest symbol layer is a broad, solid yellow line. On top of it there is a slightly thinner solid gray line.
If your symbol layers resemble the above but you’re not getting the result you want, check that your symbol levels look something like this:
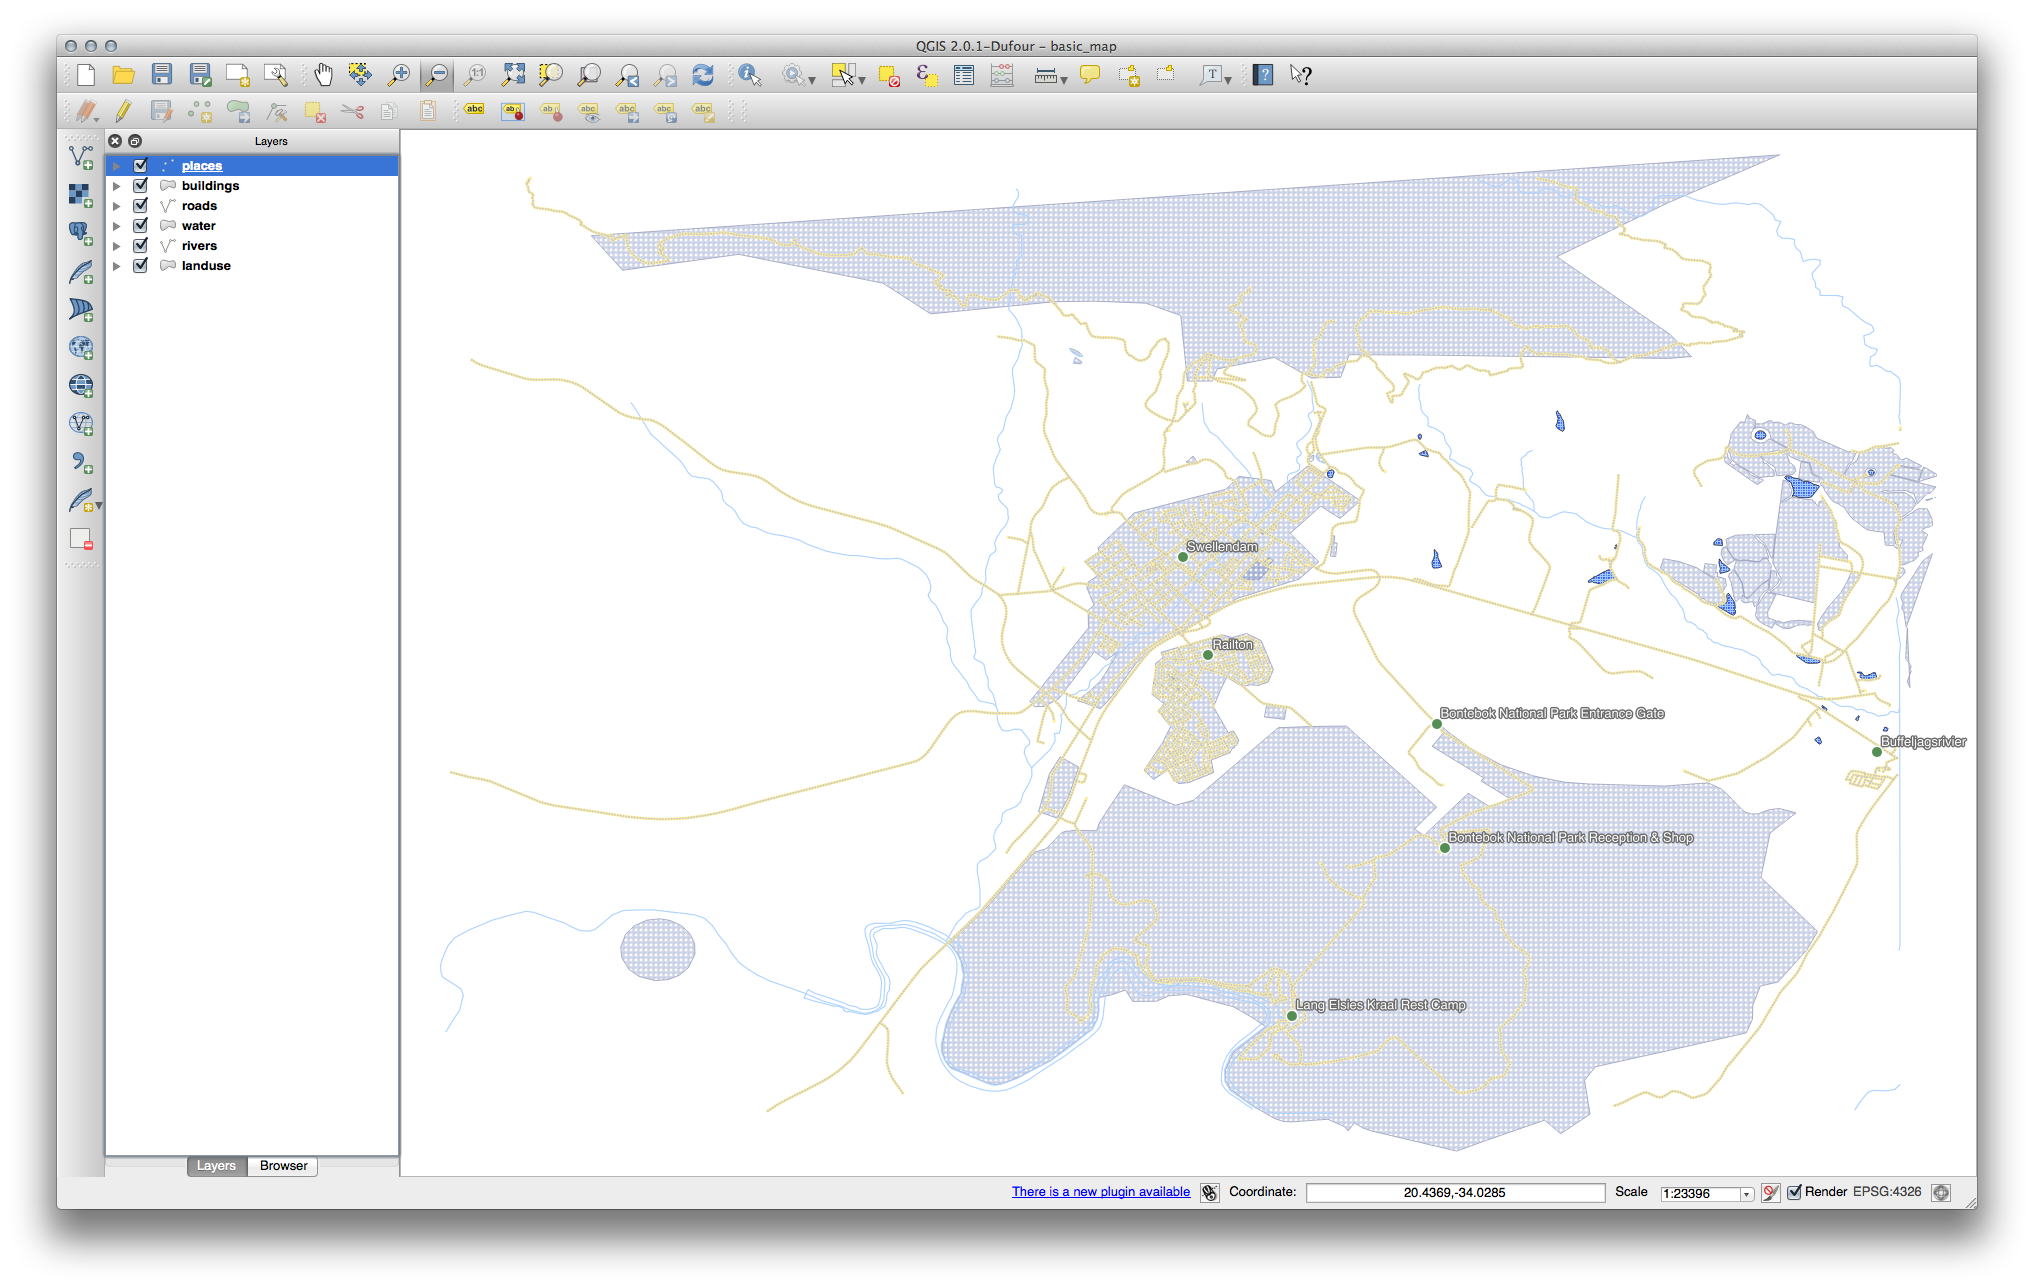
이제 사용자 맵이 이렇게 보여야 합니다.
21.5. Results For 속성 데이터
21.6. Results For 라벨 도구
21.6.1. 사용자 지정 라벨 (Part 1)
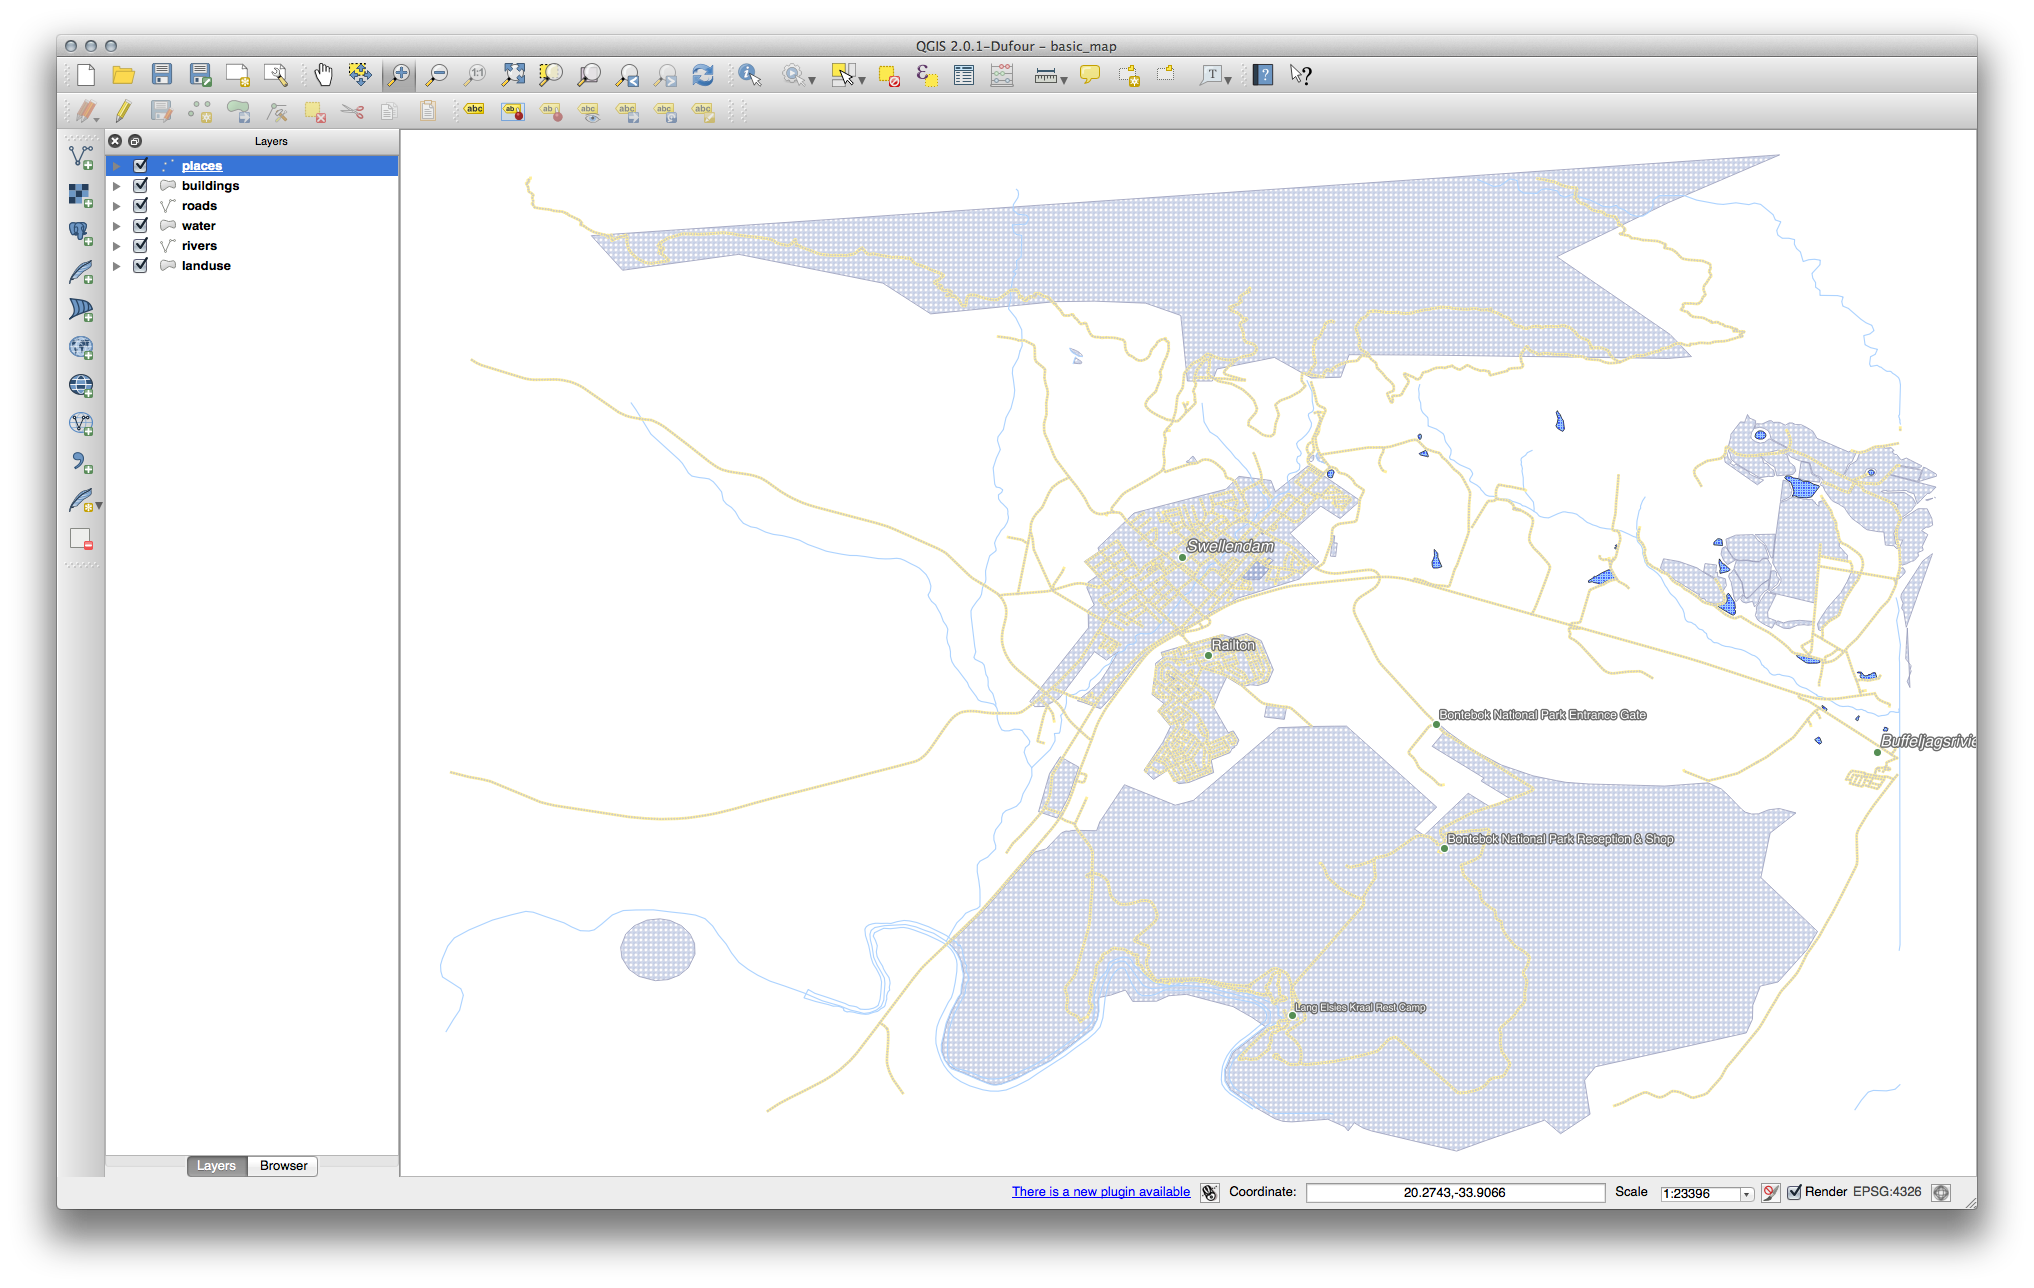
이제 사용자 맵에 마커 포인트가 나타나고 라벨은 2.0 mm 만큼 오프셋되어 있어야 합니다. 마커와 라벨의 스타일이 맵 상에서 둘 다 명확히 보이도록 해야 합니다.
21.6.2. 사용자 지정 라벨 (Part 2)
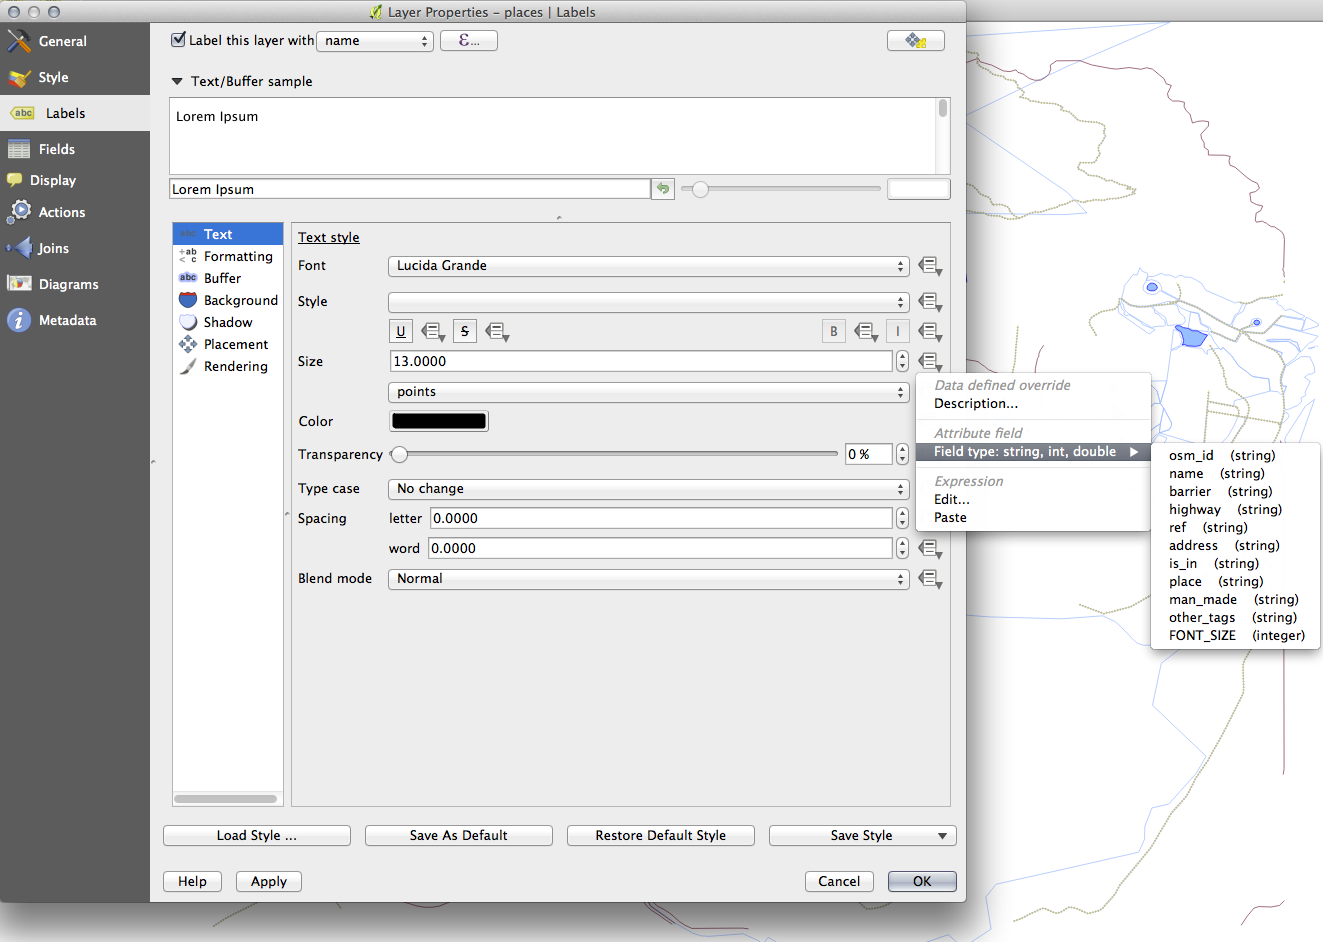
다음 최종 산출물을 생산하는 해법이 있습니다.
이 결과물을 산출하려면,
폰트 크기를 10, Label distance 를 1,5 mm, Symbol width 및 Symbol size 를 3.0 mm 로 설정하십시오.
그리고 이 예시에서 다음 Wrap label on character 옵션을 사용합니다.
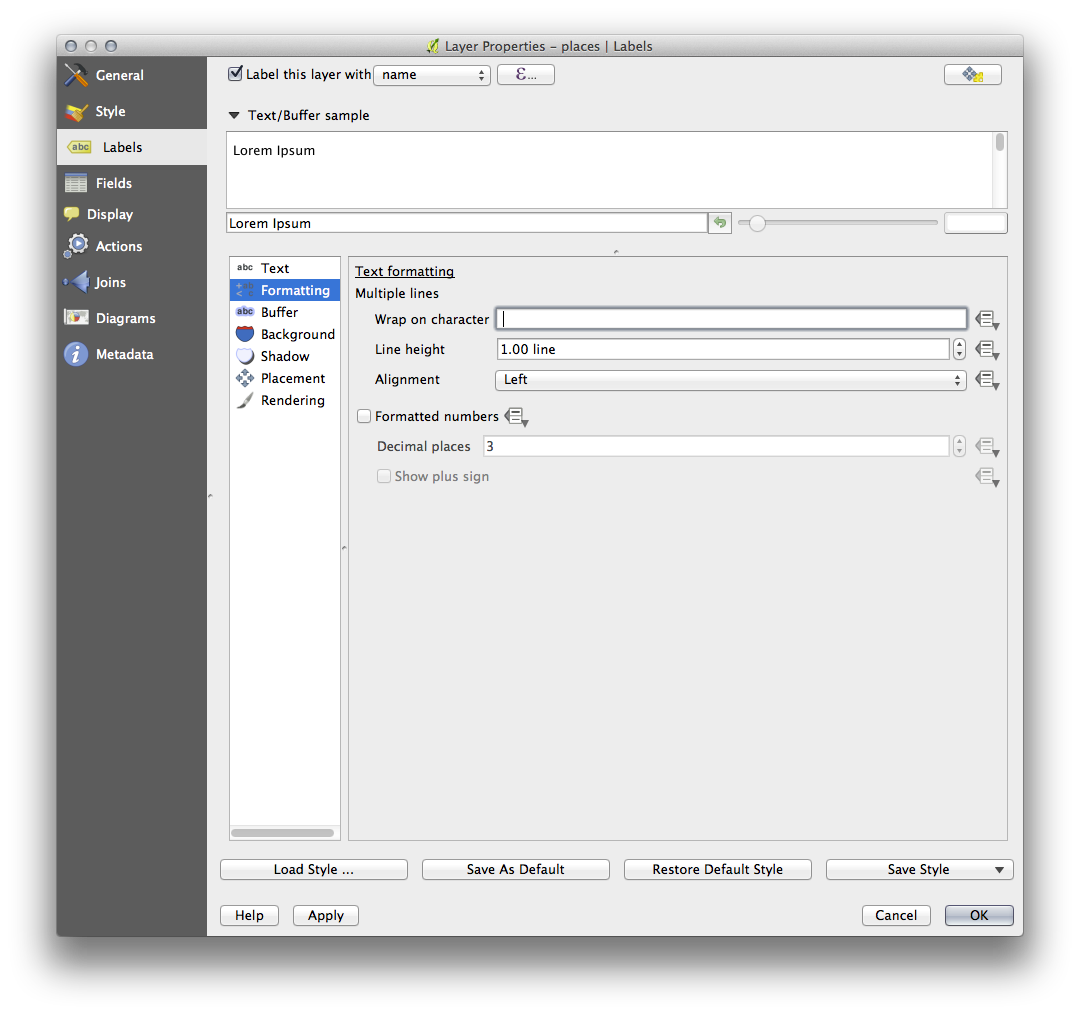
이 항목에 공백 을 입력한 다음 Apply 를 클릭해서 동일한 효과를 내십시오. 이 경우, 일부 지명이 매우 길어 사용자가 식별하기 어려운 여러 줄로 나타날 수도 있습니다. 사용자 맵에 대해서는 이 설정이 더 적합할 수도 있습니다.
21.7. Results For 범주화
21.8. Results For 새 벡터 데이터셋 생성
21.8.2. 위상 : 고리 추가 도구
정확한 모양에 상관 없이, 사용자 피처 가운데에 다음과 같이 구멍이 생겨야 합니다.
다음 도구에 대한 예제를 해보기 전에 편집 내용을 되돌리십시오.
21.8.3. 위상 : 부분 추가 도구
먼저 Bontebok National Park 를 선택하십시오.
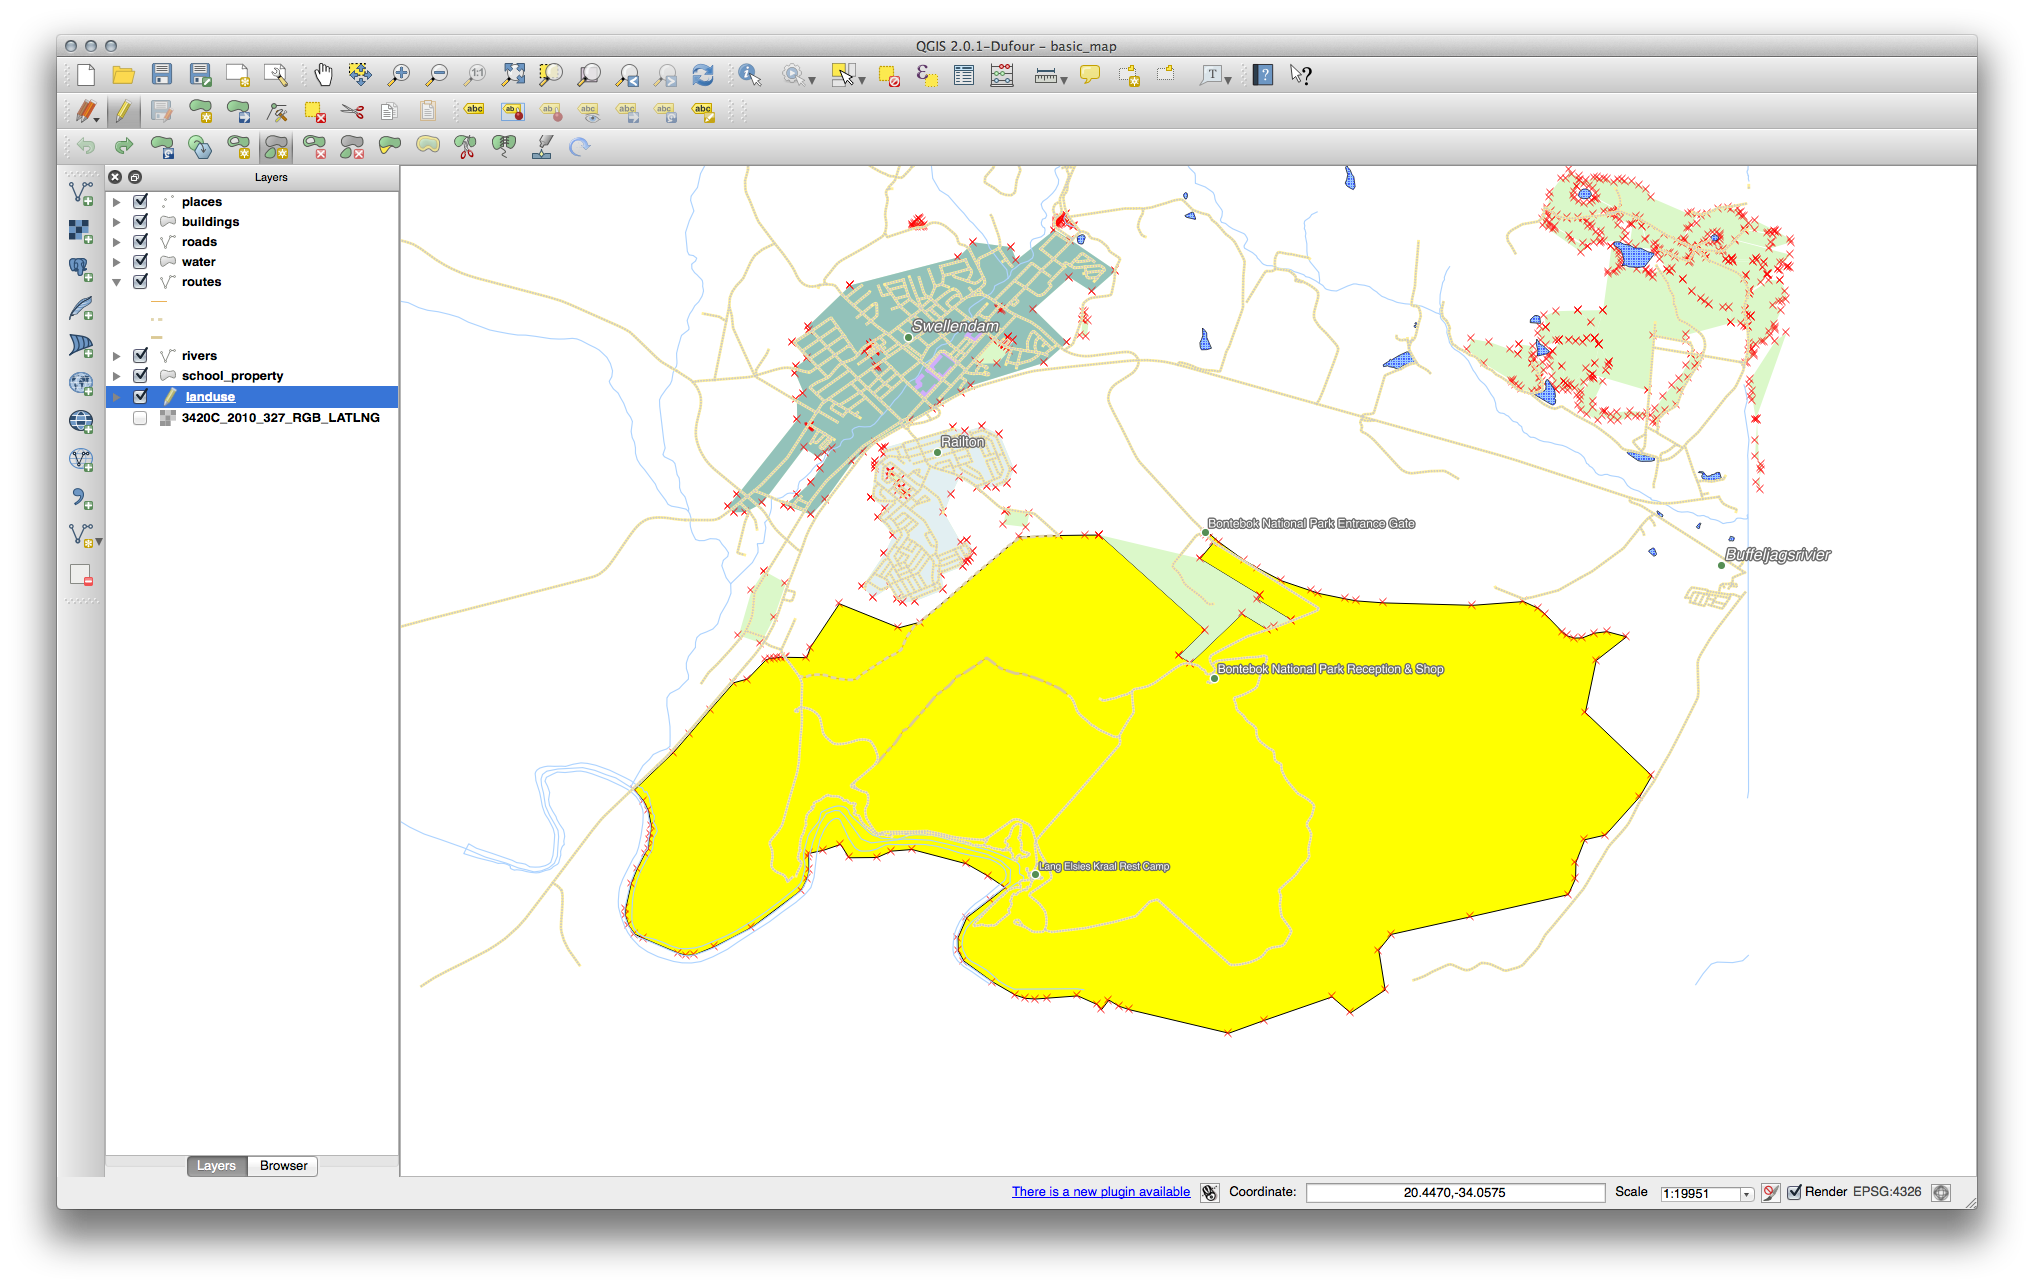
새 부분을 추가하십시오.
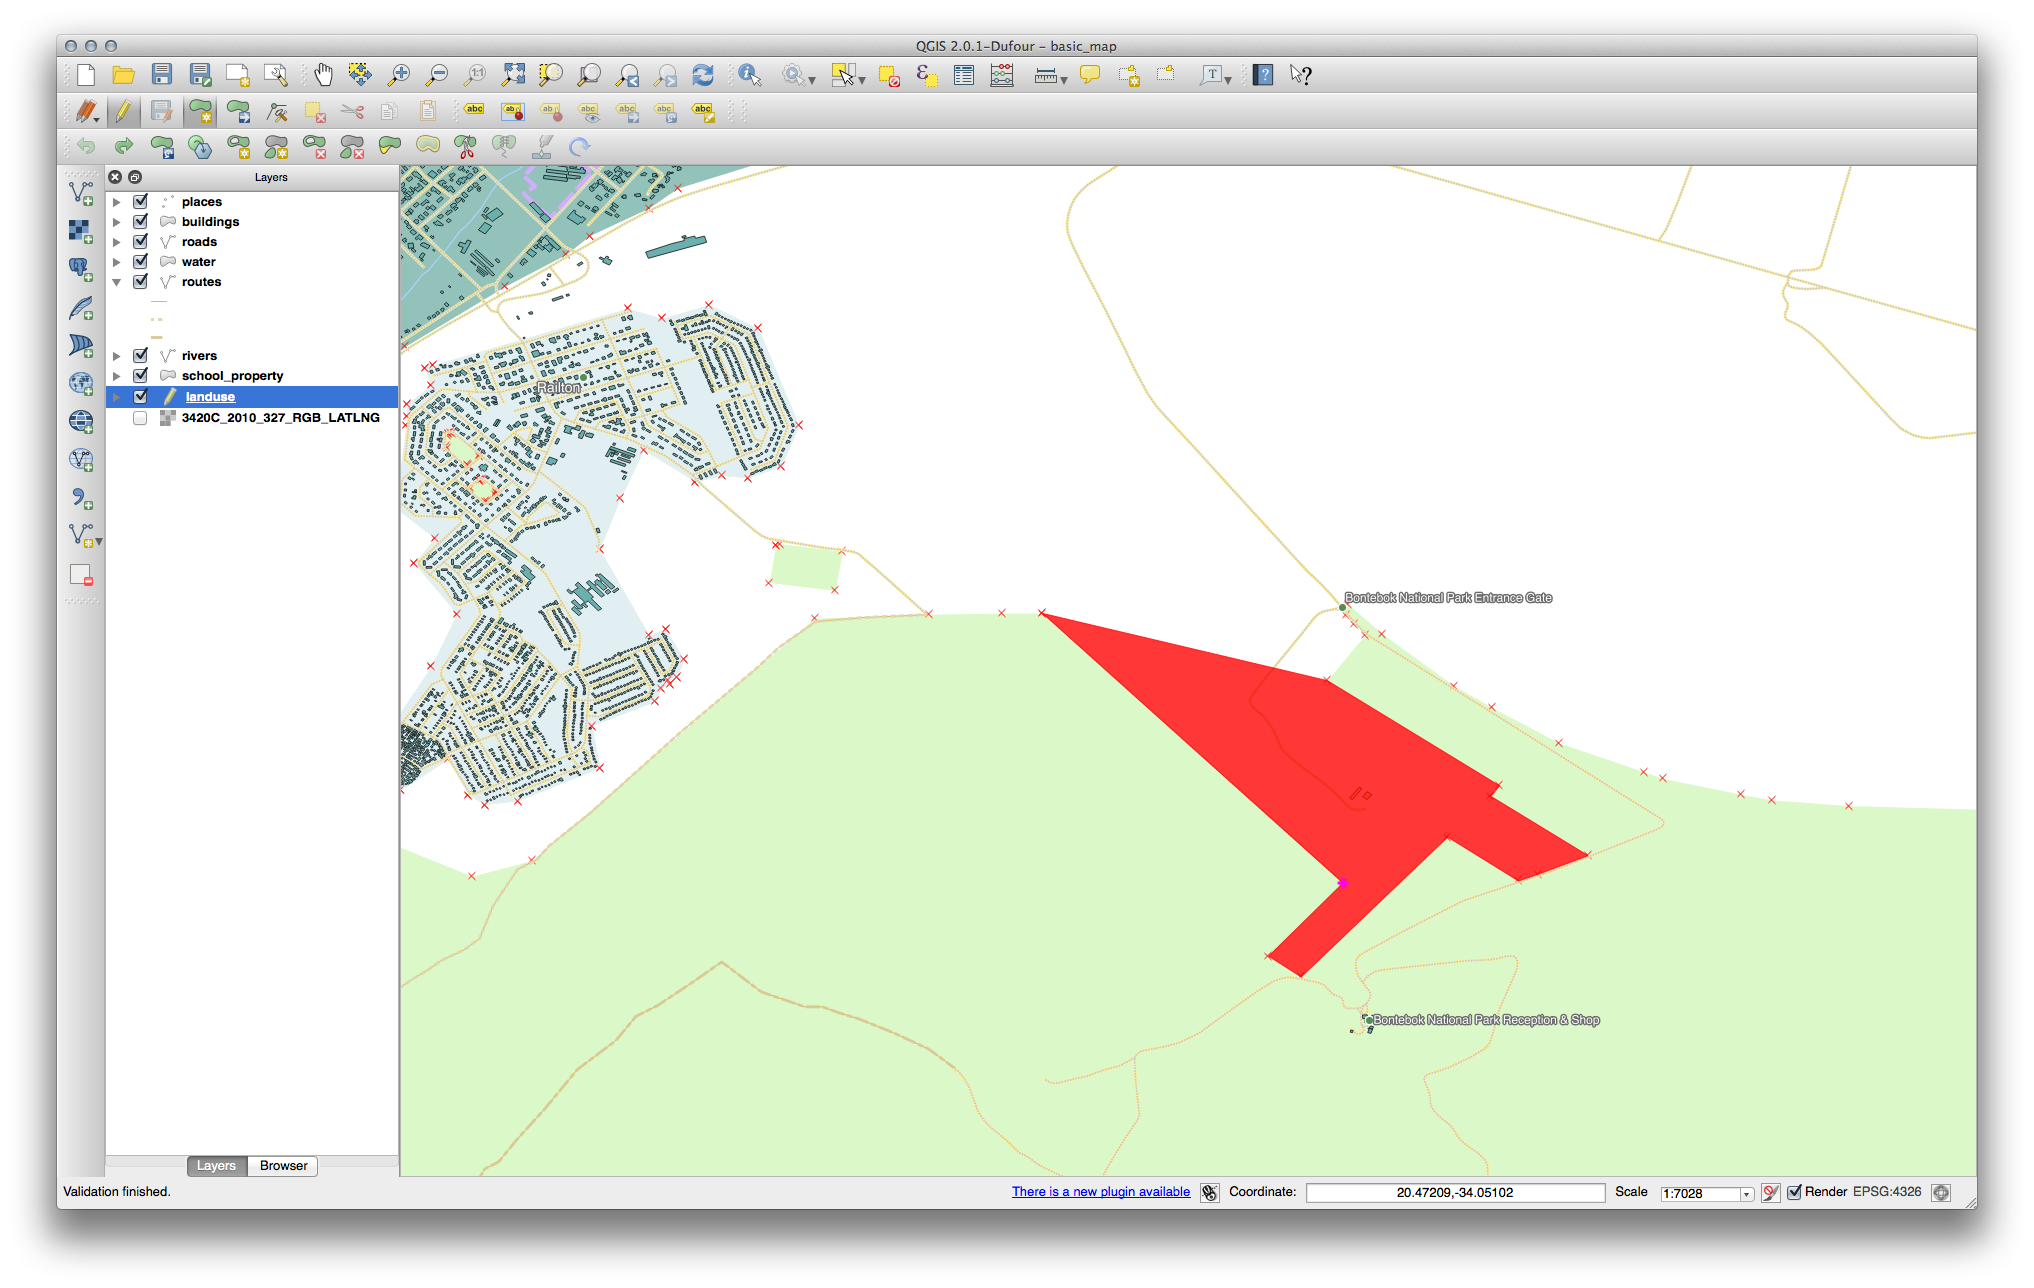
다음 도구에 대한 예제를 해보기 전에 편집 내용을 되돌리십시오.
21.8.4.  피처 합치기
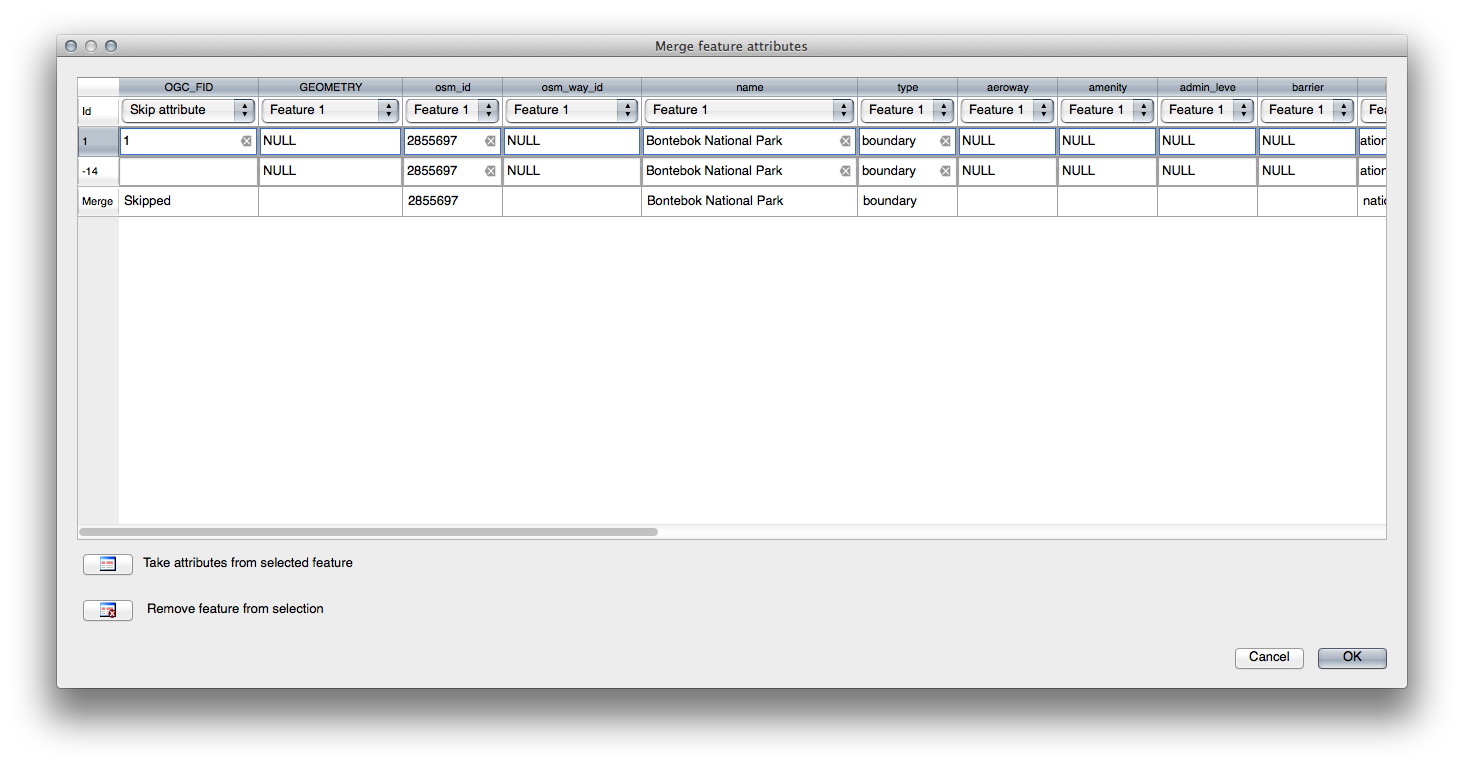
Merge Selected Features 도구를 이용, 먼저 사용자가 합치고자 하는 폴리곤을 둘 다 선택하도록 하십시오.
사용자 속성의 소스로 OGC_FID 를 1 로 설정해서 피처를 사용하십시오. (대화 창에서 해당 항목을 클릭한 다음, Take attributes from selected feature 버튼을 클릭하십시오.)
주석
- 다른 데이터셋을 사용할 경우,
사용자의 원래 폴리곤의 OGC_FID 값이 1 이 아닐 가능성이 높습니다. 그냥 OGC_FID 항목을 갖추고 있는 피처를 선택하십시오.
주석
Merge Attributes of Selected Features 도구를 사용하면 계속 도형들을 구분할 수 있지만, 동일한 속성을 부여할 것입니다.
21.8.5. 서식
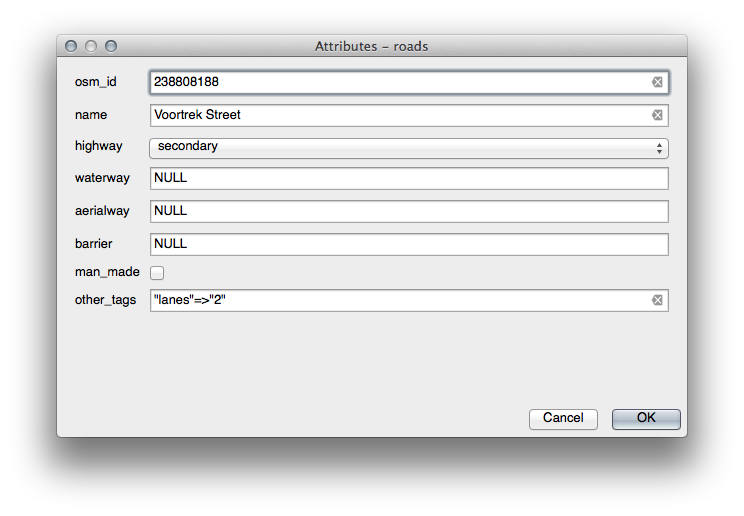
TYPE 의 경우, 도로가 가질 수 있는 유형은 분명히 제한되어 있습니다. 이 레이어의 속성 테이블을 확인해보면, 이미 유형이 정의되어 있다는 사실을 알 수 있습니다.
위젯을 Value Map 으로 설정하고 Load Data from Layer 를 클릭하십시오.
Label 드롭다운 메뉴에서 roads 를 선택하고, Value 및 Description 에 대해 모두 highway 를 선택하십시오.
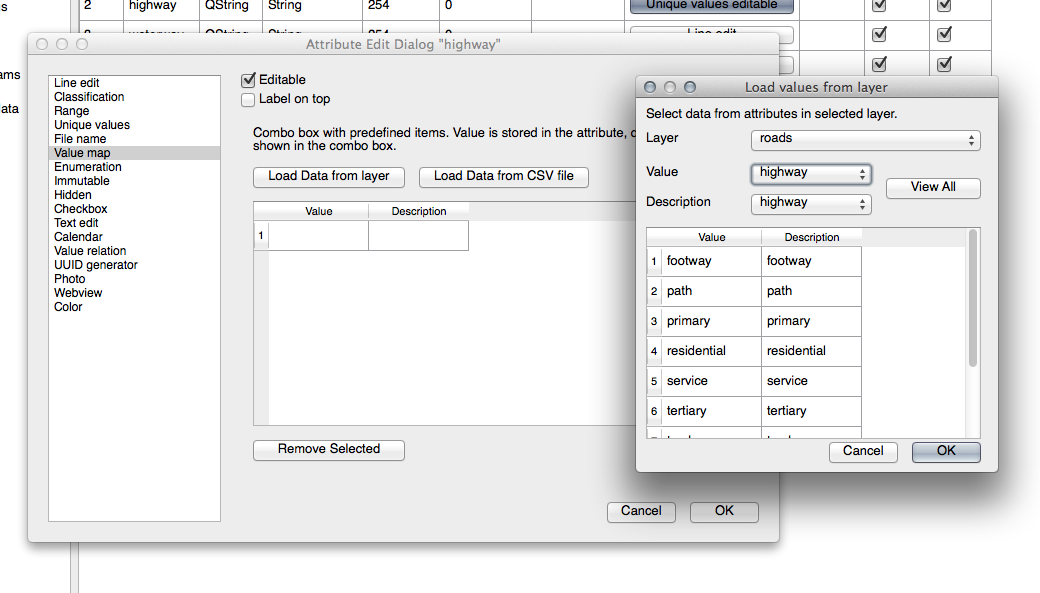
OK 를 세 번 클릭합니다.
이제 편집 모드에 들어간 상태에서 도로에 대해 Identify 도구를 사용해보면, 다음과 같은 대화 창이 나타날 것입니다.
21.9. Results For 벡터 분석
21.9.1. Extract Your Layers from OSM Data
For the purpose of this exercise, the OSM layers which we are interested in are multipolygons and lines. The multipolygons layer contains the data we need in order to produce the houses, schools and restaurants layers. The lines layer contains the roads dataset.
The Query Builder is found in the layer properties:
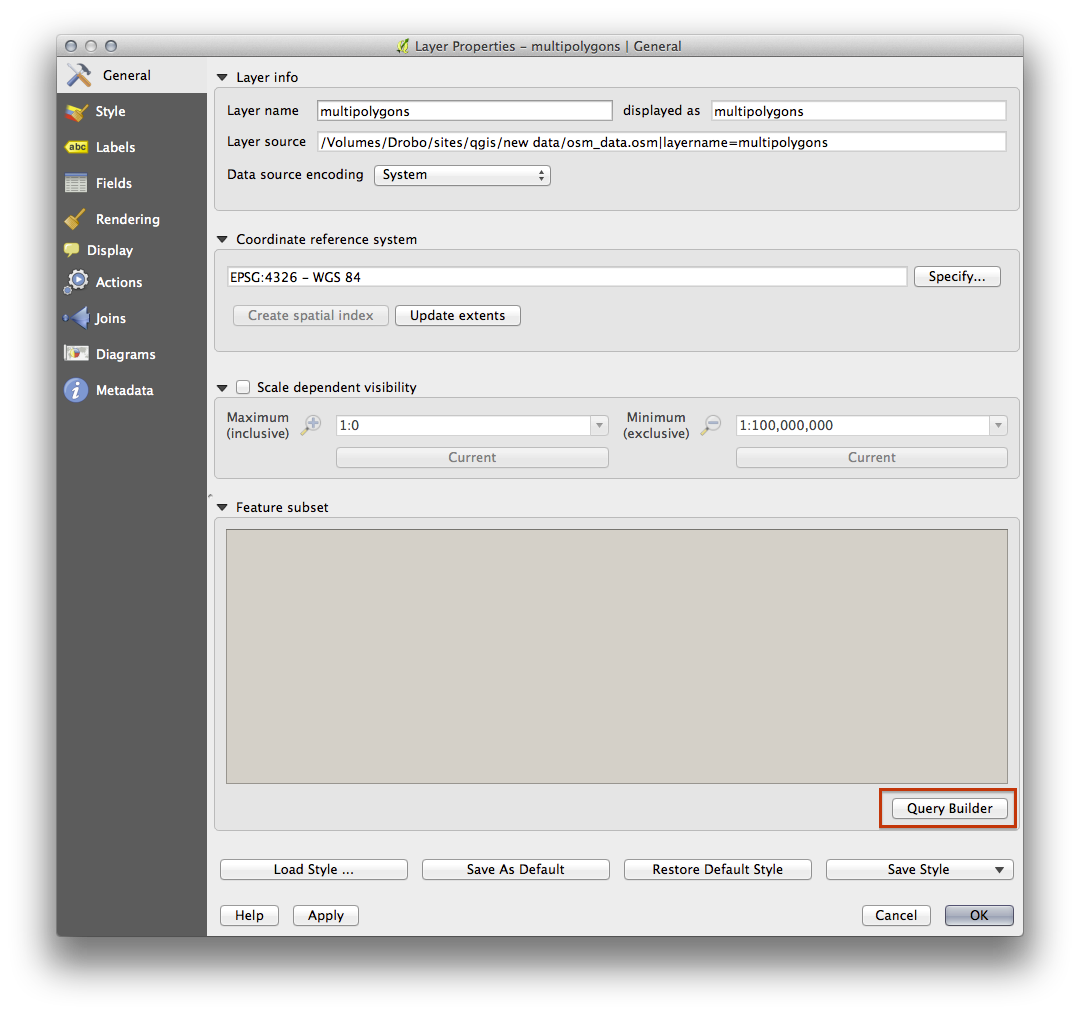
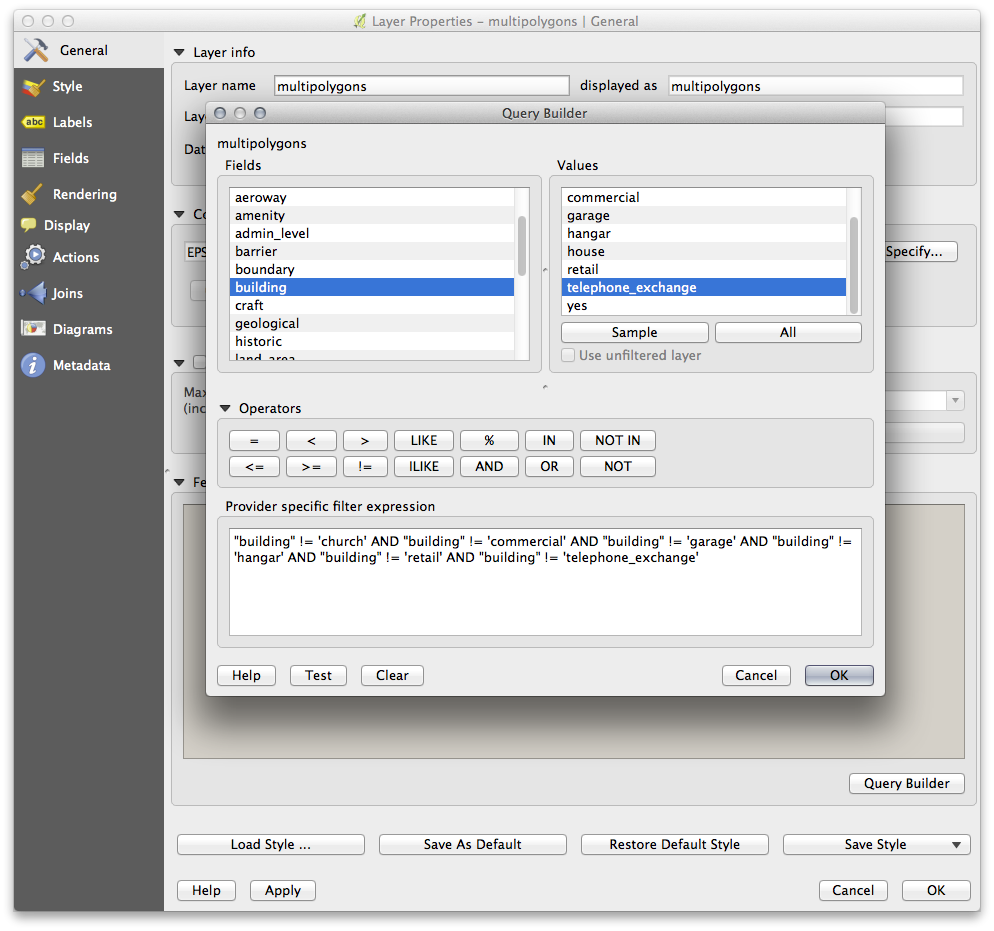
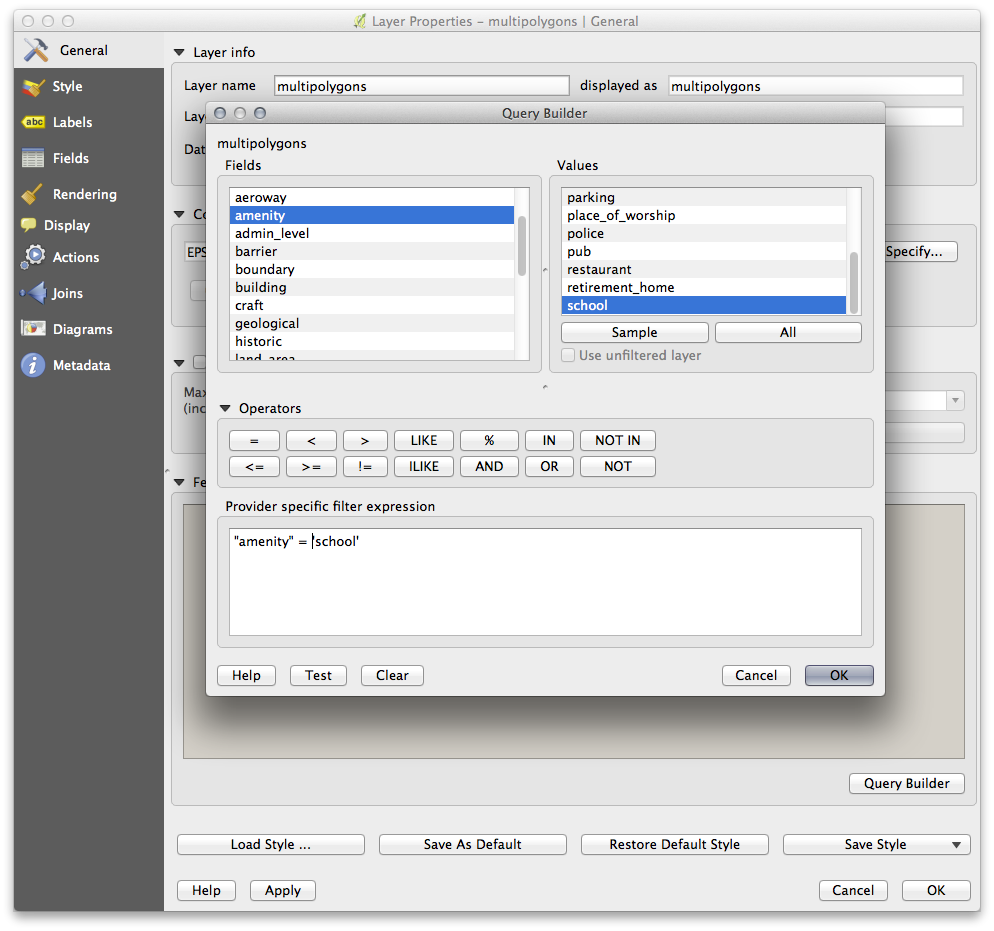
Using the Query Builder against the multipolygons layer, create the following queries for the houses, schools, restaurants and residential layers:
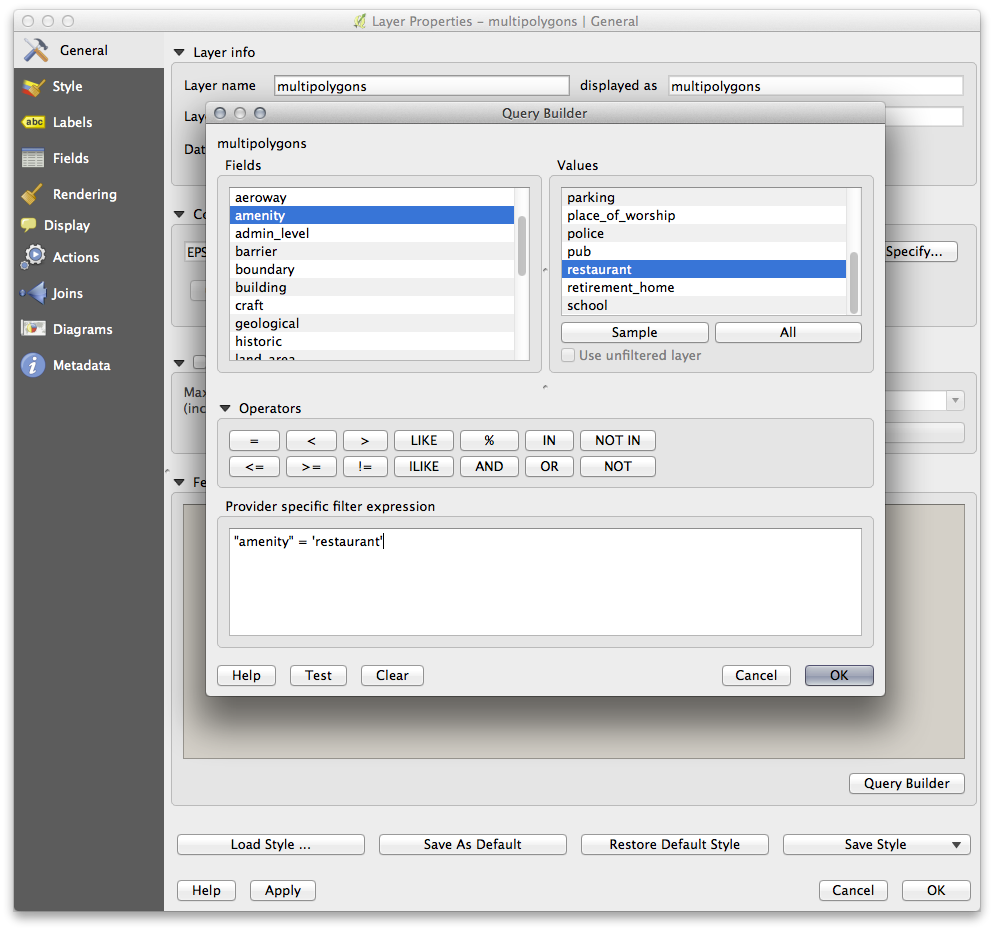
Once you have entered each query, click OK. You’ll see that the map updates to show only the data you have selected. Since you need to use again the multipolygons data from the OSM dataset, at this point, you can use one of the following methods:
- Rename the filtered OSM layer and re-import the layer from osm_data.osm, OR
- Duplicate the filtered layer, rename the copy, clear the query and create your new query in the Query Builder.
주석
Although OSM’s building field has a house value, the coverage in your area - as in ours - may not be complete. In our test region, it is therefore more accurate to exclude all buildings which are defined as anything other than house. You may decide to simply include buildings which are defined as house and all other values that have not a clear meaning like yes.
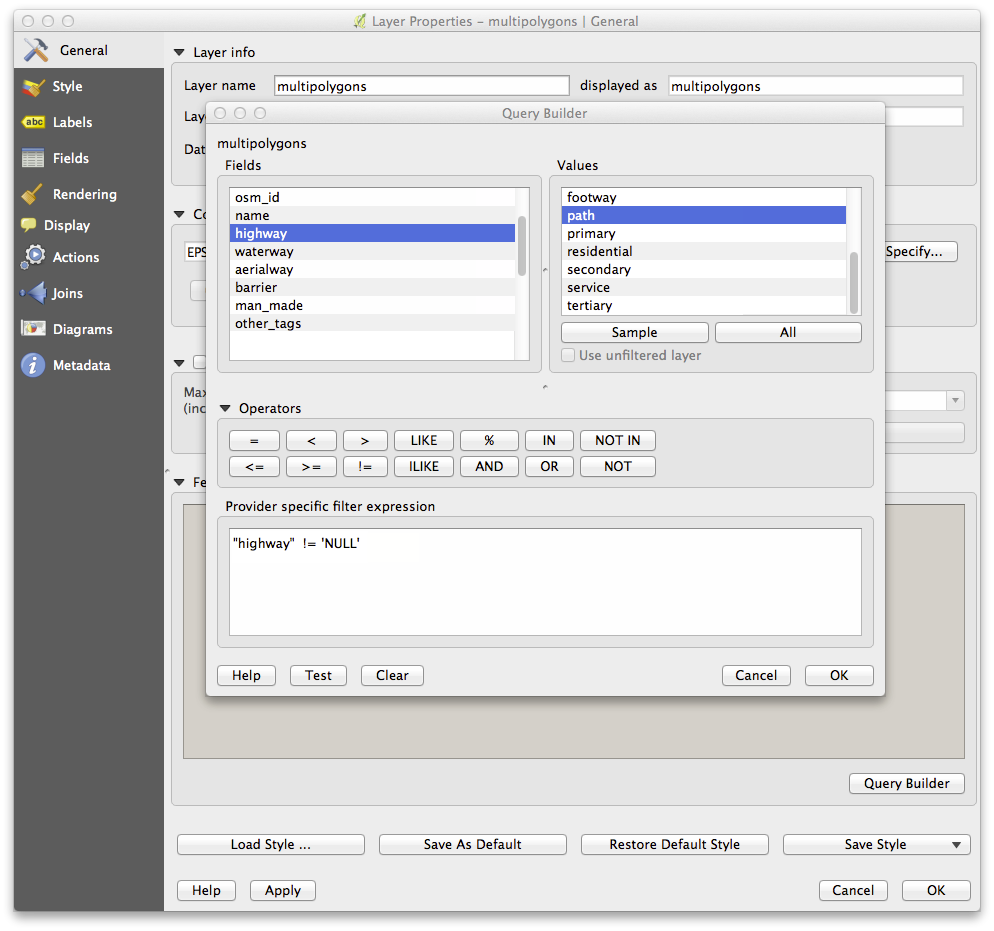
To create the roads layer, build this query against OSM’s lines layer:
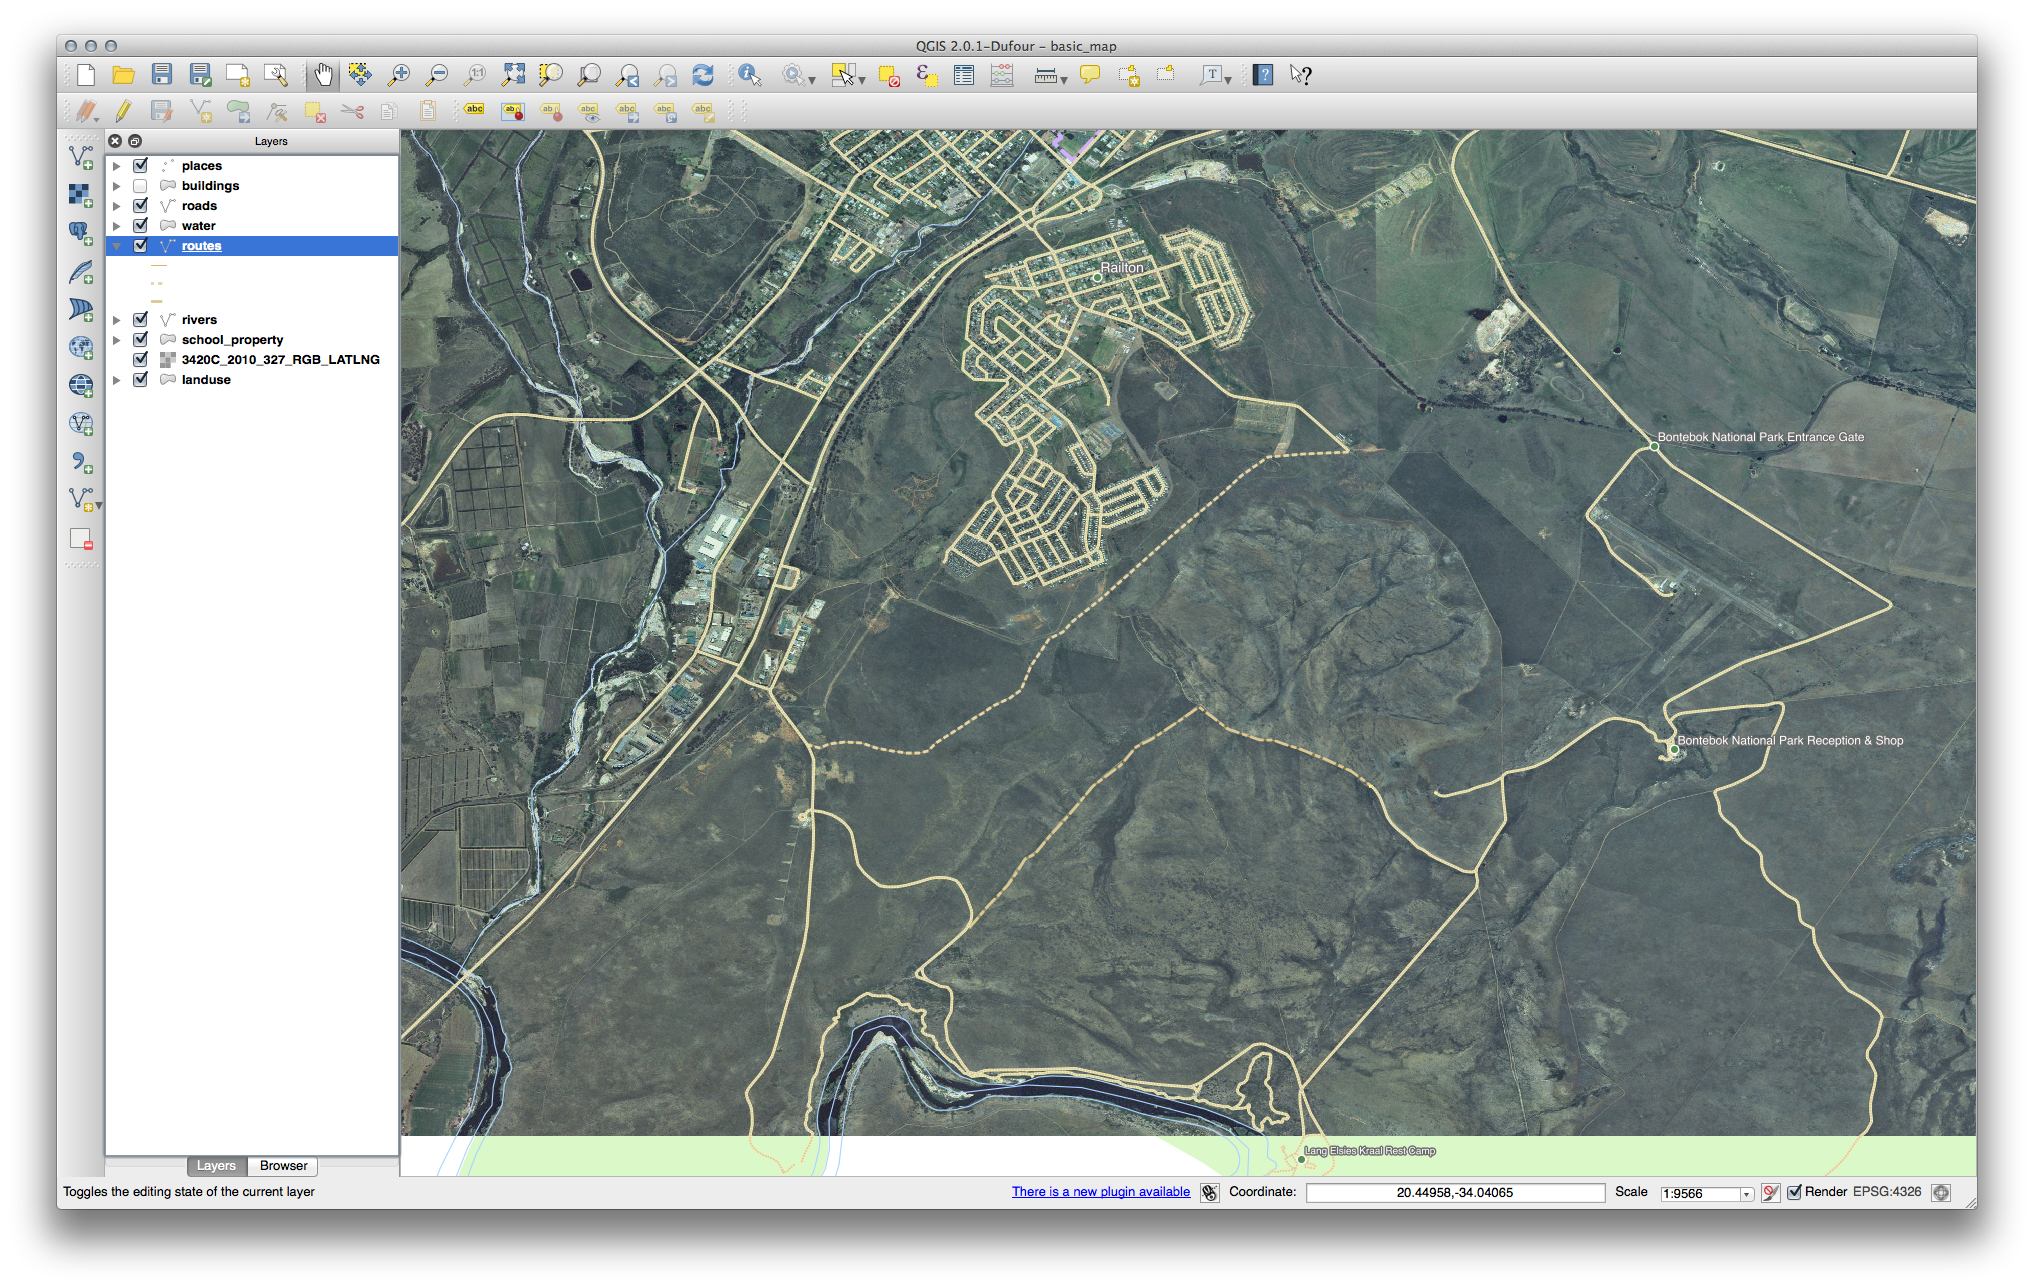
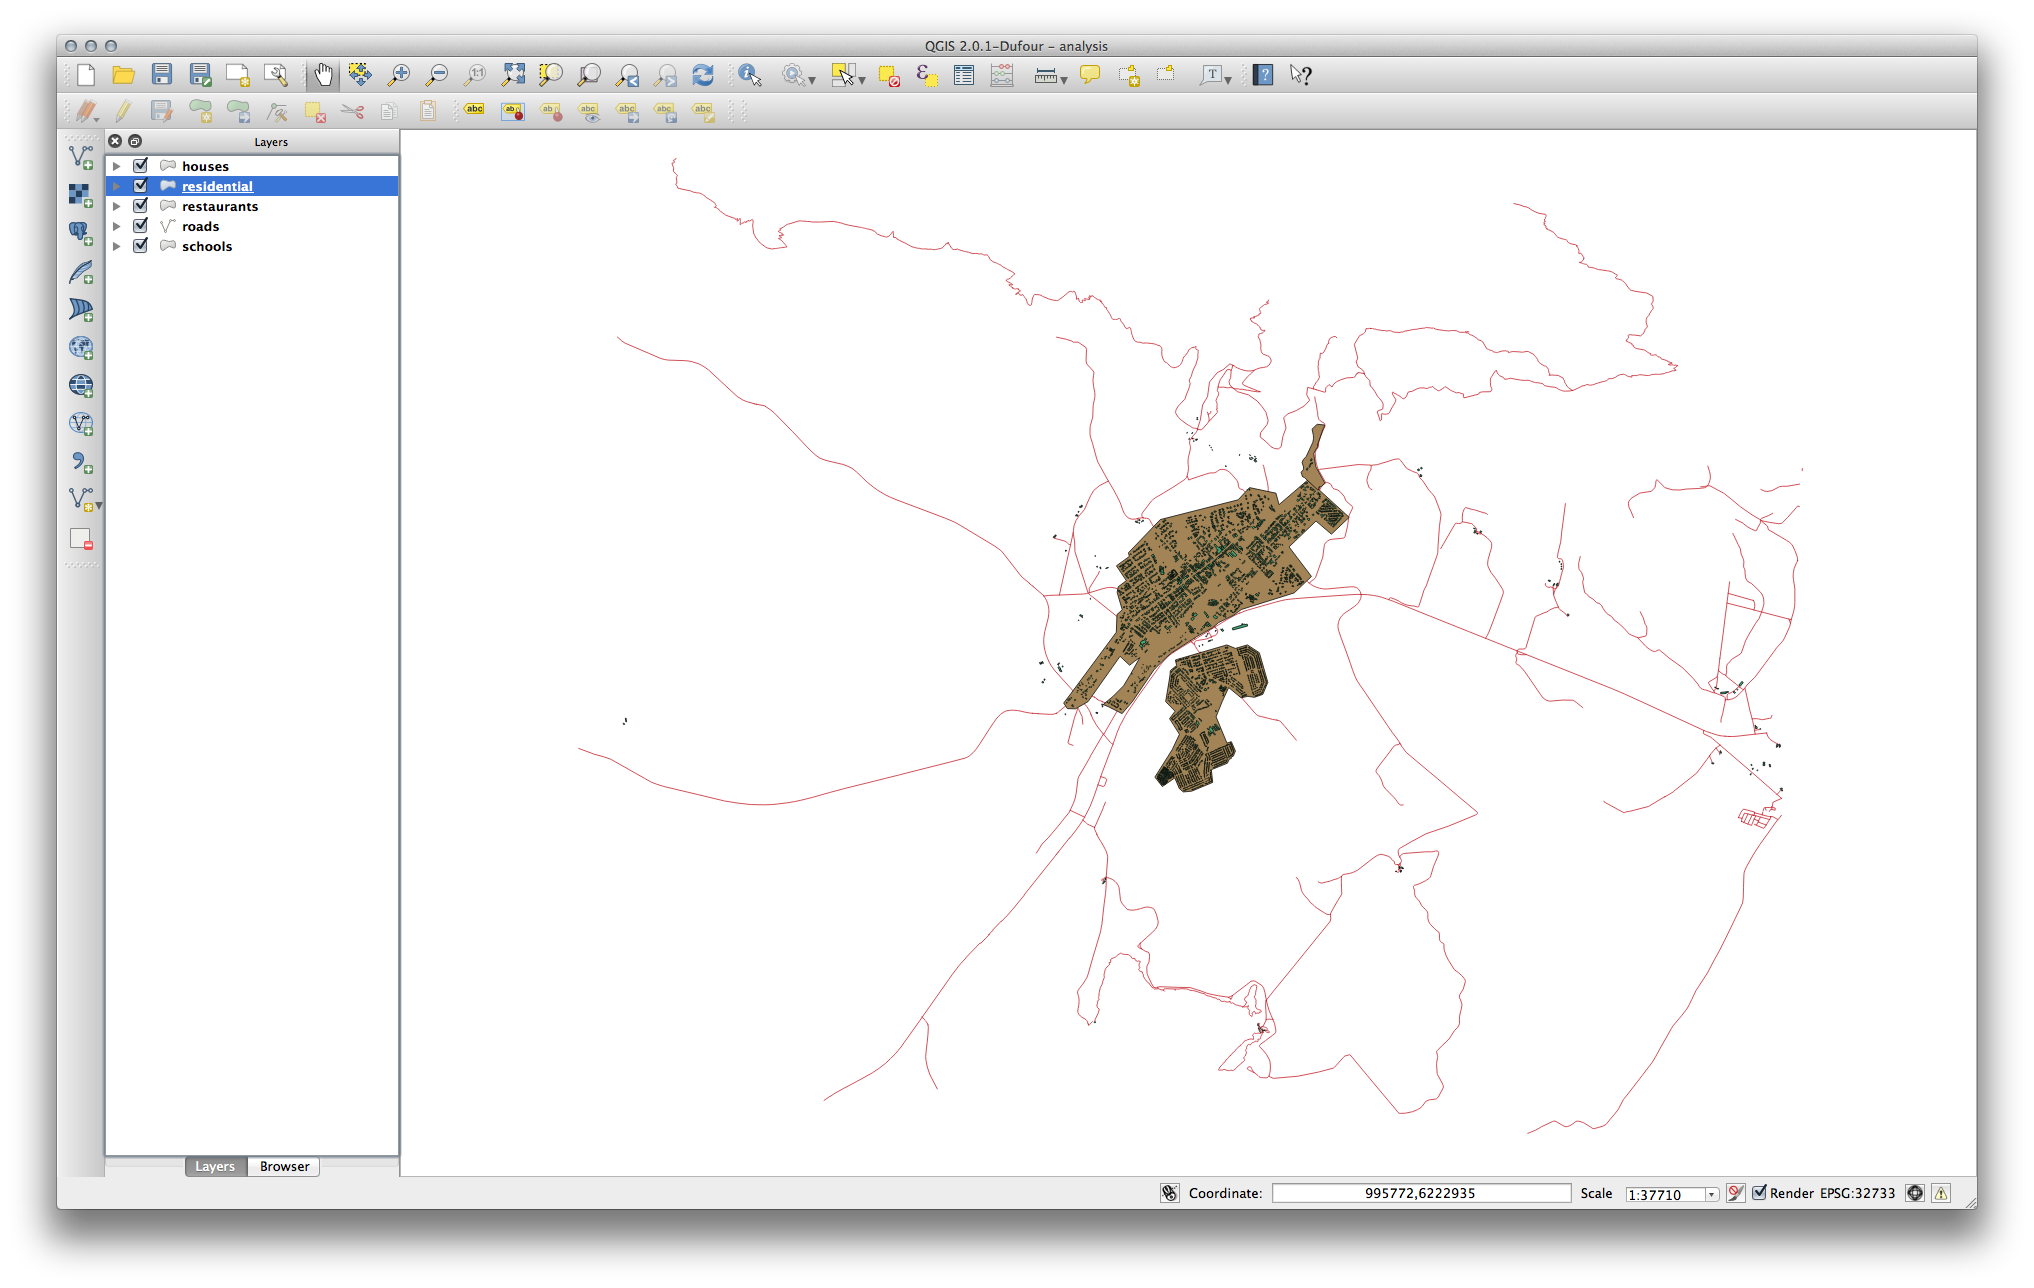
You should end up with a map which looks similar to the following:
21.9.2. 고등학교로부터의 거리
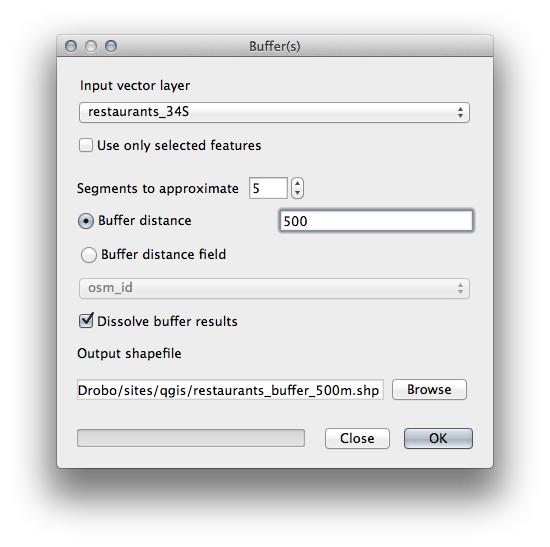
버퍼 대화 창이 다음과 같이 보여야 합니다.
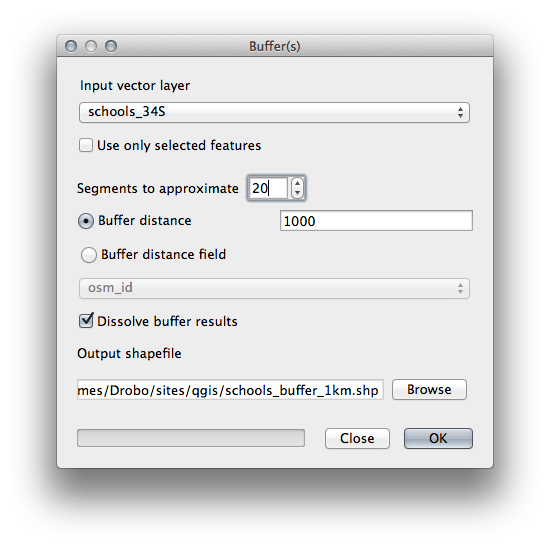
The Buffer distance is 1000 meters (i.e., 1 kilometer).
The Segments to approximate value is set to 20. This is optional, but it’s recommended, because it makes the output buffers look smoother. Compare this:
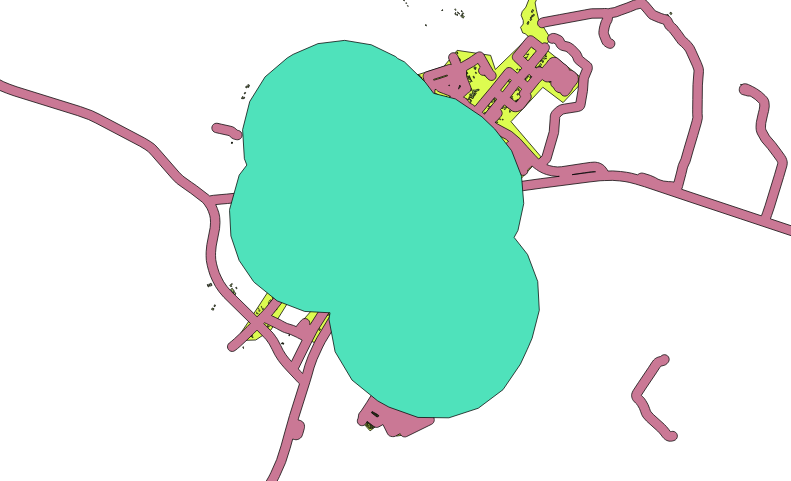
이 그림과 비교해 보십시오.
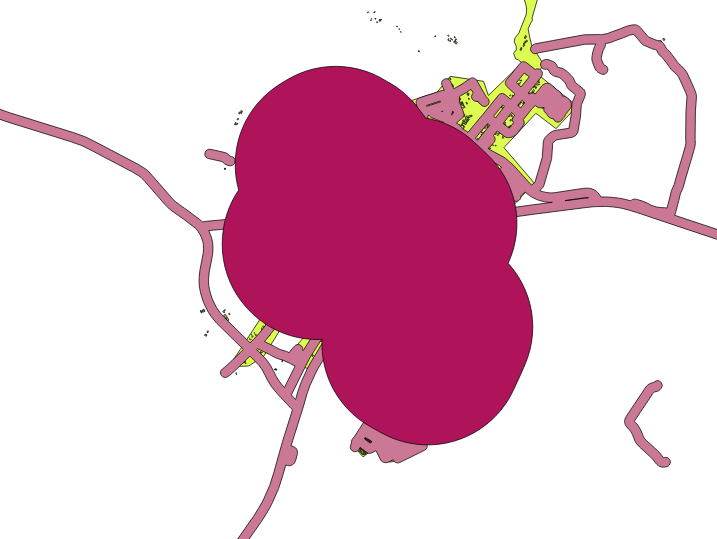
The first image shows the buffer with the Segments to approximate value set to 5 and the second shows the value set to 20. In our example, the difference is subtle, but you can see that the buffer’s edges are smoother with the higher value.
21.9.3. 식당으로부터의 거리
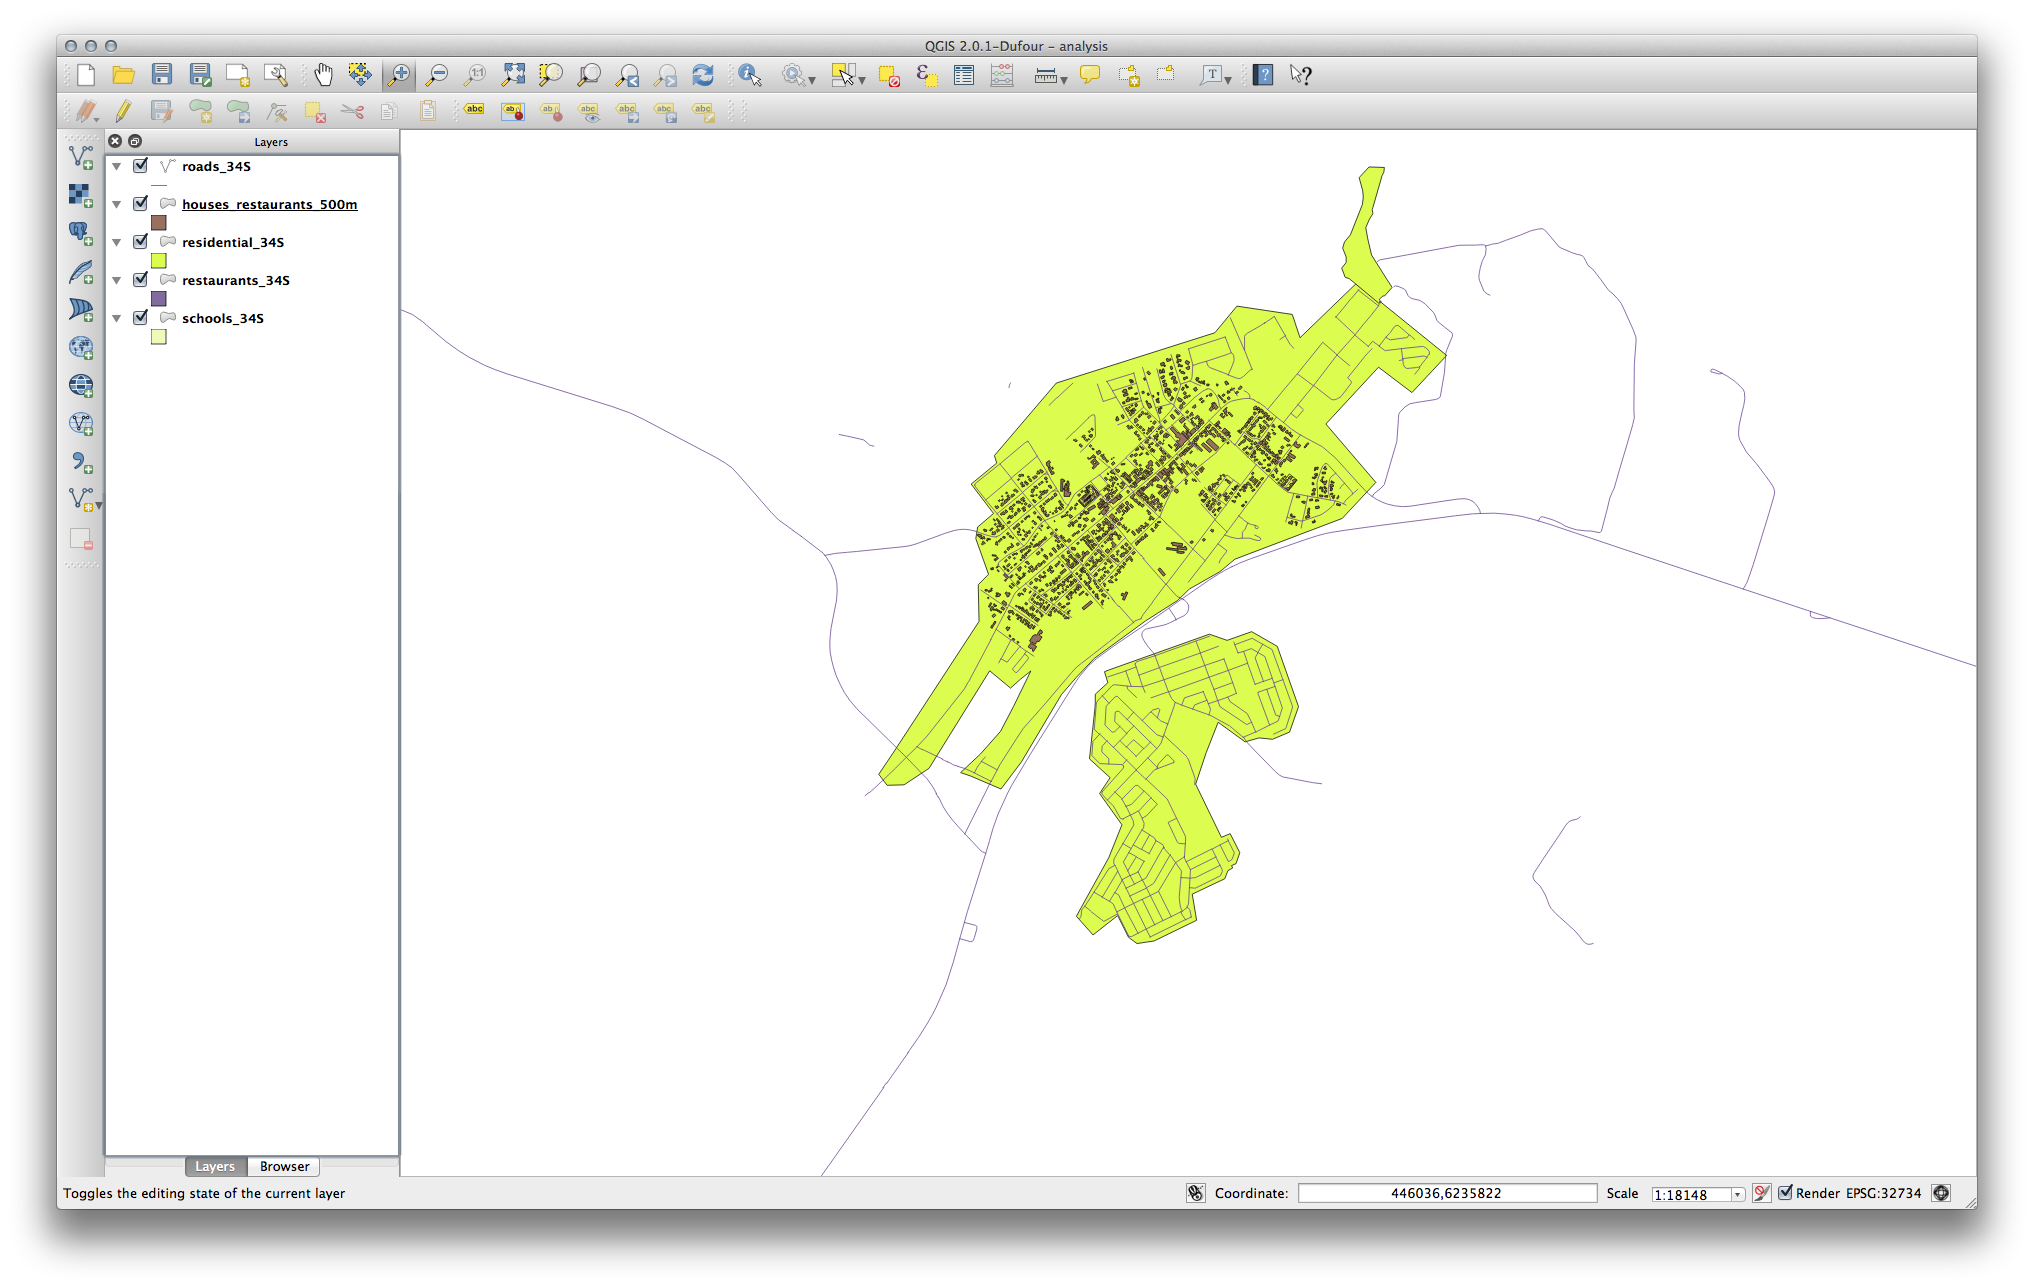
To create the new houses_restaurants_500m layer, we go through a two step process:
먼저, 다음과 같이 식당 주위에 500미터의 버퍼를 생성하고 레이어를 맵에 추가합니다.
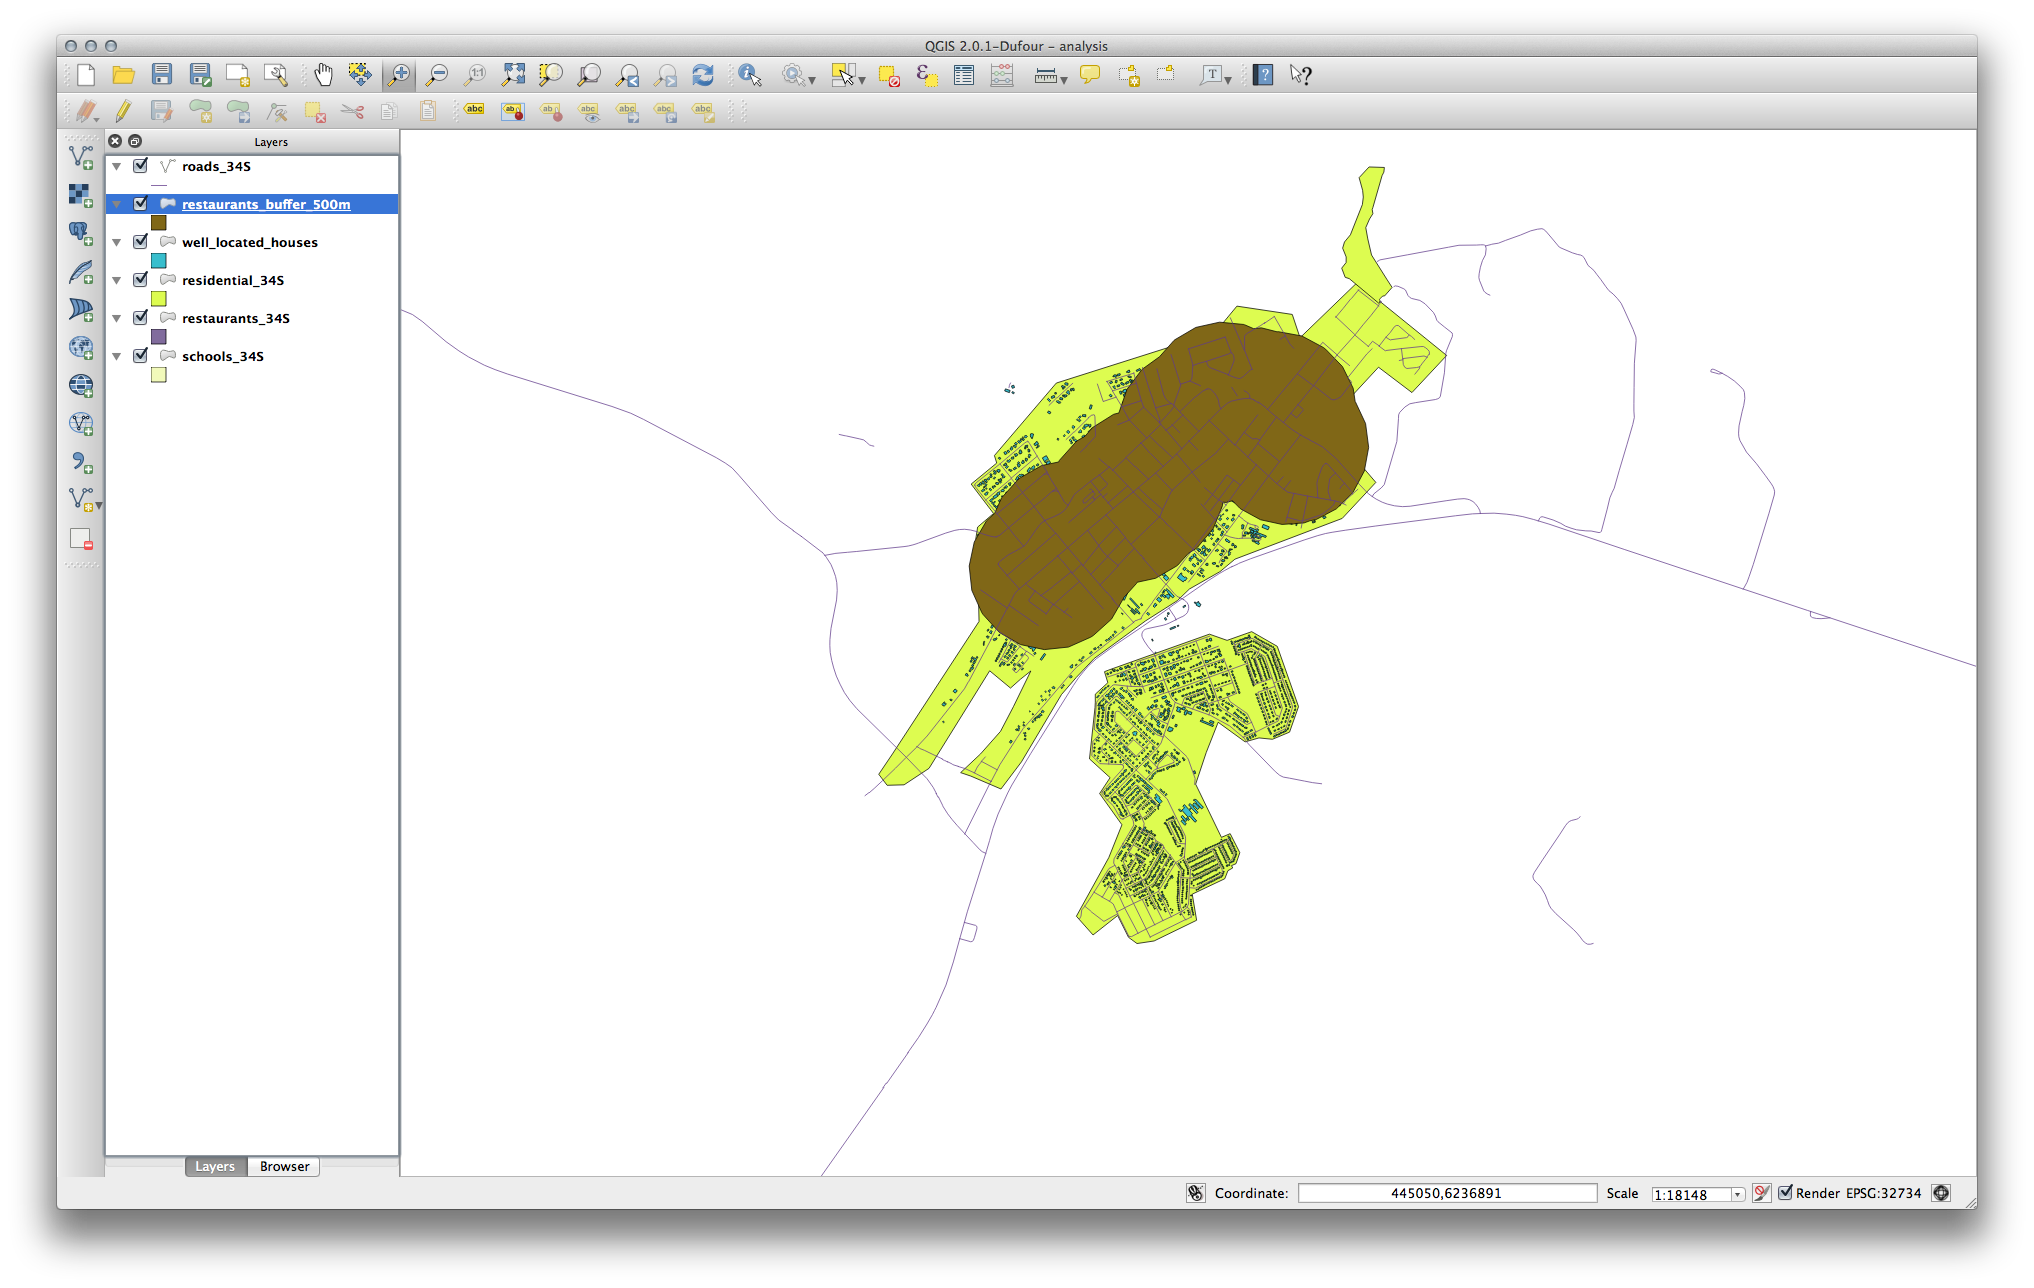
Next, select buildings within that buffer area:
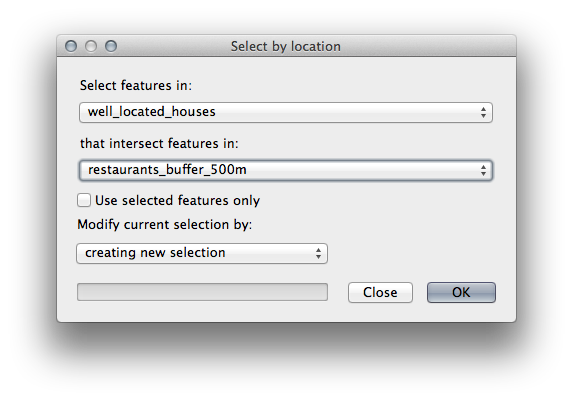
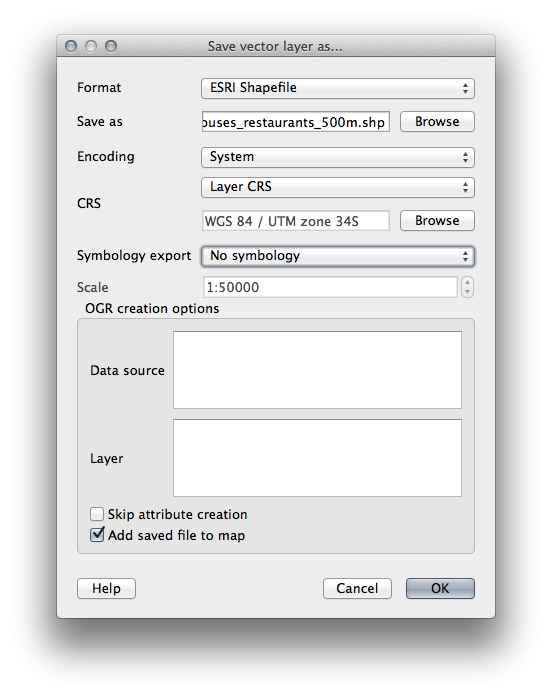
Now save that selection to our new houses_restaurants_500m layer:
이제 사용자 맵에 도로에서 50미터, 학교에서 1킬로미터, 식당에서 500미터 이내에 있는 건물들만 나타날 것입니다.
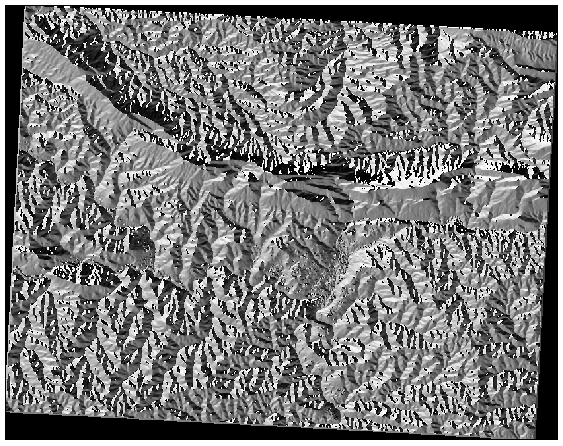
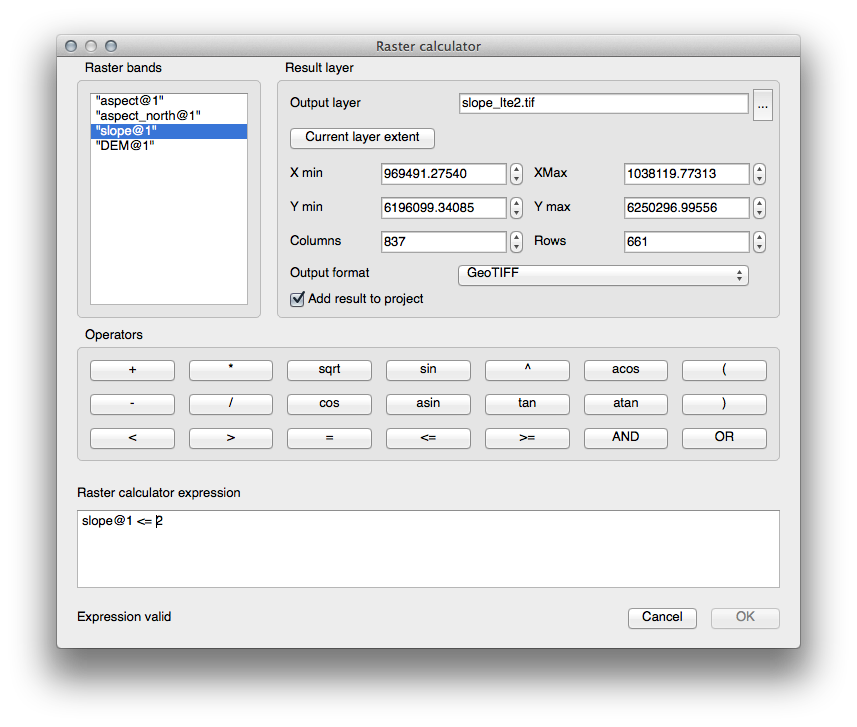
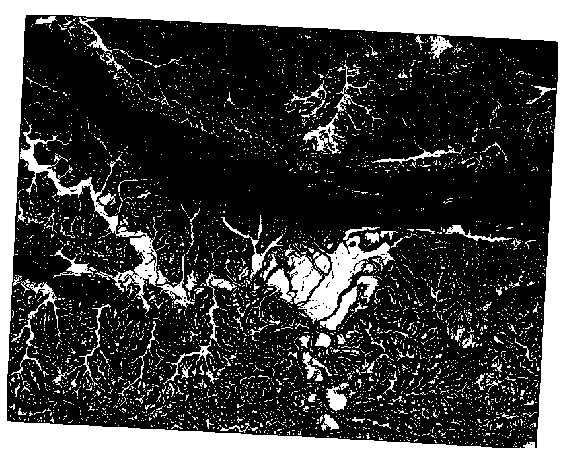
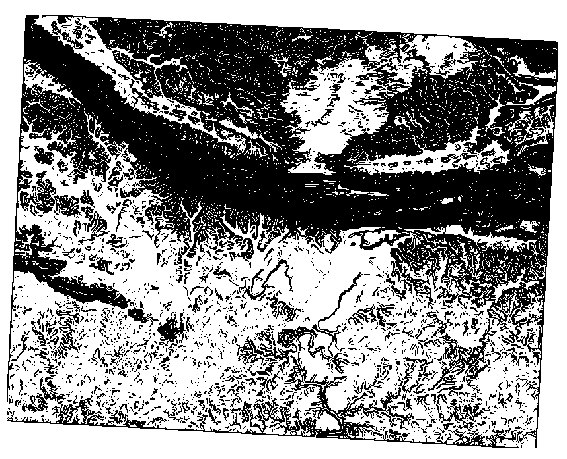
21.10. Results For 레스터 분석
21.11. Results For 분석의 완성
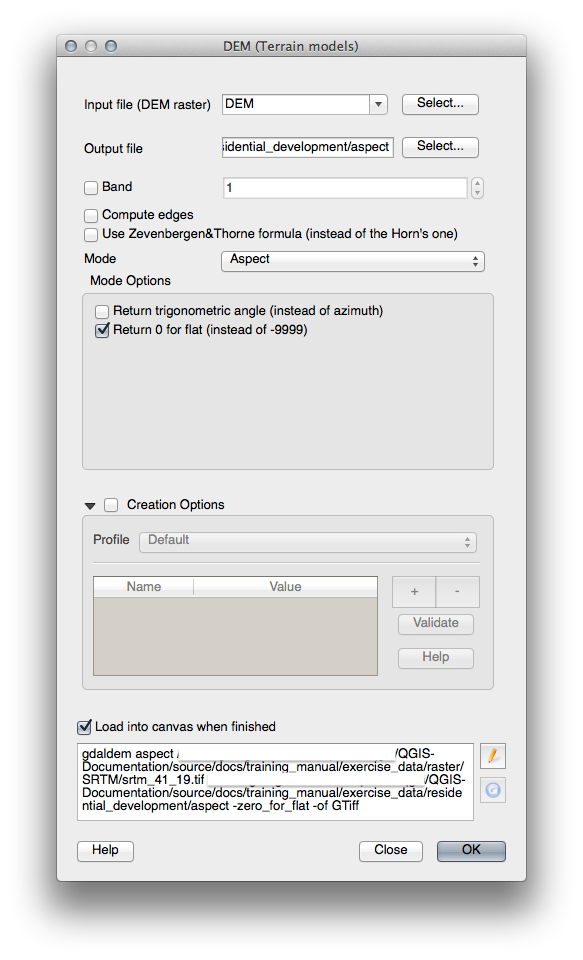
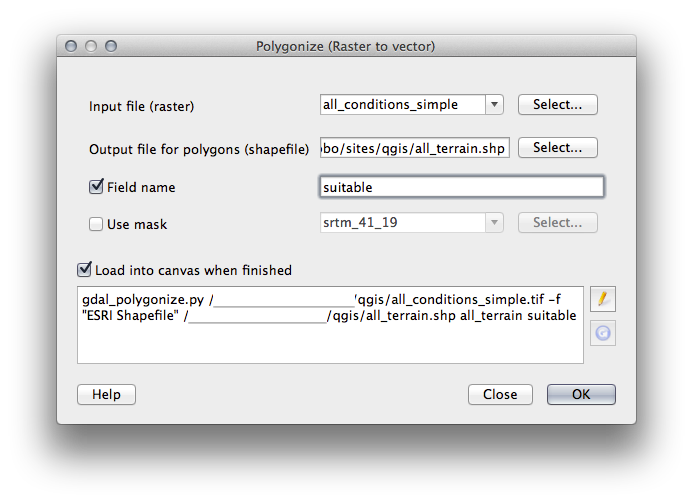
21.11.1. 래스터를 벡터화
- Open the Query Builder by right-clicking on the all_terrain layer in the Layers list, select the General tab.
그 다음 "suitable" = 1 이라는 쿼리를 작성하십시오.
OK 를 클릭해서 이 기준을 만족하지 못 하는 모든 폴리곤을 필터링하십시오.
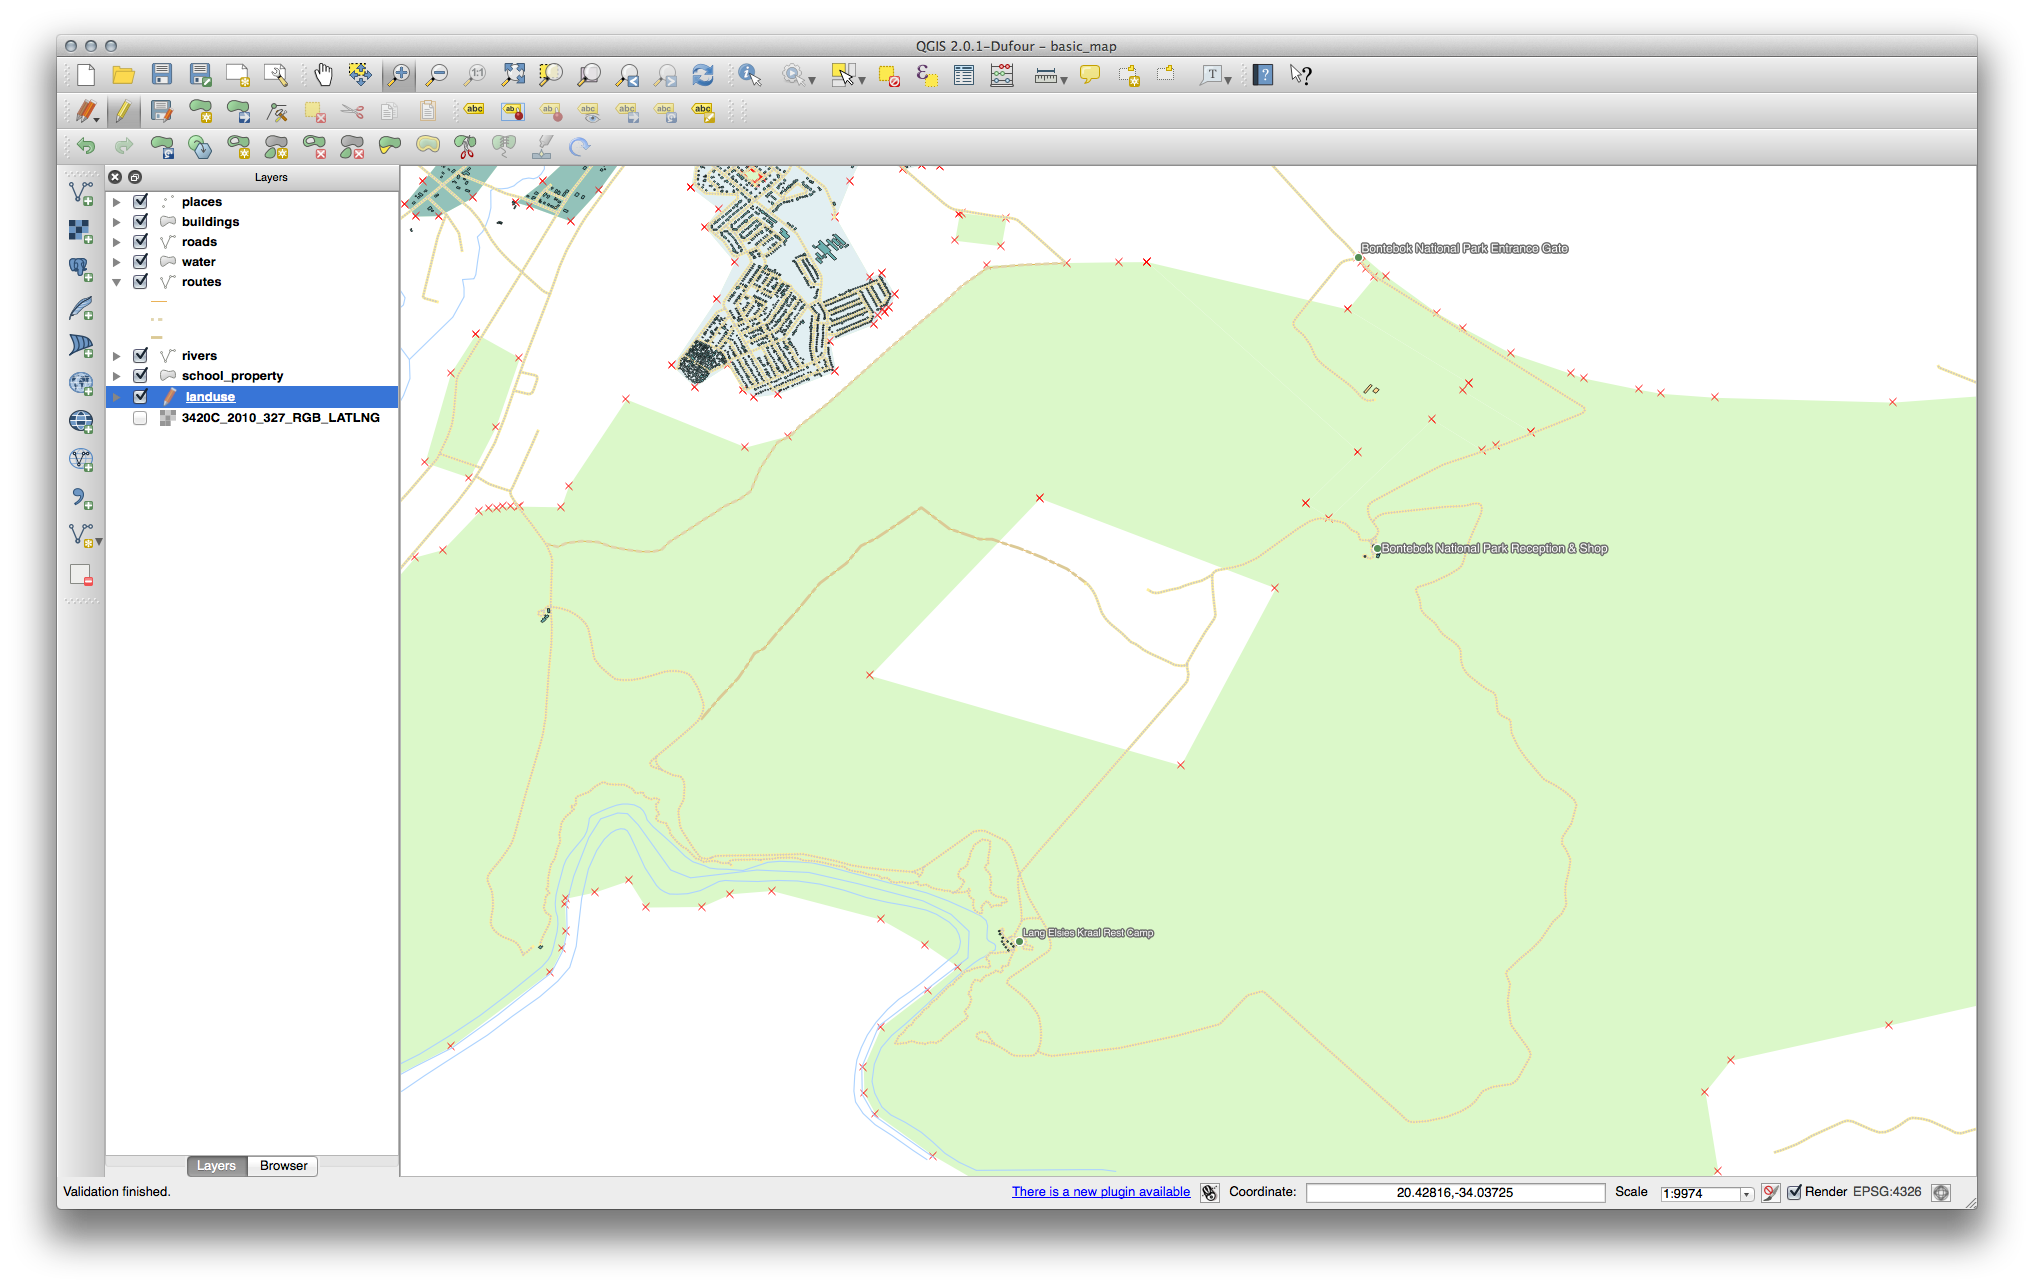
원래 래스터 위에 겹쳐보면, 다음과 같이 영역들이 완전히 일치해야 합니다.
- You can save this layer by right-clicking on the all_terrain layer in the Layers list and choosing Save As..., then continue as per the instructions.
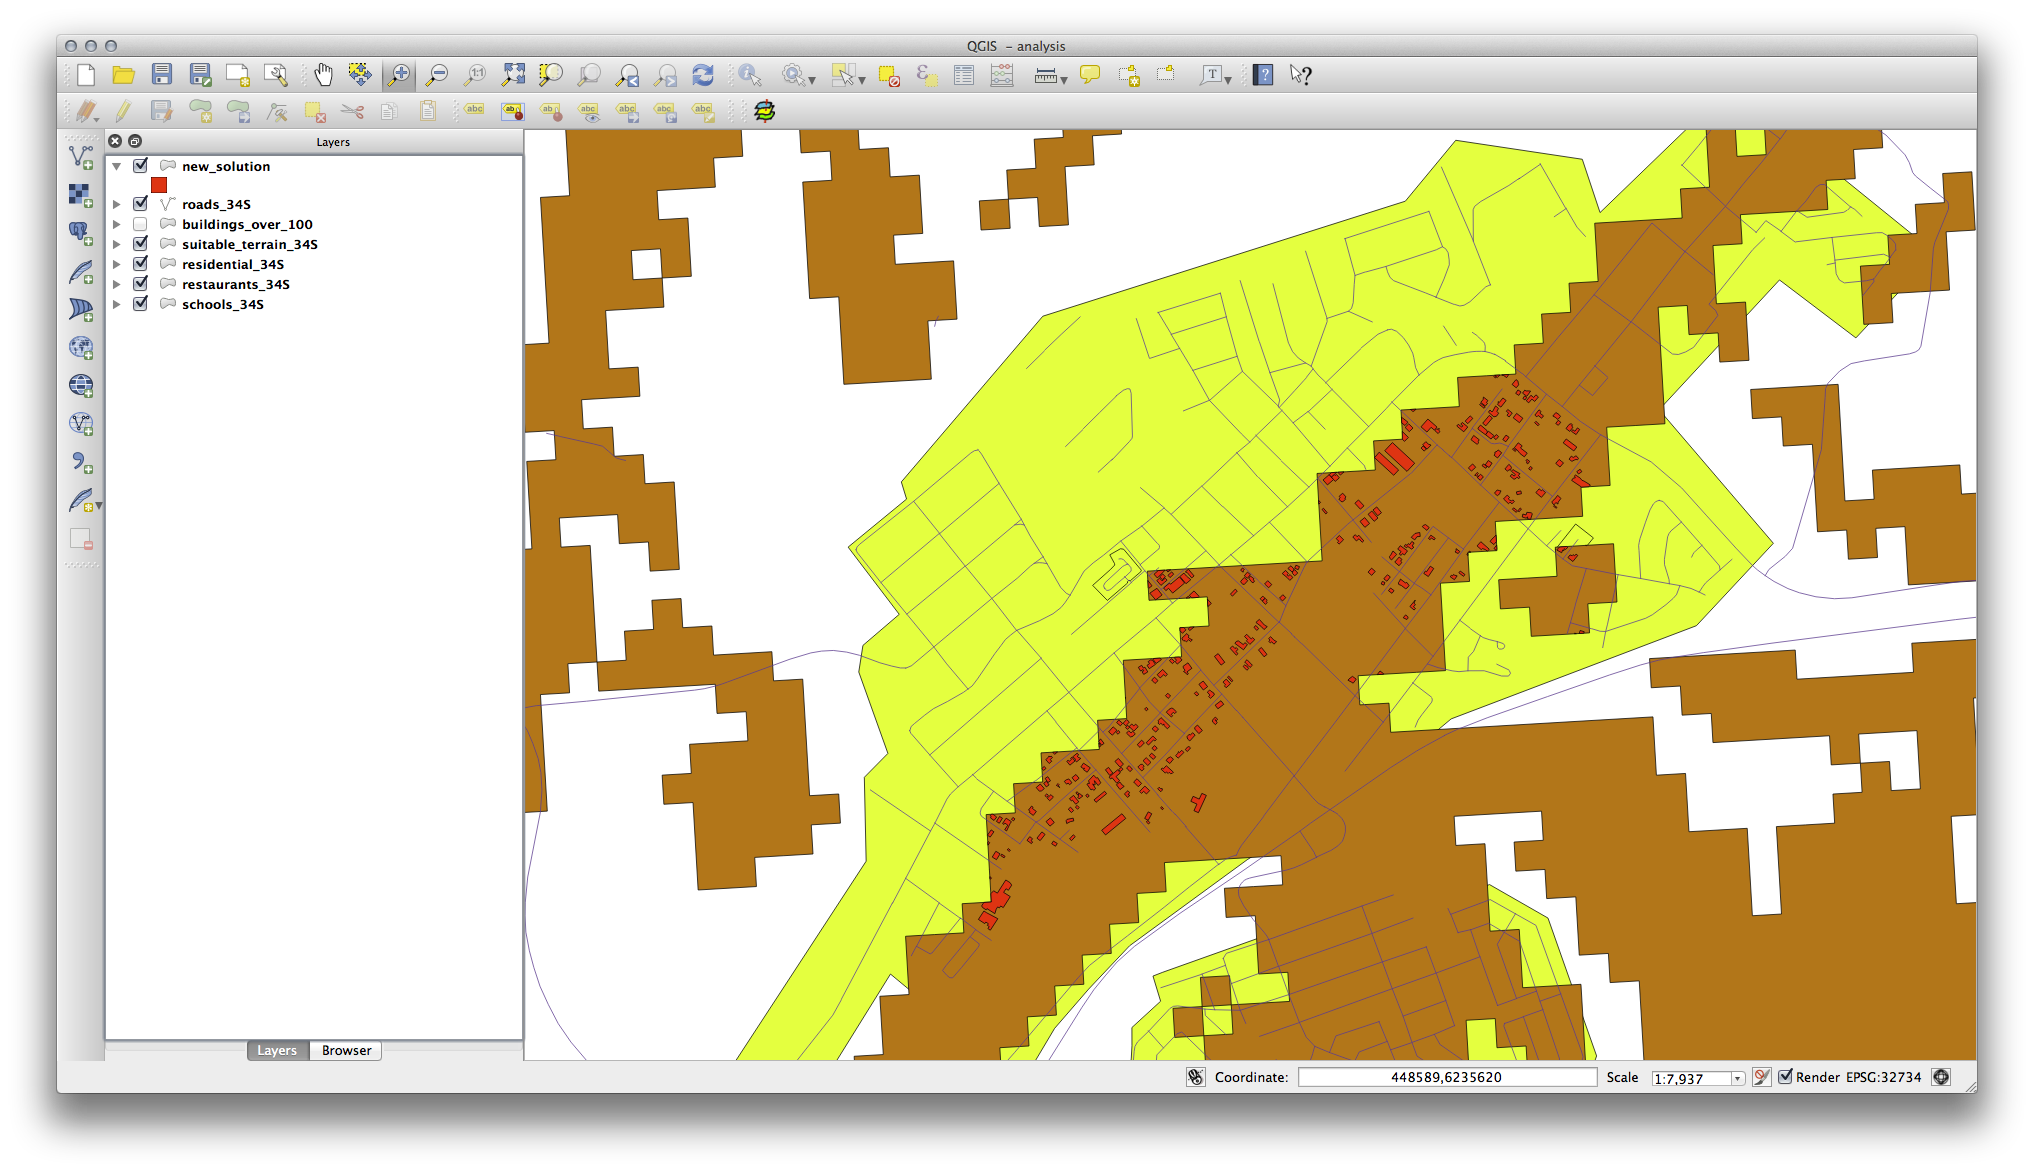
21.11.2. 결과 점검
Intersect 도구가 사용자의 new_solution 레이어에 있는 건물들 가운데 일부를 “잘라”냈을지도 모릅니다. 즉 건물의 일부만 - 따라서 부지의 일부만 - 이 적합한 지역에 들어가 있다는 사실을 보여줍니다. 따라서 당연히 데이터셋에서 이런 건물들을 제거할 수 있습니다.
21.11.3. 분석 개선
이 시점에서, 사용자의 분석이 이렇게 보여야 합니다.
모든 방향으로 100미터씩 이어지는 원형 영역을 떠올려보십시오.
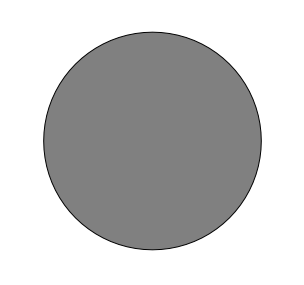
해당 영역의 반경이 100미터 이상일 경우, (모든 방향으로부터) 크기를 100미터 줄이면 다음과 같이 가운데에 영역의 일부가 남게 됩니다.
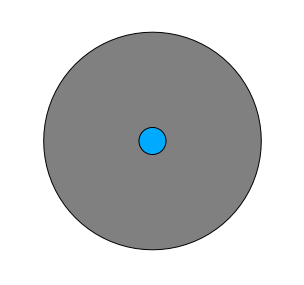
따라서, 기존 suitable_terrain 벡터 레이어에 대해 100미터 크기의 내부 버퍼(interior buffer) 를 실행할 수 있습니다. 이 버퍼 기능의 산출물에서, 원래 레이어로부터 남은 모든 영역이 100미터를 넘어서는 적합한 지역이 있는 영역을 나타내게 됩니다.
시연 :
메뉴에서 Vector ‣ Geoprocessing Tools ‣ Buffer(s) 도구를 클릭해서 Buffer(s) 대화 창을 띄우십시오.
다음과 같이 설정하십시오.
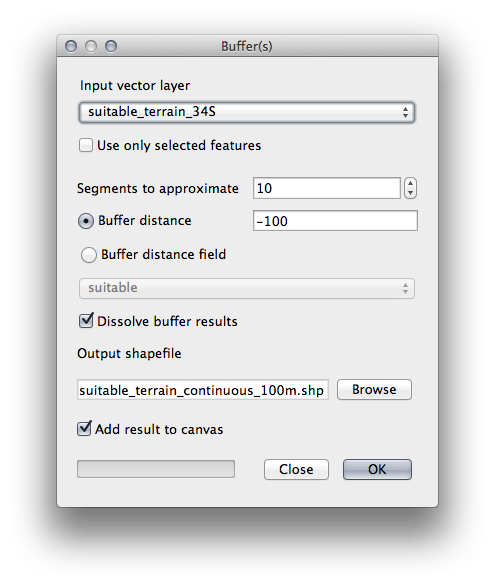
suitable_terrain 레이어에 대해 분할(segment) 값을 10 으로, 버퍼 거리를 -100 으로 설정하십시오. (사용자 맵이 투영된 CRS를 사용하고 있으므로 거리 단위가 자동적으로 미터가 됩니다.)
산출물의 경로를 exercise_data/residential_development/, 파일명을 suitable_terrain_continuous100m.shp 으로 저장하십시오.
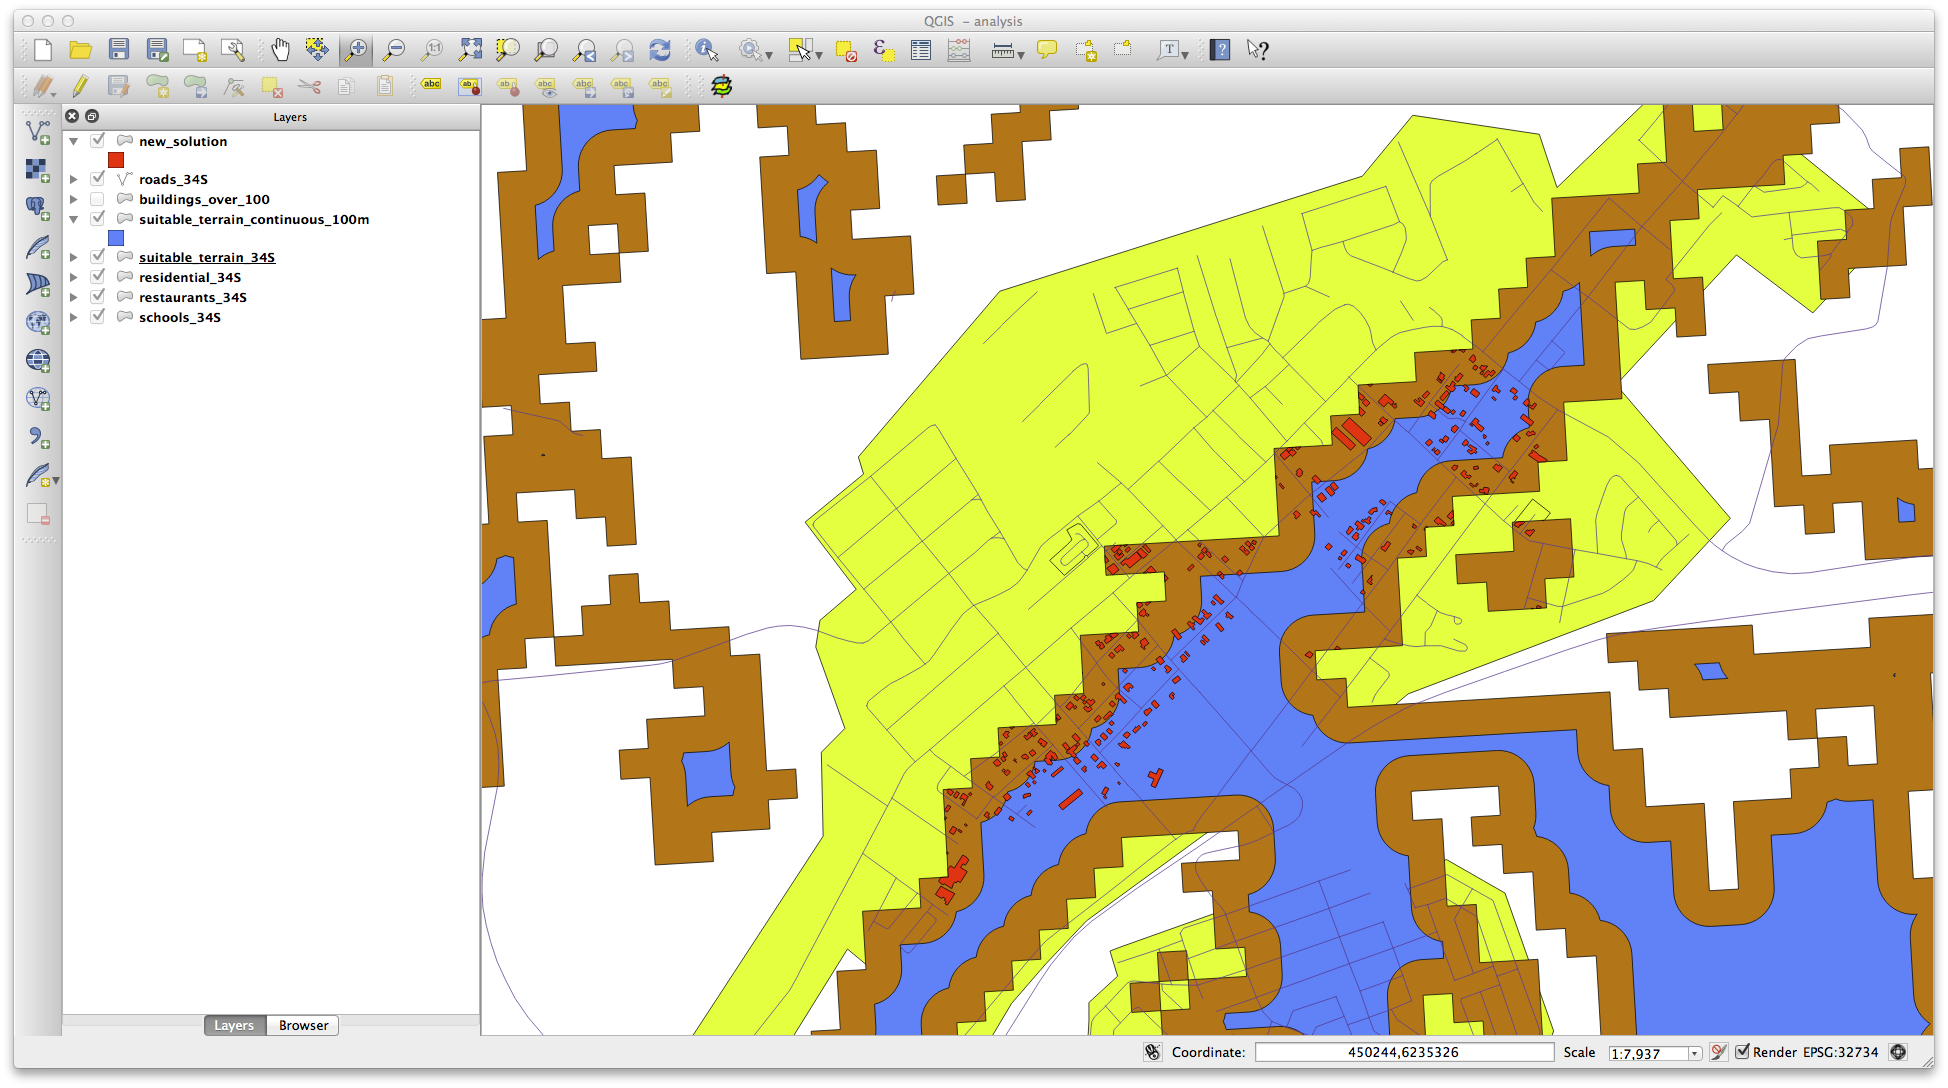
필요할 경우 새 레이어를 원래 suitable_terrain 레이어 위로 옮기십시오.
결과물이 다음과 같이 보일 것입니다.
이제 Select by Location 도구를 실행하십시오. (Vector ‣ Research Tools ‣ Select by location)
다음과 같이 설정하십시오.
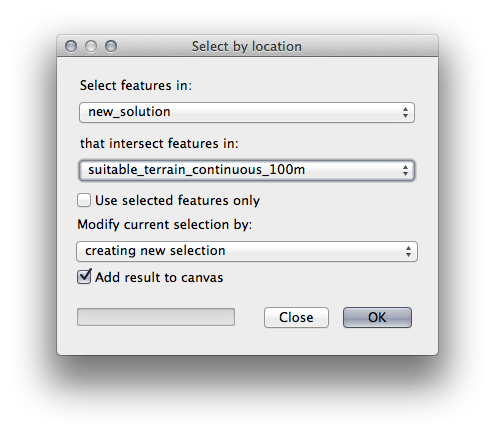
suitable_terrain_continuous100m.shp 가 담고 있는 피처와 교차(intersect)하는 new_solution 의 피처를 선택하십시오.
결과물은 다음과 같습니다.

선택된 건물들은 노란색입니다. 몇몇 건물들이 새로운 suitable_terrain_continuous100m 레이어 바깥에 걸치기는 하지만, 원래 suitable_terrain 레이어 내부에 들어 있기 때문에 모든 요구 사항들을 만족합니다.
이 선택 집합을 exercise_data/residential_development/ 경로의 final_answer.shp 파일명으로 저장하십시오.
21.12. Results For WMS
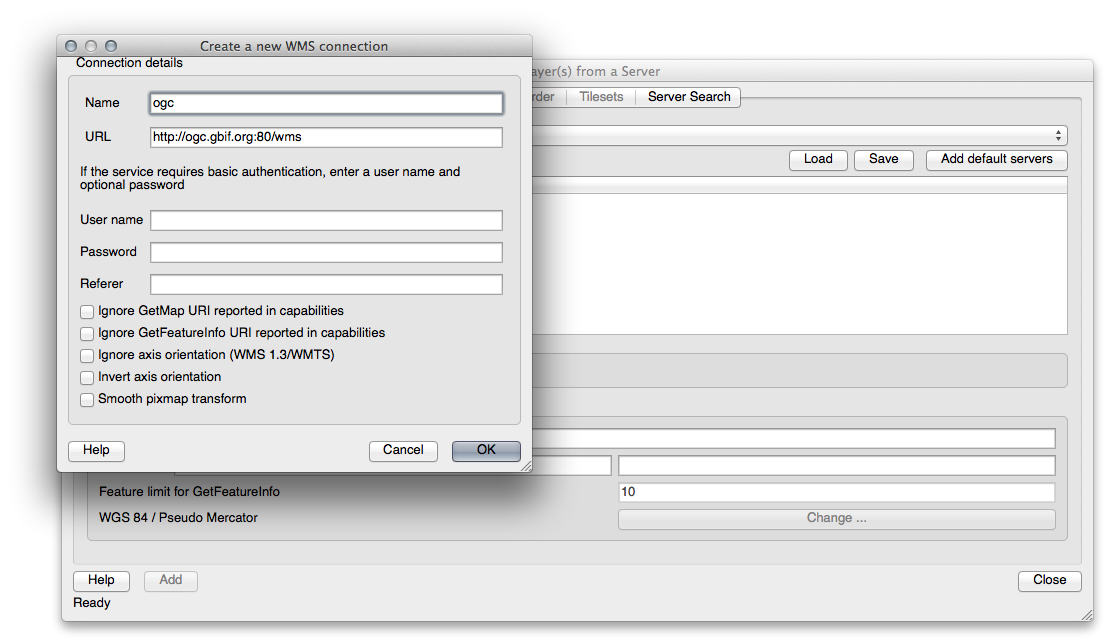
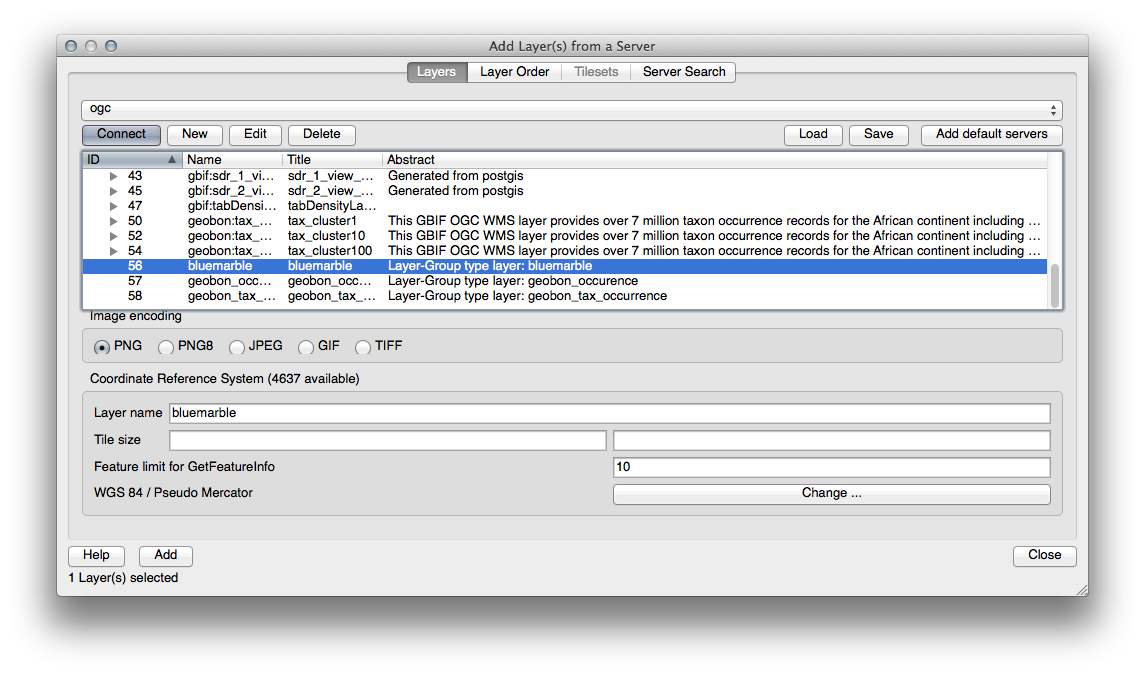
21.12.2. 새 WMS 서버 추가
이전과 동일한 방법으로 새 서버 및 해당 서버가 호스팅하고 있는 적합한 레이어를 추가하십시오.
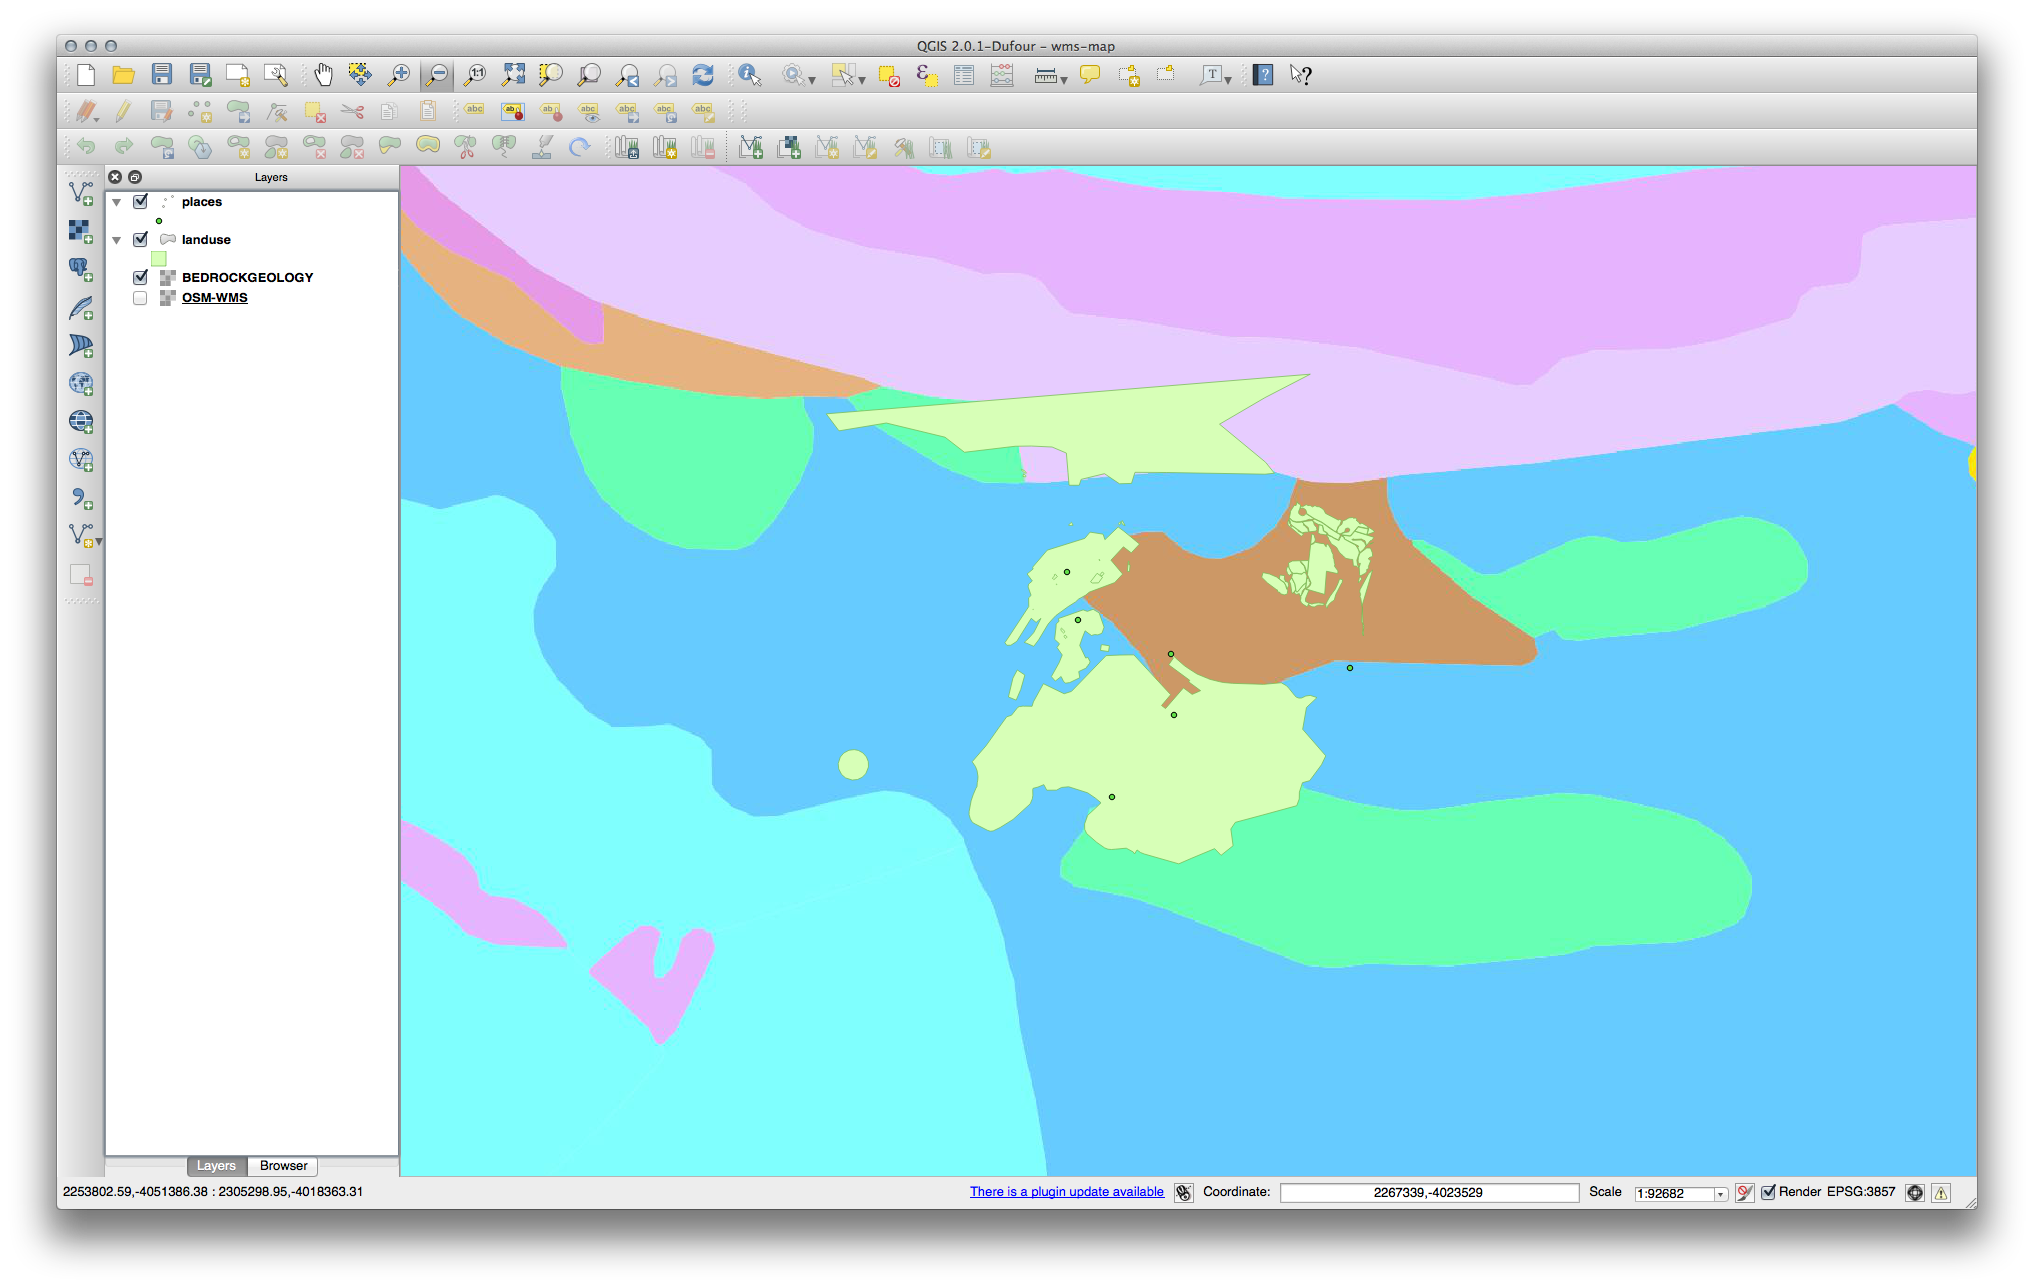
Swellendam 지역으로 줌인할 경우, 이 데이터셋의 해상도가 낮다는 사실을 알 수 있습니다.
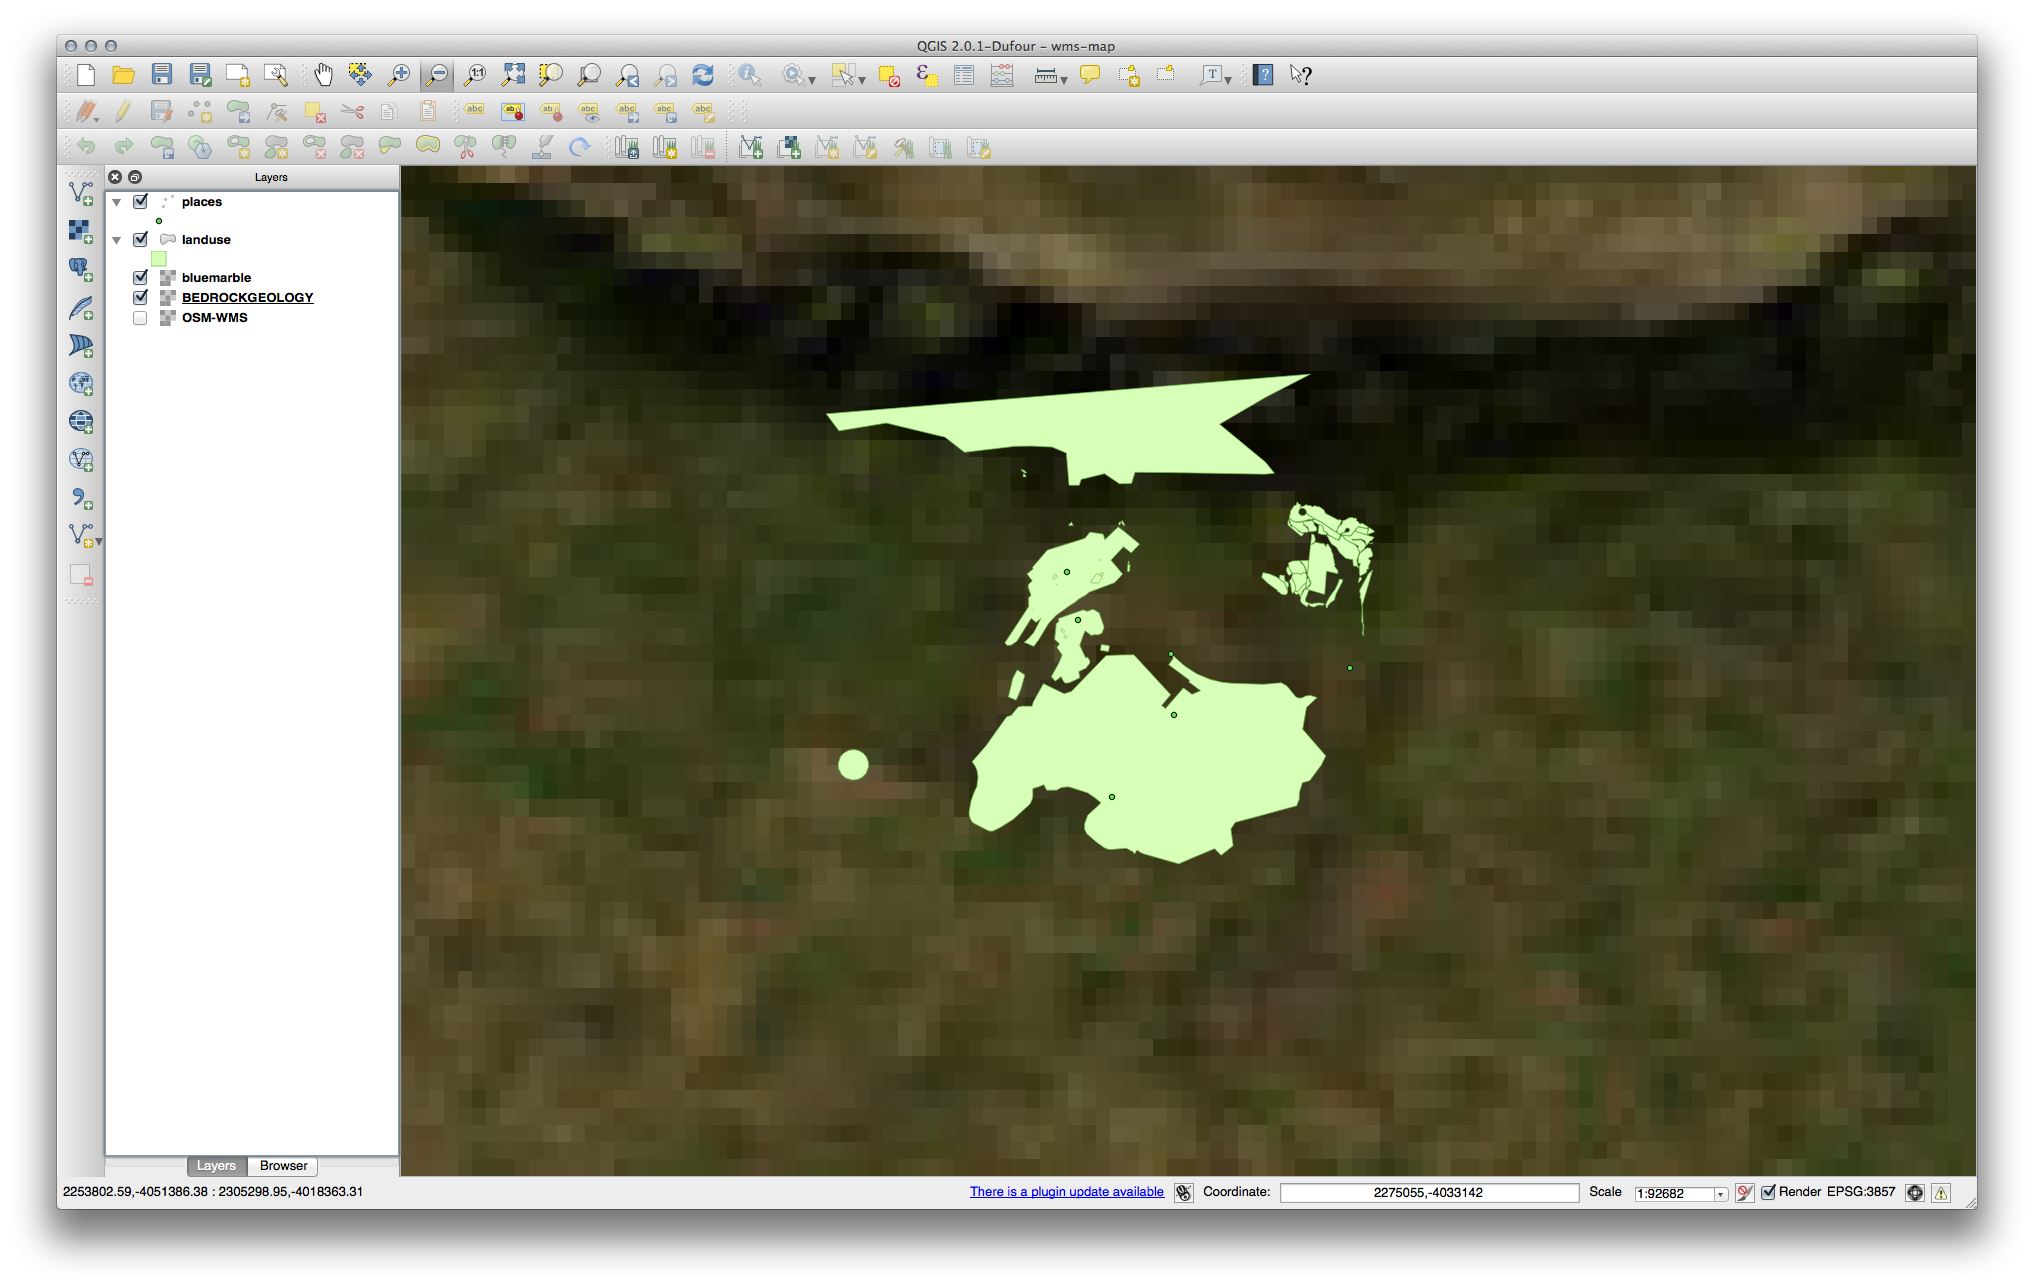
따라서, 현재 맵에서 이 데이터를 사용하지 않는 편이 좋습니다. Blue Marble 데이터는 전 세계 또는 국가 단위 수준에 적합합니다.
21.12.3. WMS 서버 찾기
You may notice that many WMS servers are not always available. Sometimes this is temporary, sometimes it is permanent. An example of a WMS server that worked at the time of writing is the World Mineral Deposits WMS at http://apps1.gdr.nrcan.gc.ca/cgi-bin/worldmin_en-ca_ows. It does not require fees or have access constraints, and it is global. Therefore, it does satisfy the requirements. Keep in mind, however, that this is merely an example. There are many other WMS servers to choose from.
21.13. Results For 데이터베이스 개념들
21.13.1. 주소 테이블 속성
우리의 이론적인 address 테이블의 경우, 다음 속성들을 저장하고자 할 수도 있습니다.
House Number
Street Name
Suburb Name
City Name
Postcode
Country
주소 오브젝트를 나타내는 테이블을 생성할 때, 이 속성들을 하나하나 나타내는 열을 생성하고 SQL을 준수하며 가능한 경우 축약된 명칭을 부여할 것입니다.
house_number
street_name
suburb
city
postcode
country
21.13.2. 인물 테이블 정규화
people 테이블의 큰 문제는 한 인물의 주소 전체를 담고 있는 주소 필드가 하나뿐이라는 사실입니다. 이 강의 이전 단계의 이론적인 address 테이블을 생각해보면, 우리는 주소가 서로 다른 여러 속성으로 이루어져 있다는 것을 알고 있습니다. 이 모든 속성들을 필드 하나에 저장한다면, 데이터를 업데이트하거나 쿼리하는 작업이 더욱 힘들어집니다. 따라서 주소 필드를 다양한 속성들로 나누어 다음과 같은 구조의 테이블을 생성해야 할 것입니다.
id |     name      | house_no |  street_name   |    city    |   phone_no
 --+---------------+----------+----------------+------------+-----------------
 1 | Tim Sutton    |     3    | Buirski Plein  | Swellendam | 071 123 123
 2 | Horst Duester |     4    | Avenue du Roix | Geneva     | 072 121 122
주석
다음 섹션에서, 이 예제의 데이터베이스 구조를 더욱 향상시킬 수 있는 외래 키 관계에 대해 배울 것입니다.
21.13.3. 인물 테이블 심화 정규화
현재 people 테이블은 다음과 같이 보입니다.
id |     name     | house_no | street_id |  phone_no
---+--------------+----------+-----------+-------------
 1 | Horst Duster |        4 |         1 | 072 121 122
street_id 열은 ‘people’ 오브젝트 및 관련 ‘street’ 오브젝트 사이의 ‘일대다’ 관계를 나타냅니다. 이때 ‘street’ 오브젝트는 streets 테이블에 있습니다.
테이블을 심도 있게 정규화하는 방법 가운데 하나는 명칭 필드를 다음과 같이 first_name 과 last_name 으로 나누는 것입니다.
id | first_name | last_name  | house_no | street_id |  phone_no
---+------------+------------+----------+-----------+------------
 1 |    Horst   |   Duster   |     4    |     1     | 072 121 122
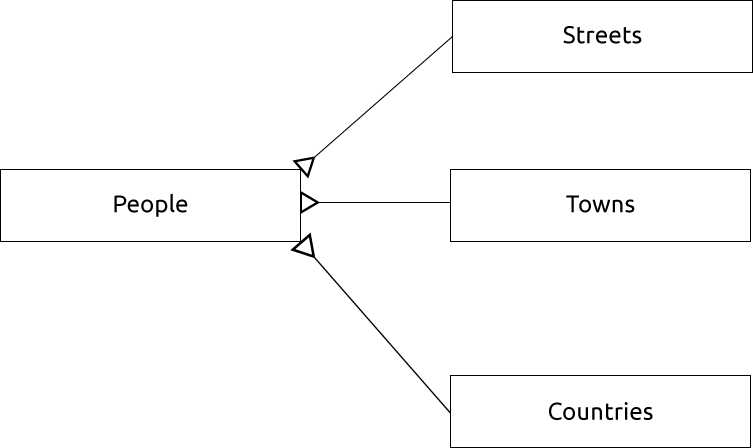
또한 마을이나 도시 명칭 및 국가를 위한 개별 테이블을 생성하고, 이들을 ‘일대다’ 관계를 통해 people 테이블에 연결할 수도 있습니다.
id | first_name | last_name | house_no | street_id | town_id | country_id
---+------------+-----------+----------+-----------+---------+------------
 1 |    Horst   |   Duster  |     4    |     1     |    2    |     1
이에 대한 ER 도표를 그린다면 다음과 같이 보일 것입니다.
21.13.4. 인물 테이블 생성
정확한 people 테이블을 생성하기 위해 필요한 SQL은 다음과 같습니다.
create table people (id serial not null primary key,
                     name varchar(50),
                     house_no int not null,
                     street_id int not null,
                     phone_no varchar null );
이 테이블의 스키마는 다음과 같습니다. (:kbd:` d people` 입력)
Table "public.people"

Column     |         Type          |                      Modifiers
-----------+-----------------------+-------------------------------------
id         | integer               | not null default
           |                       | nextval('people_id_seq'::regclass)
name       | character varying(50) |
house_no   | integer               | not null
street_id  | integer               | not null
phone_no   | character varying     |
Indexes:
  "people_pkey" PRIMARY KEY, btree (id)
주석
보기 쉽게 하기 위해, 일부러 외래 키 제약을 제외했습니다.
21.13.5. DROP 명령어
이 경우 DROP 명령어가 먹히지 않는 이유는 people 테이블이 streets 테이블에 외래 키 제약을 갖추고 있기 때문입니다. 즉 streets 테이블을 드롭하면 (또는 삭제하면) people 테이블이 존재하지 않는 streets 데이터를 참조하게 됩니다.
주석
CASCADE 명령어를 사용하면 streets 테이블을 ‘강제로’ 삭제할 수 있지만, 동시에 people 테이블은 물론 streets 테이블과 관계가 있는 모든 테이블을 삭제하게 됩니다. 조심해서 사용하세요!
21.13.6. 새 도로 삽입
The SQL command you should use looks like this (you can replace the street name with a name of your choice):
insert into streets (name) values ('Low Road');
21.13.7. 외래 키 관계를 가진 새 인물 추가
정확한 SQL 선언문은 다음과 같습니다.
insert into streets (name) values('Main Road');
insert into people (name,house_no, street_id, phone_no)
  values ('Joe Smith',55,2,'072 882 33 21');
다시 (이전과 동일한 선택 선언문을 써서) streets 테이블을 보면, Main Road 항목에 대한 id 값이 2 라는 것을 알 수 있습니다.
이것이 앞에서 단순히 숫자 2 만 입력해도 됐던 이유입니다. 앞의 선언문에서 Main Road 라고 전부 풀어 쓰지 않아도, 데이터베이스가 street_id 값이 2 인 레코드들을 모두 연결할 수 있습니다.
주석
이미 새로운 street 오브젝트를 추가했다면, 새 Main Road 의 ID가 2 가 아닌 3 임을 볼 수 있을 것입니다.
21.13.8. 도로명 반환
사용자가 사용해야 할 정확한 SQL 선언문은 다음과 같습니다.
select count(people.name), streets.name
from people, streets
where people.street_id=streets.id
group by streets.name;
결과 :
count |    name
------+-------------
    1 | Low Street
    2 | High street
    1 | Main Road
(3 rows)
주석
이미 테이블 명칭들을 (people.name 이나 streets.name 처럼) 정해놓았다는 사실을 알아차렸을 겁니다. 항목명이 모호할 경우에 (데이터베이스 내부의 모든 테이블에서 유일하지 않을 경우) 이런 조치가 필요합니다.
21.14. Results For 공간 쿼리
21.14.1. 공간 쿼리에 사용되는 단위들
예제 쿼리가 사용하는 단위는 도(degree)입니다. 해당 레이어가 사용하는 CRS가 WGS84이기 때문입니다. WGS84는 지리 CRS로, 지리 CRS는 도를 단위로 사용합니다. UTM 투영체와 같은 투영 CRS는 미터를 단위로 사용합니다.
쿼리 작성 시 레이어의 CRS가 사용하는 단위를 알아야 한다는 사실을 기억하십시오. 그래야만 사용자가 예상하는 결과를 반환하는 쿼리를 작성할 수 있습니다.
21.15. Results For 도형 구성
21.15.1. 라인스트링 생성
alter table streets add column the_geom geometry;
alter table streets add constraint streets_geom_point_chk check
     (st_geometrytype(the_geom) = 'ST_LineString'::text OR the_geom IS NULL);
insert into geometry_columns values ('','public','streets','the_geom',2,4326,
     'LINESTRING');
create index streets_geo_idx
  on streets
  using gist
  (the_geom);
21.15.2. 테이블 연결
delete from people;
alter table people add column city_id int not null references cities(id);
(QGIS에서 도시를 캡처하십시오.)
insert into people (name,house_no, street_id, phone_no, city_id, the_geom)
   values ('Faulty Towers',
           34,
           3,
           '072 812 31 28',
           1,
           'SRID=4326;POINT(33 33)');

insert into people (name,house_no, street_id, phone_no, city_id, the_geom)
   values ('IP Knightly',
           32,
           1,
           '071 812 31 28',
           1,F
           'SRID=4326;POINT(32 -34)');

insert into people (name,house_no, street_id, phone_no, city_id, the_geom)
   values ('Rusty Bedsprings',
           39,
           1,
           '071 822 31 28',
           1,
           'SRID=4326;POINT(34 -34)');
다음 오류 메시지를 반환받을 경우,
ERROR:  insert or update on table "people" violates foreign key constraint
        "people_city_id_fkey"
DETAIL: Key (city_id)=(1) is not present in table "cities".
cities 테이블에 대해 폴리곤을 생성하려 하는 동안 일부를 삭제하고 다시 시작해야 한다는 의미입니다. 사용자의 cities 테이블에 있는 항목들을 확인하고 존재하는 id 를 사용하십시오.
21.16. Results For 단순 피처 모델
21.16.1. 테이블에 값 채우기
create table cities (id serial not null primary key,
                     name varchar(50),
                     the_geom geometry not null);
 alter table cities
 add constraint cities_geom_point_chk
 check (st_geometrytype(the_geom) = 'ST_Polygon'::text );
21.16.2. ‘geometry_columns’ 테이블 채우기
insert into geometry_columns values
      ('','public','cities','the_geom',2,4326,'POLYGON');
21.16.3. 도형 추가
select people.name,
       streets.name as street_name,
       st_astext(people.the_geom) as geometry
from   streets, people
where  people.street_id=streets.id;
결과 :
     name     | street_name |   geometry
--------------+-------------+---------------
 Roger Jones  | High street |
 Sally Norman | High street |
 Jane Smith   | Main Road   |
 Joe Bloggs   | Low Street  |
 Fault Towers | Main Road   | POINT(33 -33)
(5 rows)
제약 조건 덕분에 데이터베이스에 Null 값을 추가할 수 있다는 사실을 알 수 있습니다.