3.1. Lesson: ベクタ属性データ
ベクタデータは、GISの日常的な使用において間違いなく最も一般的な種類のデータです。ベクタモデルは、ポイント、ライン、ポリゴン(および3Dデータの場合はサーフェスとボリューム)を使用して地理的特徴の位置と形状を表し、その他のプロパティは属性として含まれます(QGISではよくテーブルとして表示されます)。
今までは、地図に行った変更はどれも、表示されているオブジェクトに影響されませんでした。言い換えれば、すべての土地利用エリアは同じように見え、そしてすべての道路は同じように見えます。地図を見ている人は、見ている道路については何もわかっていません。わかっているのは、その地域にその形状の道があるということだけです。
しかし、GISの全体強みは、地図上に表示されるすべてのオブジェクトが属性も持っていることです。GISでの地図はただの絵ではありません。それらは場所内のオブジェクトだけでなく、それらのオブジェクトに関する情報も表しています。
このレッスンの目標: ベクタデータの構造について学び、オブジェクトの属性データについて探ります
3.1.1.  Follow Along: レイヤー属性を表示する
作業しているデータは、オブジェクトが空間の どこ にあるかを表すだけでなく、それらのオブジェクトが 何 であるかを語っていることも、知っておくことが重要です。
前の演習から、地図に protected_areas レイヤーがロードされているはずです。ロードされていない場合は、ディレクトリ exercise_data/shapefile に protected_areas.shp という ESRI Shapefile 形式のデータセットがあります。
The polygons representing the protected areas constitute the spatial data, but we can learn more about the protected areas by exploring the attribute table.
In the Layers panel, click on the
protected_areaslayer to select it.In the Attributes Toolbar click the
 Open Attribute Table button. This will open a new window showing
the attribute table of the
Open Attribute Table button. This will open a new window showing
the attribute table of the protected_areaslayer.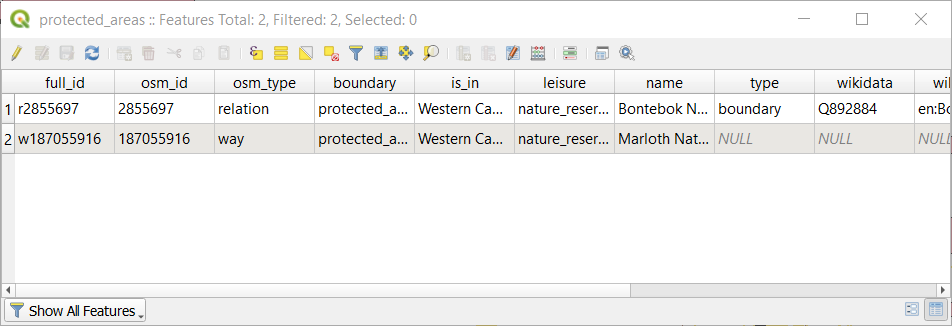
行は レコード と呼ばれ、ポリゴンなど、キャンバスマップ中の 地物 に関連付けられています。列は フィールド (または 属性 )と呼ばれ、「name」や「id」など、列を説明するのに役立つ名前が付いています。セル内の値は 属性値 と呼ばれます。これらの定義はGISで一般的に使用されているため、よく理解しておくとよいでしょう。
In the
protected_areaslayer, there are two features, which are represented by the two polygons we see on the Map Canvas.注釈
フィールド と 属性値 が何を表しているかを理解するには、属性値の意味を説明するドキュメント(またはメタデータ)を見つける必要がある場合があります。これは通常、データセットの作成者から入手できます。
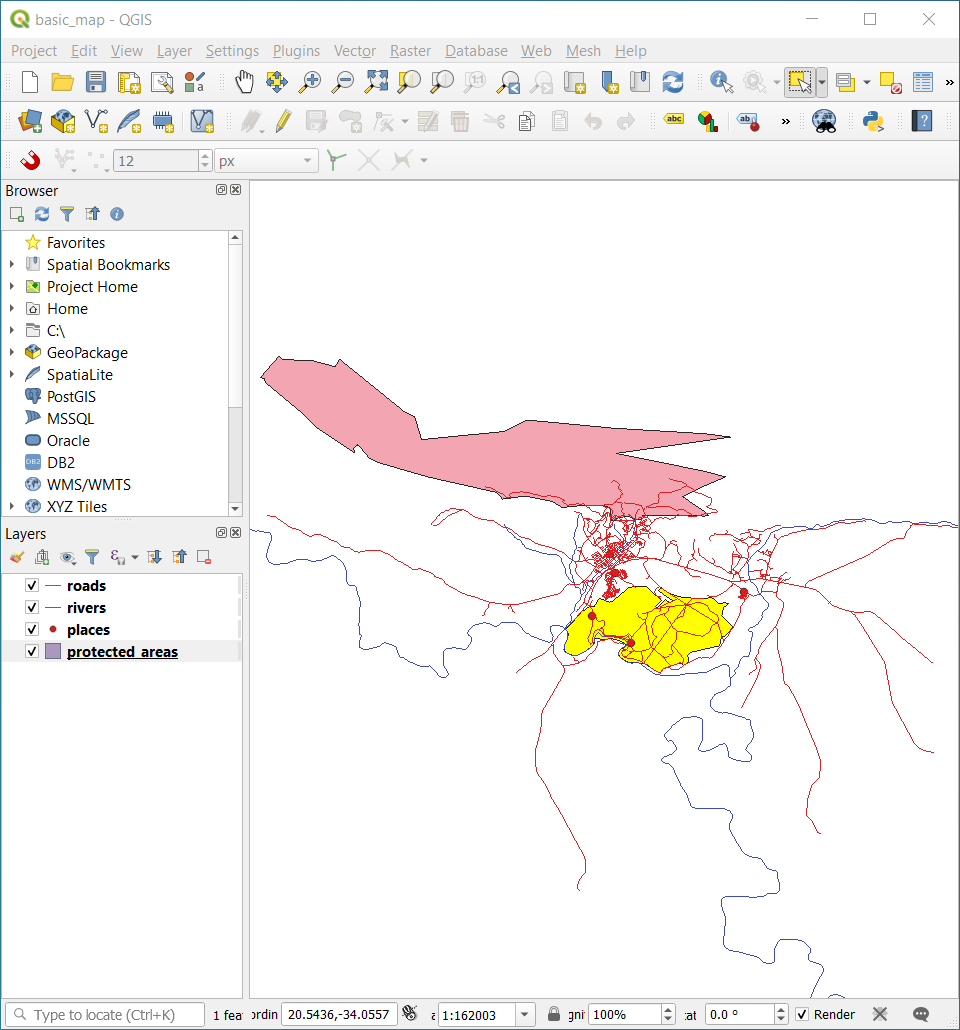
Next, let's see how a record in the attribute table is linked to a polygon feature that we see on the Map Canvas.
Go back to the main QGIS window.
In the Attributes Toolbar, click on the
 Select Feature button.
Make sure the
protected_areaslayer is still selected in the Layers panel.Move your mouse to the Map Canvas and left click on the smaller of the two polygons. The polygon will turn yellow indicating it is selected.
Go back to the Attribute Table window, and you should see a record (row) highlighted. These are the attribute values of the selected polygon.
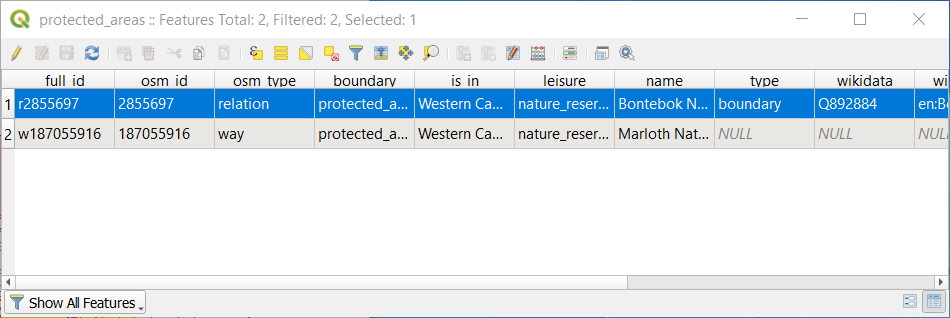
You can also select a feature using the Attribute Table.
In the Attribute Table window, on the far left, click on the row number of the record that is currently not selected.
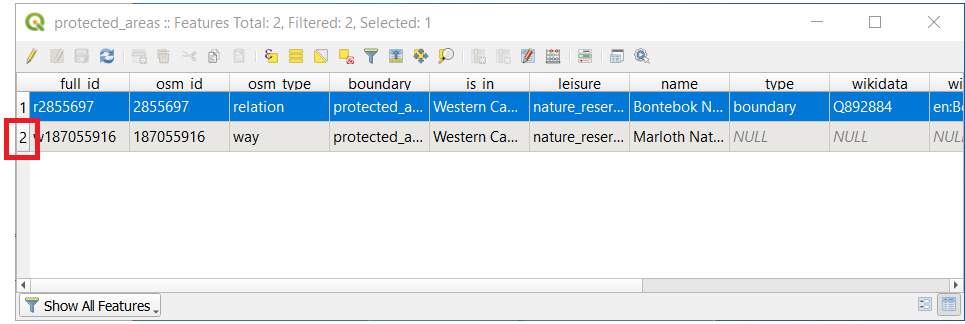
Go back to the main QGIS window and look at the Map Canvas. You should see the larger of the two polygons colored yellow.
To deselect the feature, go to the Attribute Table window and click on
 Deselect all features from the layer button.
地図キャンバスに表示される地物が多数あり、属性テーブルからどの地物が選択されているかを確認するのが難しい場合があります。地物の場所を特定する別の方法は、 FlashFeature ツールを使用することです。
In the Attribute Table, right-click on any cell in the row that has the attribute value
r2855697for the fieldfull_id.In the context menu, click on Flash Feature and watch the Map Canvas.
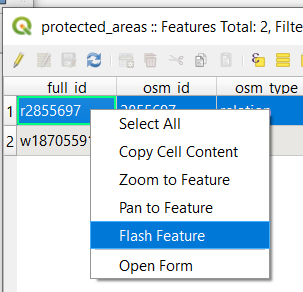
You should see the polygon flash red a few times. If you missed it, try it again.
Another useful tool is the Zoom to Feature tool, that tells QGIS to zoom to the feature of interest.
In the Attribute Table, right-click on any cell in the row that has the attribute value
r2855697for the fieldfull_id.In the context menu, click on Zoom to Feature
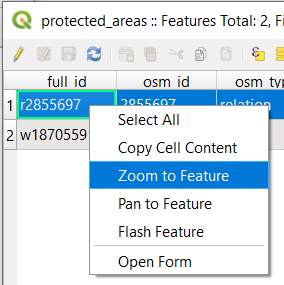
Look at the Map Canvas. The polygon should now occupy the extent of the Map Canvas area.
ここで属性テーブルを閉じてください.
3.1.2. Try Yourself Exploring Vector Data Attributes
How many fields are available in the rivers layer?
Tell us a bit about the
townplaces in your dataset.Open the attribute table for the places layer. Which field would be the most useful to represent in label form, and why?
3.1.3. In Conclusion
これで使用しているデータ中に実際に何があるかを見るために属性テーブルを使用する方法がわかりましたね。どんなデータセットでも有用なのは気になる属性を持っている場合だけでしょう。どんな属性が必要かを知っていれば、与えられたデータセットが使用できるかどうか、あるいは必要な属性データを持つ別のデータセットを探す必要があるか、すぐに判断できます。
3.1.4. What's Next?
異なる属性は異なる目的のために有用です。それらのいくつかは、地図のユーザーが見るテキストとして直接表現できます。次のレッスンでこれを行う方法を学びます。