3.1. Lesson: Vector Attribute Data
Vector data is arguably the most common kind of data in the daily use of GIS. The vector model represents the location and shape of geographic features using points, lines and polygons (and for 3D data also surfaces and volumes), while their other properties are included as attributes (often presented as a table in QGIS).
Up to now, none of the changes we have made to the map have been influenced by the objects that are being shown. In other words, all the land use areas look alike, and all the roads look alike. When looking at the map, the viewers don’t know anything about the roads they are seeing; only that there is a road of a certain shape in a certain area.
But the whole strength of GIS is that all the objects that are visible on the map also have attributes. Maps in a GIS aren’t just pictures. They represent not only objects in locations, but also information about those objects.
The goal for this lesson: To learn about the structure of vector data and explore the attribute data of an object
3.1.1.  Follow Along: Viewing Layer Attributes
It’s important to know that the data you will be working with does not only represent where objects are in space, but also tells you what those objects are.
From the previous exercise, you should have the protected_areas layer
loaded in your map. If it is not loaded, then you can find the
protected_areas.shp ESRI Shapefile format dataset in directory
exercise_data/shapefile.
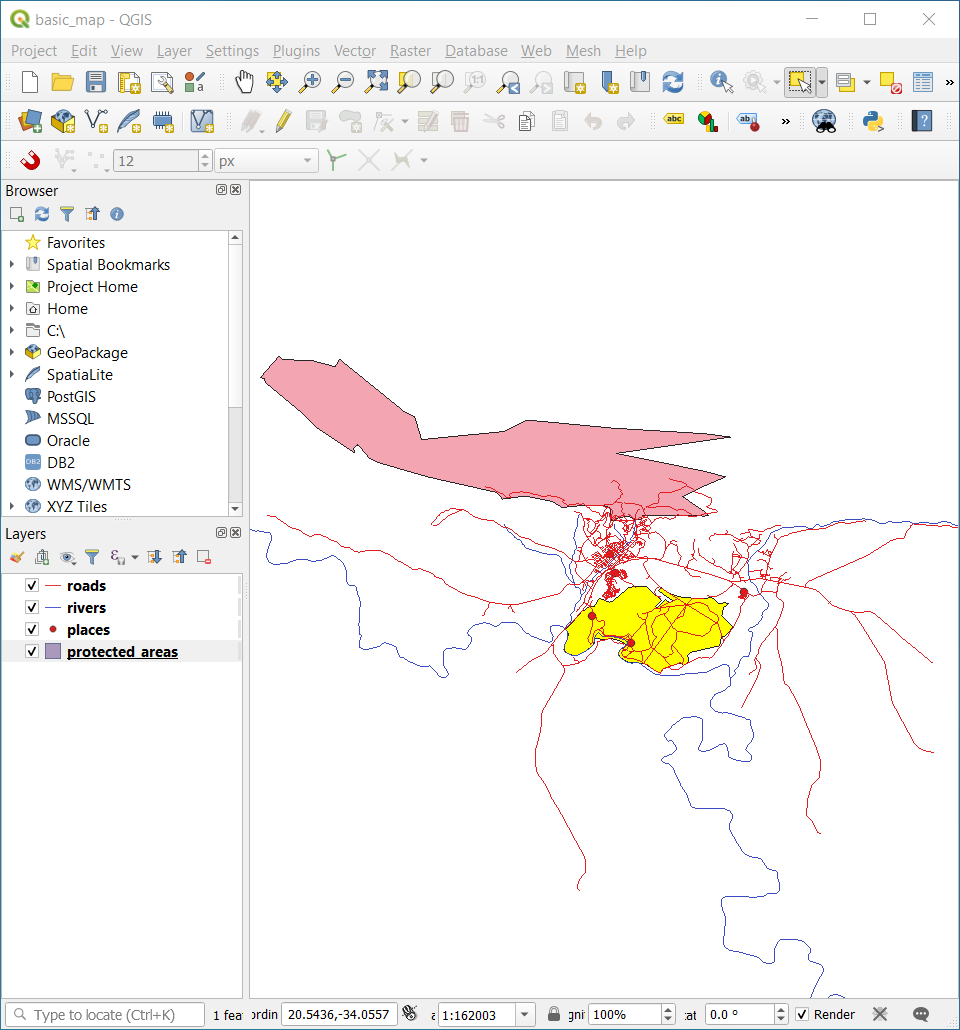
The polygons representing the protected areas constitute the spatial data, but we can learn more about the protected areas by exploring the attribute table.
In the Layers panel, click on the
protected_areaslayer to select it.In the Attributes Toolbar click the
 Open Attribute Table button. This will open a new window showing
the attribute table of the
Open Attribute Table button. This will open a new window showing
the attribute table of the protected_areaslayer.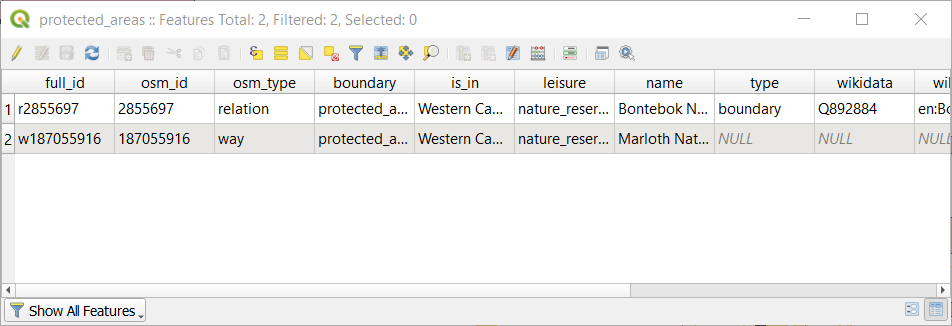
A row is called a record and is associated with a feature in the Canvas Map, such as a polygon. A column is called a field (or an attribute), and has a name that helps describe it, such as
nameorid. Values in the cells are known as attribute values. These definitions are commonly used in GIS, so it is good to become familiar with them.In the
protected_areaslayer, there are two features, which are represented by the two polygons we see on the Map Canvas.Note
In order to understand what the fields and attribute values represent, one may need to find documentation (or metadata) describing the meaning of the attribute values. This is usually available from the creator of the data set.
Next, let’s see how a record in the attribute table is linked to a polygon feature that we see on the Map Canvas.
Go back to the main QGIS window.
In the Attributes Toolbar, click on the
 Select Feature button.
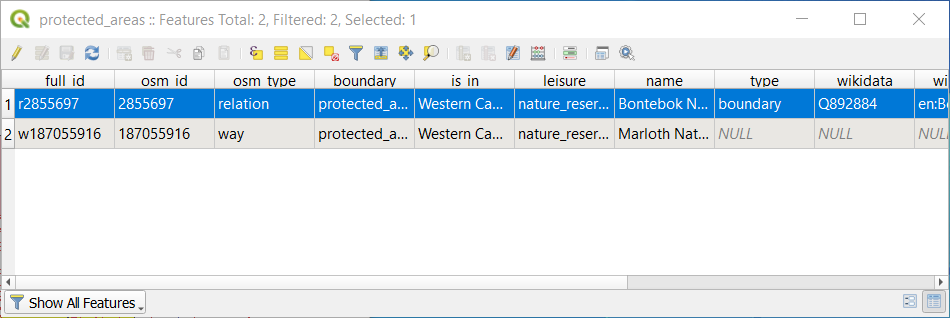
Make sure the
protected_areaslayer is still selected in the Layers panel.Move your mouse to the Map Canvas and left click on the smaller of the two polygons. The polygon will turn yellow indicating it is selected.
Go back to the Attribute Table window, and you should see a record (row) highlighted. These are the attribute values of the selected polygon.
You can also select a feature using the Attribute Table.
In the Attribute Table window, on the far left, click on the row number of the record that is currently not selected.
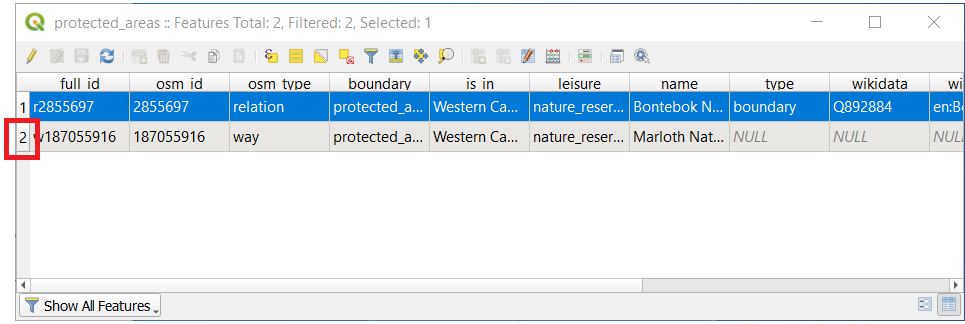
Go back to the main QGIS window and look at the Map Canvas. You should see the larger of the two polygons colored yellow.
To deselect the feature, go to the Attribute Table window and click on
 Deselect all features from the layer button.
Sometimes there are many features shown on the Map Canvas and it might be difficult to see which feature is selected from the Attribute Table. Another way to identify the location of a feature is to use the Flash Feature tool.
In the Attribute Table, right-click on any cell in the row that has the attribute value
r2855697for the fieldfull_id.In the context menu, click on Flash Feature and watch the Map Canvas.
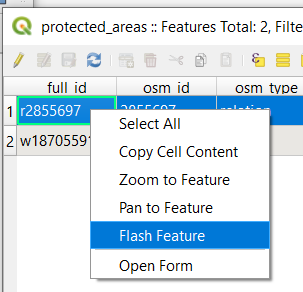
You should see the polygon flash red a few times. If you missed it, try it again.
Another useful tool is the Zoom to Feature tool, that tells QGIS to zoom to the feature of interest.
In the Attribute Table, right-click on any cell in the row that has the attribute value
r2855697for the fieldfull_id.In the context menu, click on Zoom to Feature
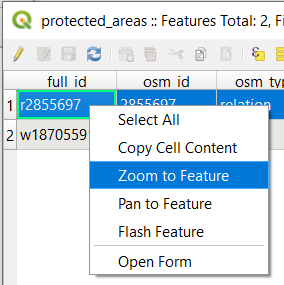
Look at the Map Canvas. The polygon should now occupy the extent of the Map Canvas area.
You may now close the attribute table.
3.1.2. Try Yourself Exploring Vector Data Attributes
How many fields are available in the rivers layer?
Tell us a bit about the
townplaces in your dataset.Open the attribute table for the places layer. Which field would be the most useful to represent in label form, and why?
3.1.3. In Conclusion
You now know how to use the attribute table to see what is actually in the data you’re using. Any dataset will only be useful to you if it has the attributes that you care about. If you know which attributes you need, you can quickly decide if you’re able to use a given dataset, or if you need to look for another one that has the required attribute data.
3.1.4. What’s Next?
Different attributes are useful for different purposes. Some of them can be represented directly as text for the map user to see. You’ll learn how to do this in the next lesson.