20. 練習データを準備する
注釈
このプロセスはコース召集者、または、それらのコースのためにローカライズされたサンプル・データセットをつくりたいより経験あるQGISユーザー向けにしました。デフォルトのデータセットはトレーニングマニュアルとともに提供されていますが、デフォルトのデータセットを置き換えたい場合は、これらの指示に従うことができます。
提供されているサンプルデータ はトレーニングマニュアルと一緒に Swellendam とその周辺の町を指します。 Swellendam は南アフリカの西ケープ州ケープタウンの約2時間の東に位置しています。データセットは英語とアフリカーンス語の両方で地物名を含みます。
誰で無理なくこのデータセットを使用できますが、自分の国や故郷からのデータを使用することを好む方もいるかもしれません。そうすることを選択した場合は、ローカライズされたデータが、モジュール3からモジュール7.2のすべてのレッスンで使用されます。それ以降のモジュールはより複雑なデータソースを使用しており、お住まいの地域ではご使用になれない場合があります。
注釈
以下の手順では、QGISの十分な知識を持っており、教材として使用されることを意図していないと仮定します。
20.1.  Try Yourself Create OSM based vector Files
デフォルトのデータセットをコースのためのローカライズされたデータに置き換えたい場合、QGISに組み込まれたツールを使って簡単に行うことができます。あなたが使おうとする領域は、都市部と農村部の適当な混合地であり、河川や水面、道路、地域の境界(自然保護区や農場など)などが分かれてる必要があります。
QGISプロジェクトを開く
Select to open the Data Source Manager dialog
In the Browser tab, expand the XYZ Tiles drop-down menu and double-click the OpenStreetMap item.
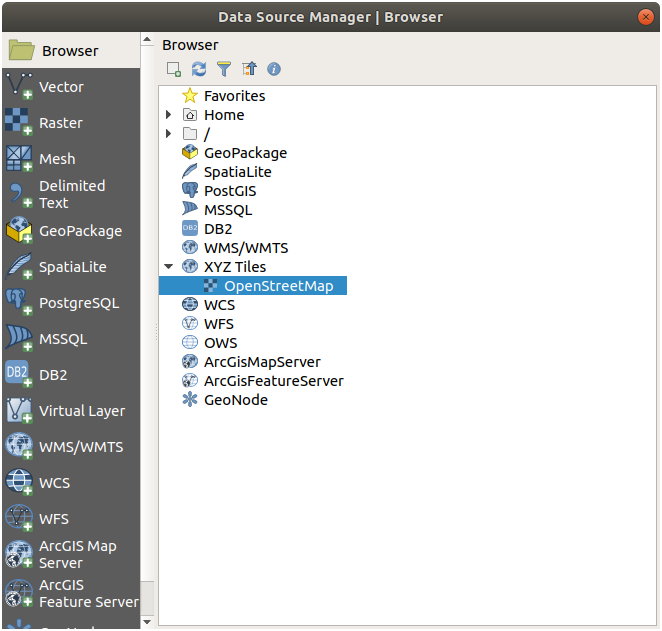
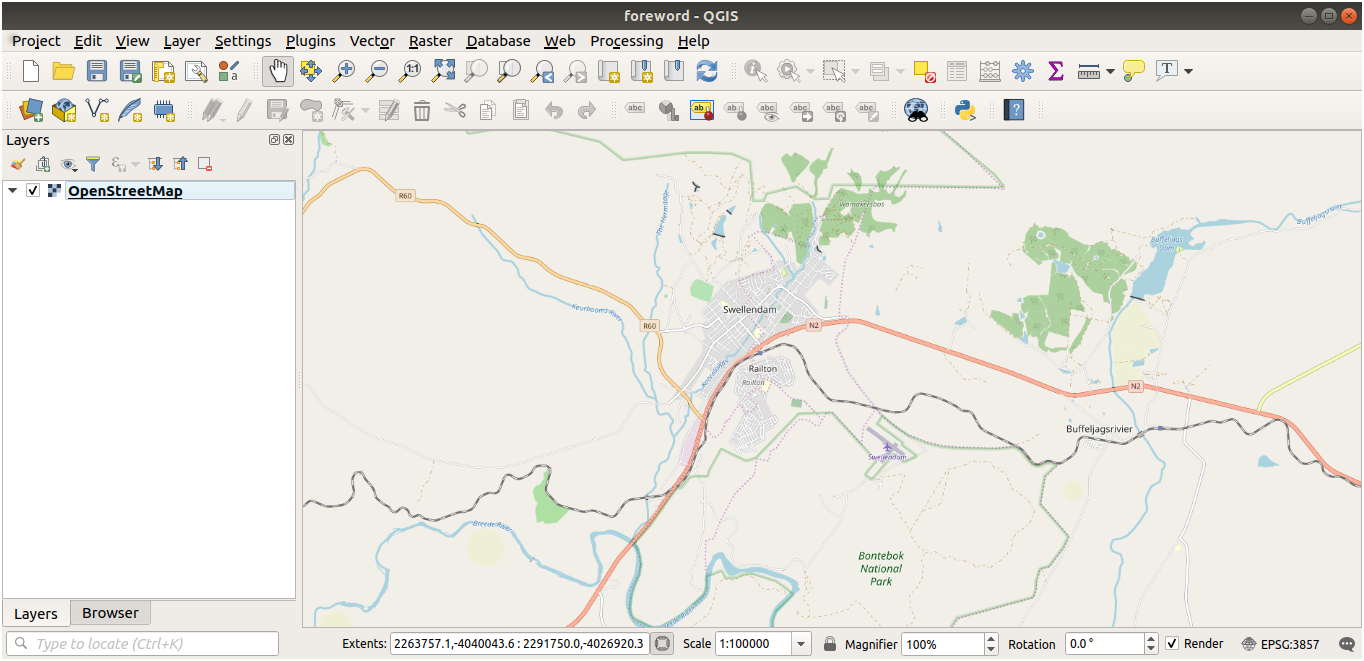
A map of the world is now visible on the map canvas.
Close the Data Source Manager dialog
Move to the area you'd like to use as study area
Now that we have the area we'll extract the data from, let's enable the extraction tools.
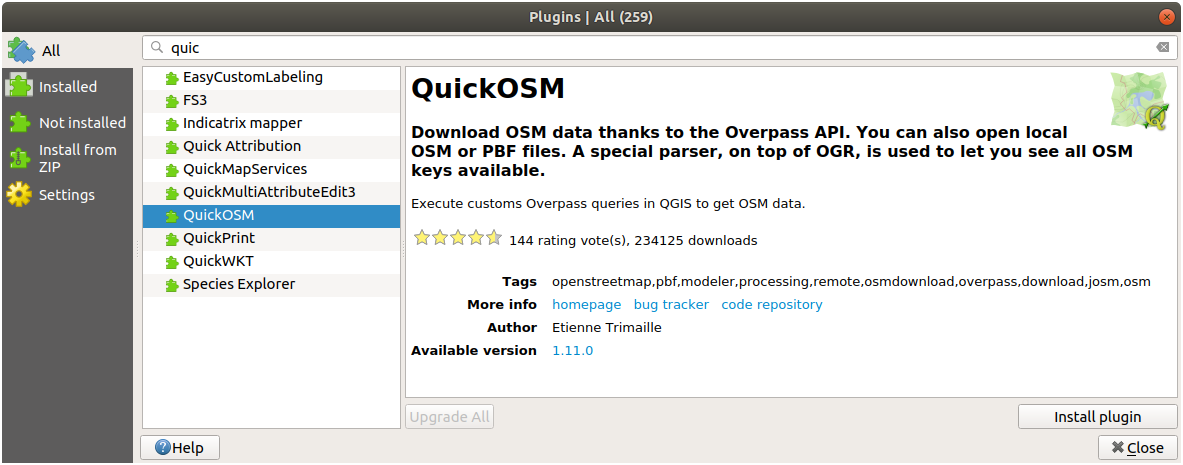
Go to
In the All tab, type
QuickOSMin the search boxSelect the QuickOSM plugin, press Install Plugin and then Close the dialog.
Execute the new plugin from menu
In the Quick query tab, select
buildingin the Key drop-down menuLeave the Value field empty, meaning that you are querying all buildings.
Select Canvas Extent in the next drop-down menu
Expand the Advanced group below and uncheck all geometry types on the right except Multipolygons.
Press Run query
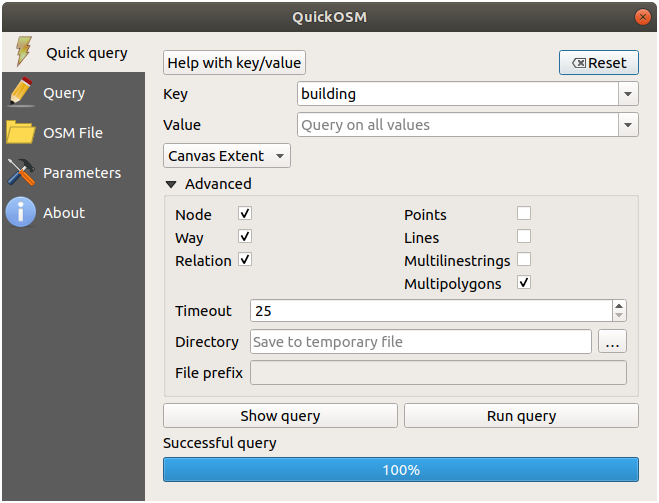
A new
buildinglayer is added to the Layers panel, showing buildings in the selected extent.Proceed as above to extract other data:
Key = landuseandMultipolygonsgeometry type.Key = boundary,Value = protected_areaandMultipolygonsgeometry type.Key = natural,Value = waterandMultipolygonsgeometry type.Key = highwayand checkLinesandMultilinesgeometry types.Key = waterway,Value = riverand checkLinesandMultilinesgeometry types.Key = placeandPointsgeometry type.
This process adds the layers as temporary files (indicated by the
 icon next to their name).

You can sample the data your region contains in order to see what kind of results your region will yield.
We now need to save the resulting data to use during your course. We'll be using ESRI Shapefile, GeoPackage and SpatiaLite formats depending on the data.
To convert the place temporary layer to another format:
Click the
icon next to the place layer
to open the Save Scratch Layer dialog.注釈
If you need to change any of the temporary layer's properties (CRS, extent, fields...), use the contextual menu instead, and ensure the Add saved file to map option is checked. This adds a new layer.
Select the ESRI Shapefile format
Use the ... button to browse to the
exercise_data/shapefile/folder and save the file asplaces.shp.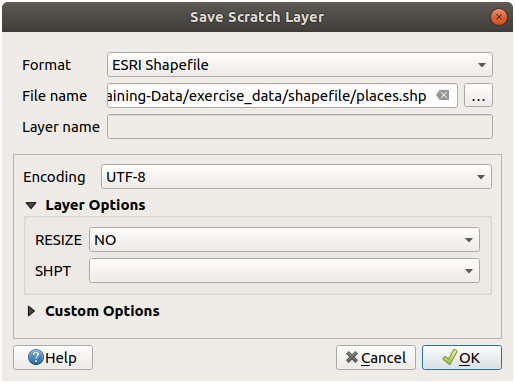
Press OK
In the Layers panel, the temporary place layer is replaced with the saved places shapefile layer and the temporary icon next to it removed.
Double-click the layer to open its tab and update the Layer name property to match the file name.
Repeat the process for other layers, renaming them as follows:
natural_waterintowaterwaterway_riverintoriversboundary_protected_areaintoprotected_areas
Each resulting data set should be saved in the
exercise_data/shapefile/directory.
The next step is to create a GeoPackage file from the building layer to use during the course:
Click the
icon next to the building layerSelect the GeoPackage format
Save the file as
training_data.gpkgunder theexercise_data/folderBy default, the Layer name is filled as the file name. Replace it with
buildings.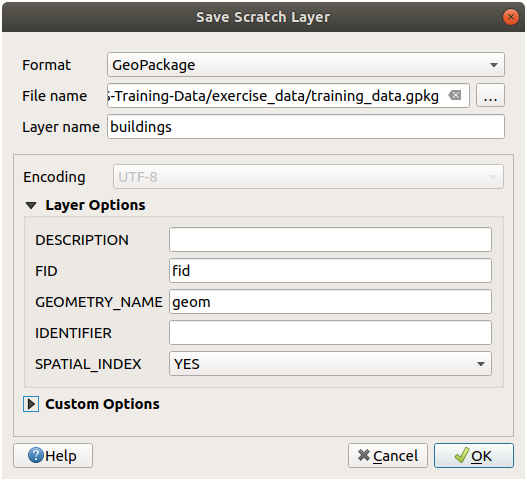
Press OK
Rename the layer in its properties dialog
Repeat the process with the highway layer, saving it as
roadsin the same GeoPackage database.
The last step is to save the remaining temporary file as a SpatiaLite file.
Click the
icon next to the landuse layerSelect the SpatiaLite format
Save the file as
landuse.sqliteunder theexercise_data/folder. By default, the Layer name is filled as the file name. Do not change it.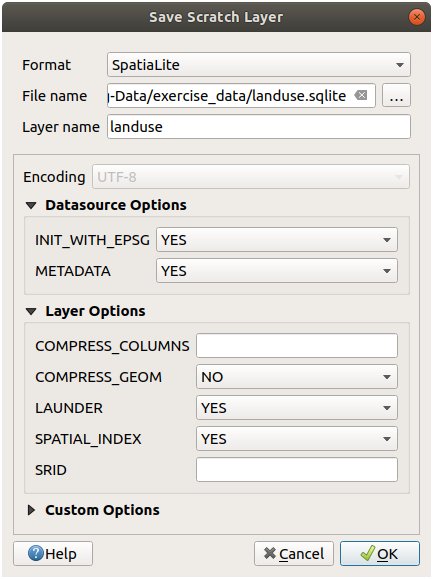
Press OK
You should now have a map which looks something like this (the symbology will certainly be very different, because QGIS randomly assigns colors when layers are added to the map):
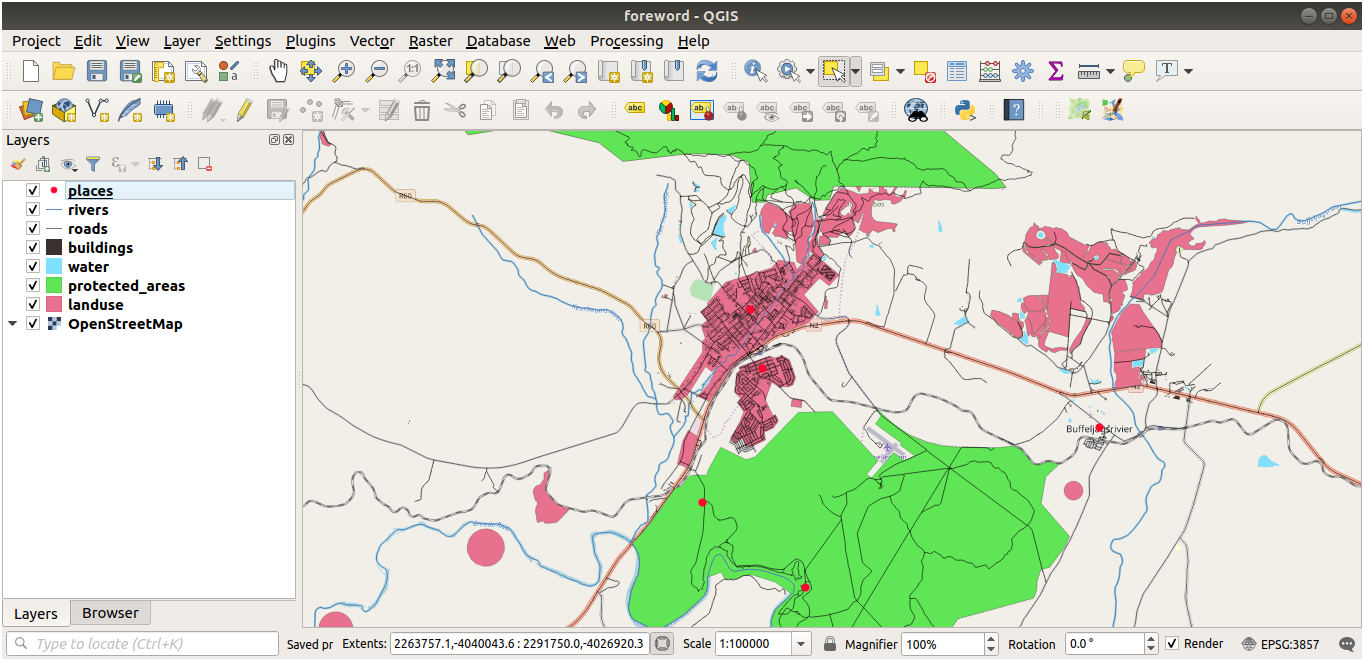
The important thing is that you have 7 vector layers matching those shown above and that all those layers have some data.
20.2. Try Yourself SRTM DEM tiffファイルの作成
For modules Module: ベクターデータを作成する and Module: ラスター, you'll also need raster images (SRTM DEM) which cover the region you have selected for your course.
The CGIAR-CGI provides some SRTM DEM you can download from https://srtm.csi.cgiar.org/srtmdata/.
You'll need images which cover the entire region you have chosen to use.
To find the extent coordinates, in QGIS ,  zoom to the extent of
the largest layer and pick the values in the
zoom to the extent of
the largest layer and pick the values in the  Extents
box of the status bar.
Keep the
Extents
box of the status bar.
Keep the GeoTiff format. Once the form is filled, click on the
Click here to Begin Search >> button and download the file(s).
必要なファイルをダウンロードしたら、それらを raster/SRTM サブフォルダの下の exercise_data ディレクトリに保存する必要があります。
20.3. Try Yourself 画像のTIFFファイルを作成
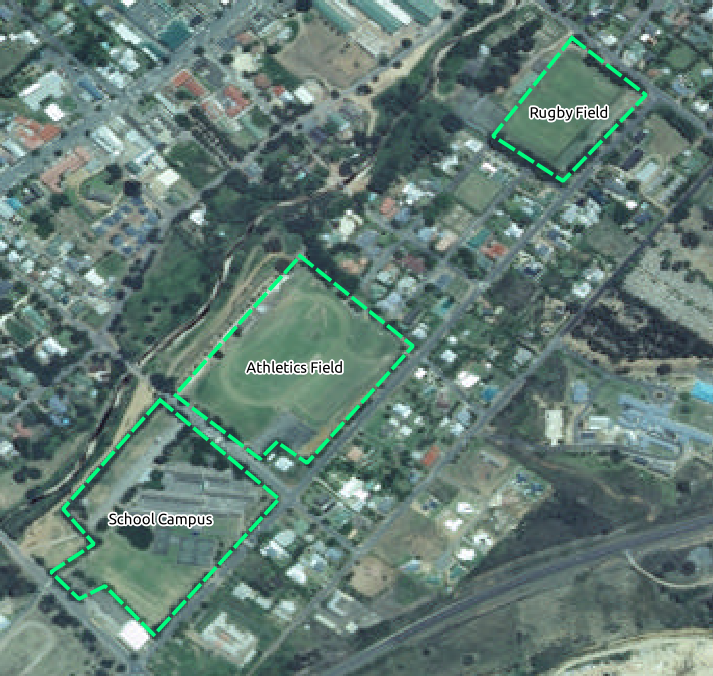
In Module Module: ベクターデータを作成する, Follow Along: データソース lesson shows close-up images of three school sports fields which students are asked to digitize. You'll therefore need to reproduce these images using your new SRTM DEM tiff file(s). There is no obligation to use school sports fields: any three school land-use types can be used (e.g. different school buildings, playgrounds or car parks).
For reference, the image in the example data is:
20.4.  Try Yourself トークンの置き換え
Having created your localised dataset, the final step is to replace the tokens
in the substitutions.txt file so that the appropriate names will appear
in your localised version of the Training Manual.
置き換える必要のあるトークンは次のとおりです:
majorUrbanName: this defaults to "Swellendam". Replace with the name of the major town in your region.schoolAreaType1: this defaults to "athletics field". Replace with the name of the largest school area type in your region.largeLandUseArea: this defaults to "Bontebok National Park". Replace with the name of a large landuse polygon in your region.srtmFileName: this defaults tosrtm_41_19.tif. Replace this with the filename of your SRTM DEM file.localCRS: this defaults toWGS 84 / UTM 34S. You should replace this with the correct CRS for your region.