5.1. Lesson: 新しいベクターデータセットを作成する
使用するデータはどこかから持ってこなければなりません。最も一般的なアプリケーションでは、データがすでに存在しています。しかしプロジェクトがより特化し専門的になるほど、データが既に利用可能であるという可能性が低くなります。このような場合は、自身の新しいデータを作成する必要があります。
このレッスンの目標: 新しいベクターデータセットを作成します。
5.1.1.  Follow Along: レイヤー作成ダイアログ
新しいベクターデータを追加するには、まずそれを追加するためのベクターデータセットが必要です。現在の場合は、既存のデータセットを編集するのではなく、完全に新しいデータを作成して始めましょう。それゆえ、まず自分自身の新しいデータセットを定義する必要があります。
Open QGIS and create a new blank project.
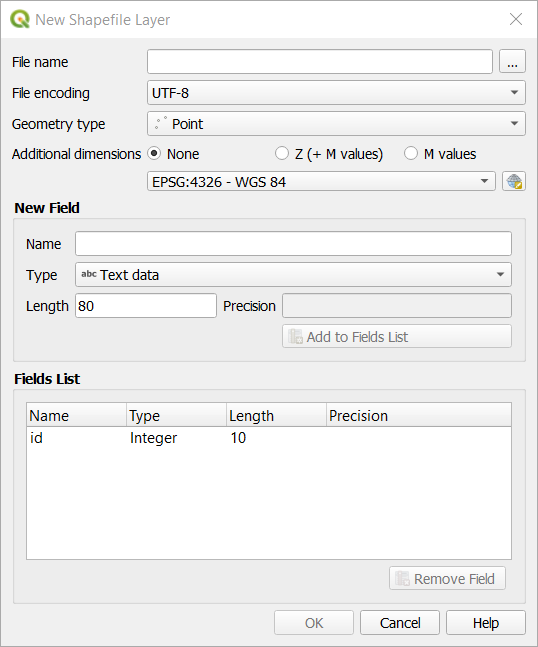
Navigate to and click on the menu entry . You'll be presented with the New Shapefile Layer dialog, which will allow you to define a new layer.
Click ... for the File name field. A save dialog will appear.
Navigate to the
exercise_datadirectory.Save your new layer as
school_property.shp.この段階で欲しいデータセットの種類を決定することが重要です。それぞれの異なるベクターレイヤータイプは、バックグラウンドで「別々に構築」されているので、一度レイヤーを作成したらそのタイプは変更できません。
For the next exercise, we're going to create new features which describe areas. For such features, you'll need to create a polygon dataset.
For Geometry Type, select Polygon from the drop down menu:

これは、ダイアログの残りの部分には影響しませんが、それは、ベクターデータセットが作成されたときにジオメトリの正しいタイプが使用されるようになります。
The next field allows you to specify the Coordinate Reference System, or CRS. CRS is a method of associating numerical coordinates with a position on the surface of the Earth. See the User Manual on Working with Projections to learn more.
For this example we will use the default CRS associated with this project, which is WGS84.

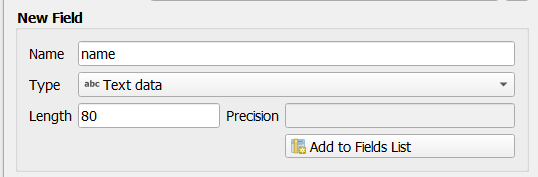
Next there is a collection of fields grouped under New Field. By default, a new layer has only one attribute, the
idfield (which you should see in the Fields list) below. However, in order for the data you create to be useful, you actually need to say something about the features you'll be creating in this new layer. For our current purposes, it will be enough to add one field callednamethat will holdText dataand will be limited to text length of80characters.Replicate the setup below, then click the Add to Fields List button:
ダイアログが次のようになることを確認します。
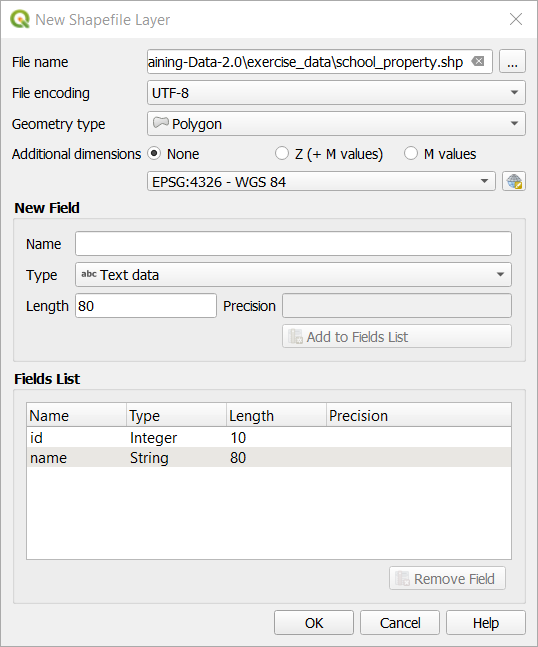
OK をクリックします
The new layer should appear in your Layers panel.
5.1.2. Follow Along: データソース
新しいデータを作成するとき、それは明らかに地上に現実に存在するオブジェクトに関するものである必要があります。そのため、どこかから情報を取得する必要があります。
オブジェクトに関するデータを取得するにはさまざまな方法があります。たとえば、GPSを使用して現実の世界でのポイントをキャプチャし、それからQGISにデータをインポートできます。あるいは、セオドライトを使用してポイントを調査し、新しい地物を作成するために、手動で座標を入力できます。あるいは、デジタル化プロセスを使用して、衛星画像や航空写真などのリモートセンシングデータからオブジェクトをトレースできます。
現在の例では、デジタル化のアプローチを使用しているでしょう。必要に応じてそれらをインポートする必要がありますので、サンプルラスターデータセットが提供されます。
Click on
 Data Source Manager button.
Select
 Raster on the left side.
In the Source panel, click on the ... button:
Navigate to
exercise_data/raster/.Select the file
3420C_2010_327_RGB_LATLNG.tif.Click Open to close the dialogue window.
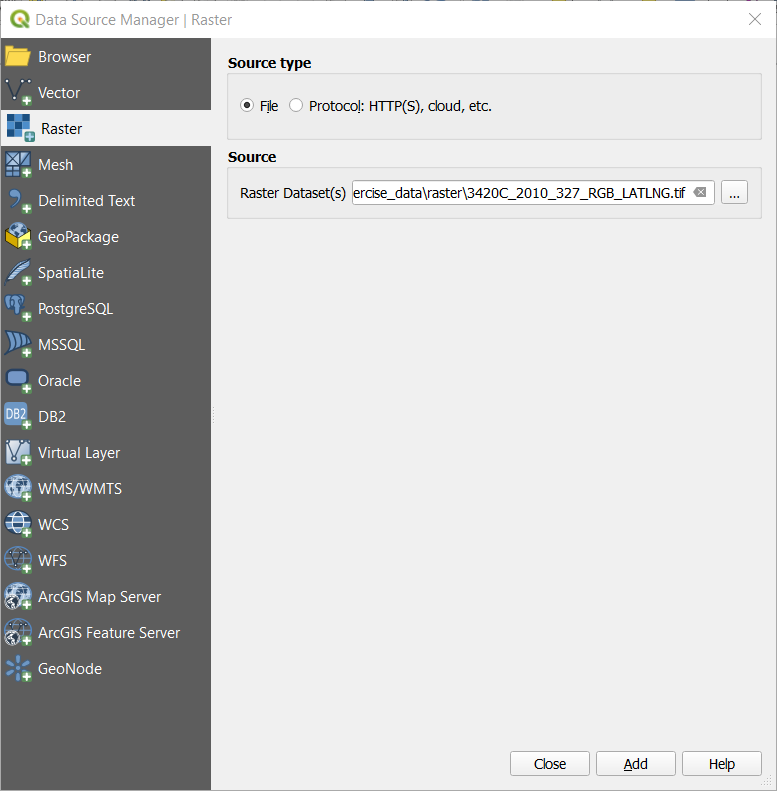
Click Add and Close. An image will load into your map.
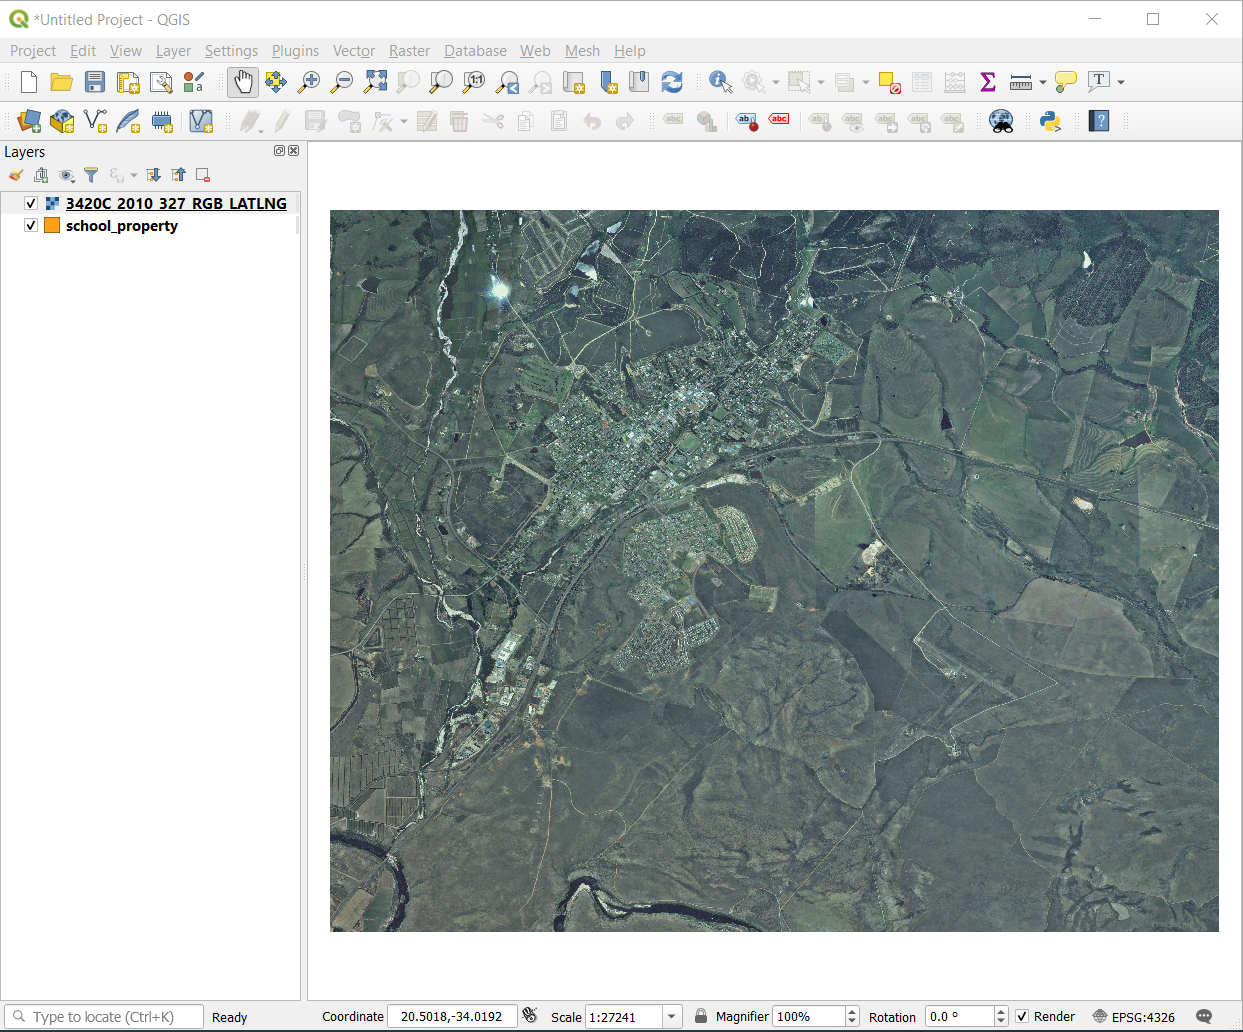
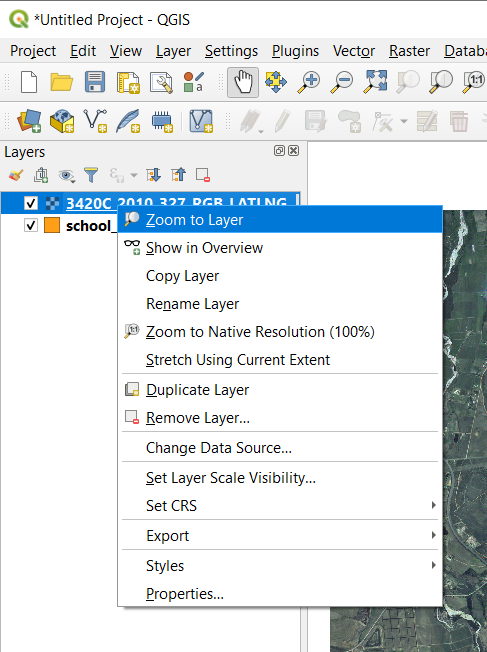
If you don't see an aerial image appear, select the new layer, right click, and choose Zoom to Layer in the context menu.
Click on the
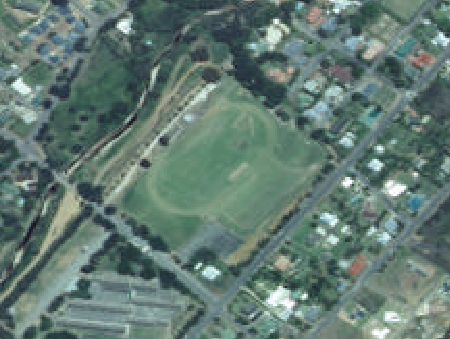
 Zoom In button, and zoom to the area highlighted in blue below:
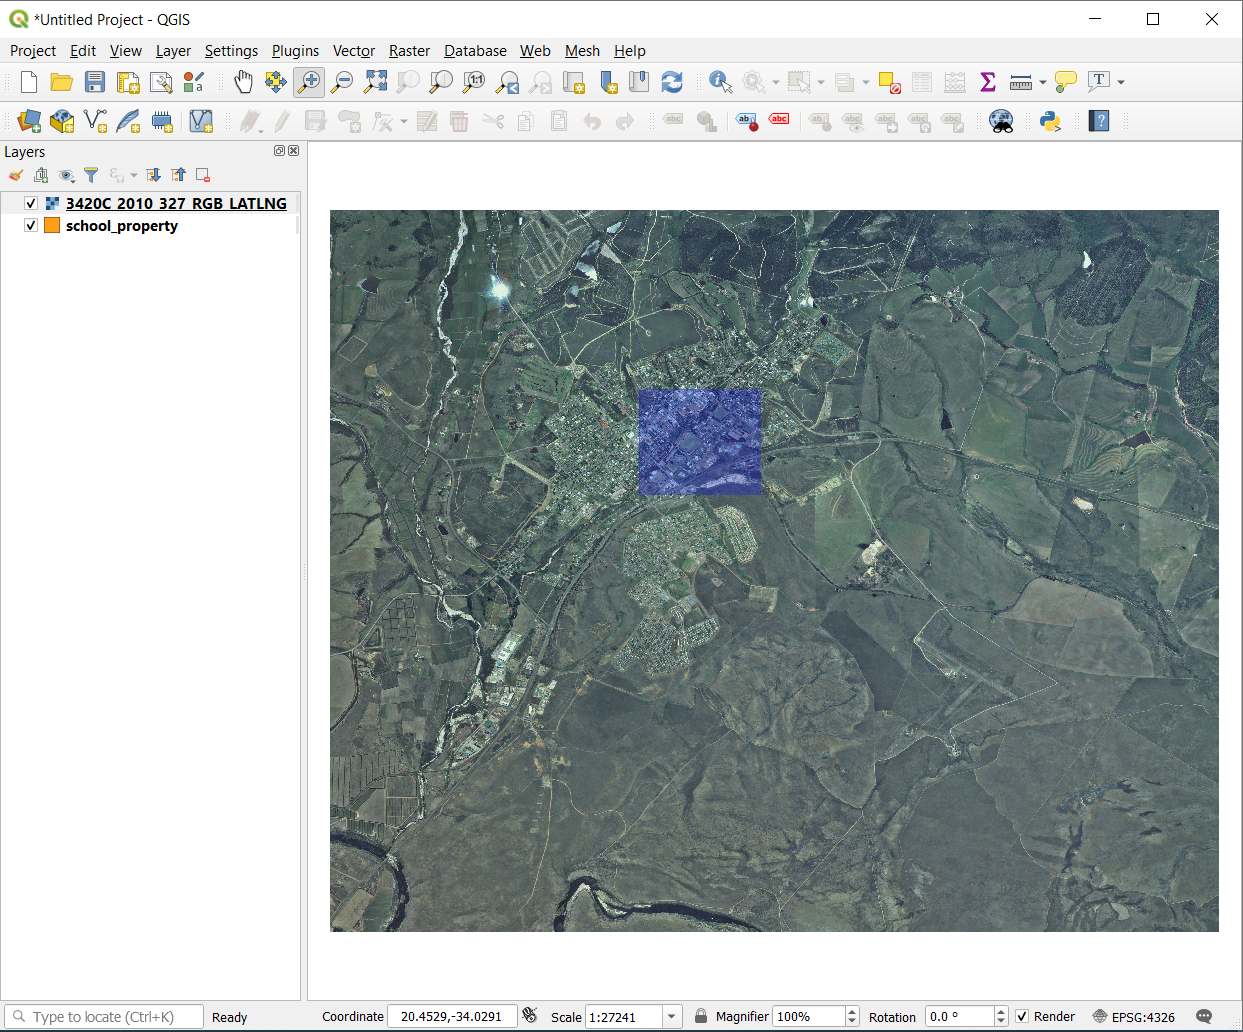
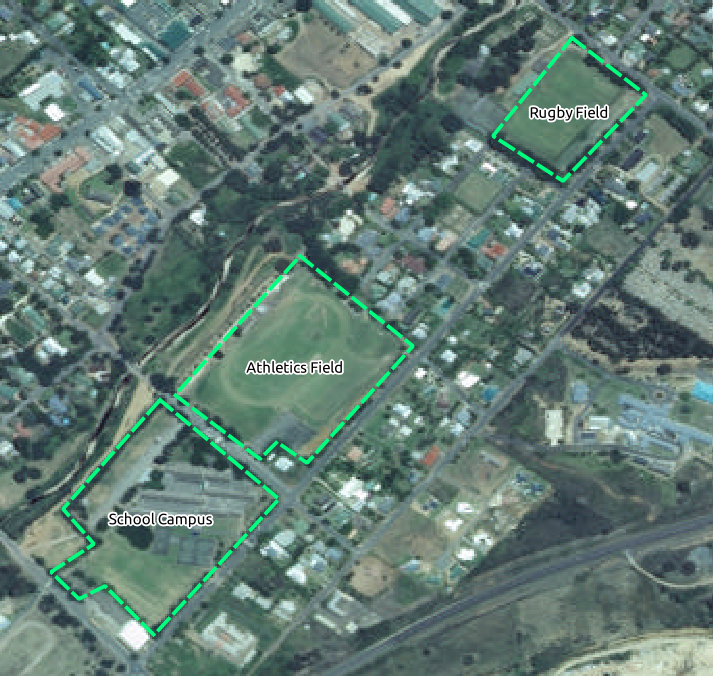
Now you are ready to digitize these three fields:
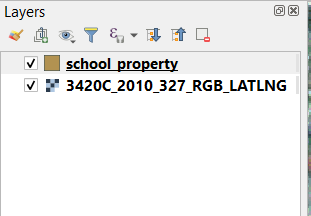
Before starting to digitize, let's move the school_property layer above the aerial image.
Select
school_propertylayer in the Layers pane and drag it to the top.
デジタル化を開始するためには、 編集モード に入る必要があります。GISソフトウェアでは一般的に、重要なデータを誤って編集したり削除することを防ぐために、これが必要とされます。編集モードは、レイヤごとに個別にオンまたはオフに切り替えられます。
To enter edit mode for the school_property layer:
Click on the
school_propertylayer in the Layers panel to select it.Click on the
 Toggle Editing button.
このボタンを見つけることができない場合は、 デジタイズ ツールバーが有効になっているか確認してください。 メニューエントリ の横にチェックマークがあるはずです。
As soon as you are in edit mode, you'll see that some digitizing tools have become active:
 Capture Polygon
 Vertex Tool
Other relevant buttons are still inactive, but will become active when we start interacting with our new data.
Notice that the layer
school_propertyin the Layers panel now has the pencil icon, indicating that it is in edit mode.Click on the
Capture Polygon button to begin digitizing
our school fields.You'll notice that your mouse cursor has become a crosshair. This allows you to more accurately place the points you'll be digitizing. Remember that even when you're using the digitizing tool, you can zoom in and out on your map by rolling the mouse wheel, and you can pan around by holding down the mouse wheel and dragging around in the map.
デジタル化している第1の地物は athletics field です:
どこかのフィールドの縁に沿ってポイントをクリックすることで、デジタル化を開始します。
描画しているシェイプがフィールドを完全にカバーするまで、縁に沿ってさらにクリックすることにより、より多くのポイントを置きます。
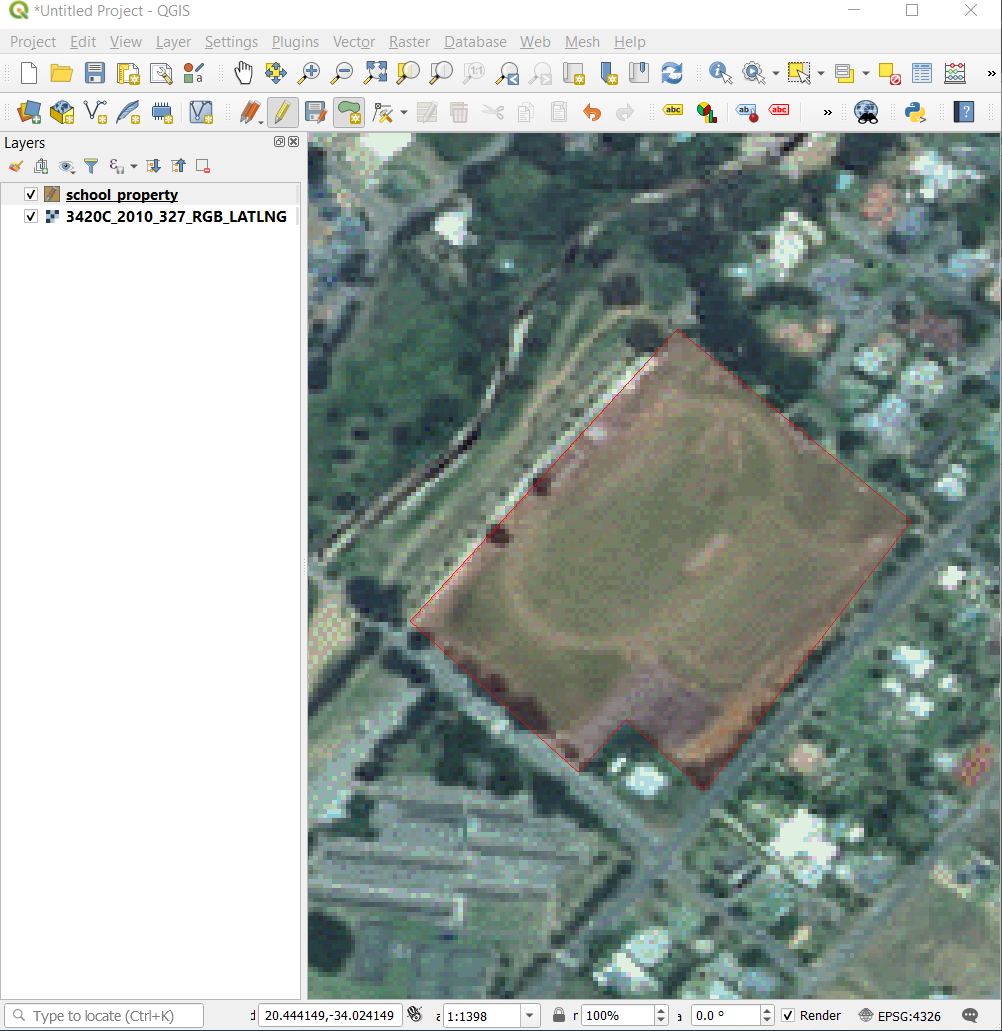
After placing your last point, right click to finish drawing the polygon. This will finalize the feature and show you the Attributes dialog.
値を以下のように埋めます:
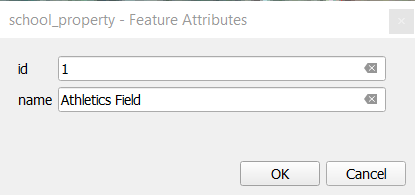
Click OK, and you have created a new feature!
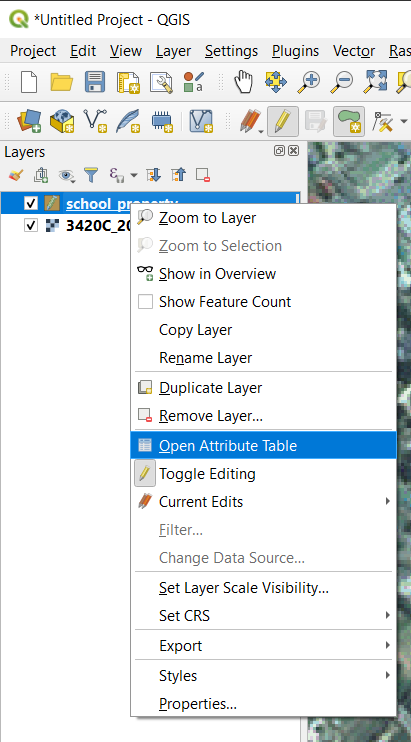
In the Layers panel select the
school_propertylayer.Right click and choose Open Attribute Table in the context menu.
In the table you will see the feature you just added. While in edit mode you can update the attributes data by double click on the cell you want to update.
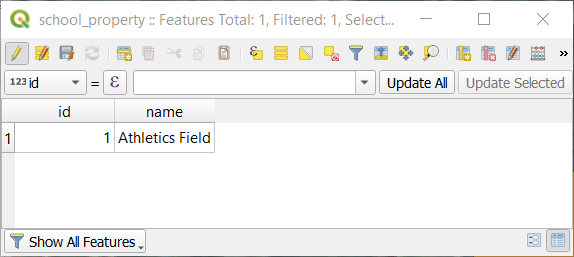
属性テーブルを閉じます。
To save the new feature we just created, click on
 Save Edits button.
地物をデジタル化しているときにミスを犯してしまった場合、作成が終わった後で常にそれを編集できることを覚えておいてください。ミスをしてしまった場合は、上記のような地物を作成し終わるまで、デジタル化を継続します。その後:
Click on
Vertex Tool button.Hover the mouse over a vertex you want to move and left click on the vertex.
Move the mouse to the correct location of the vertex, and left click. This will move the vertex to the new location.
The same procedure can be used to move a line segment, but you will need to hover over the midpoint of the line segment.
If you want to undo a change, you can press the
 Undo button or Ctrl+Z.
Remember to save your changes by clicking the
Save Edits button.When done editing, click the
Toggle Editing button
to get out of edit mode.
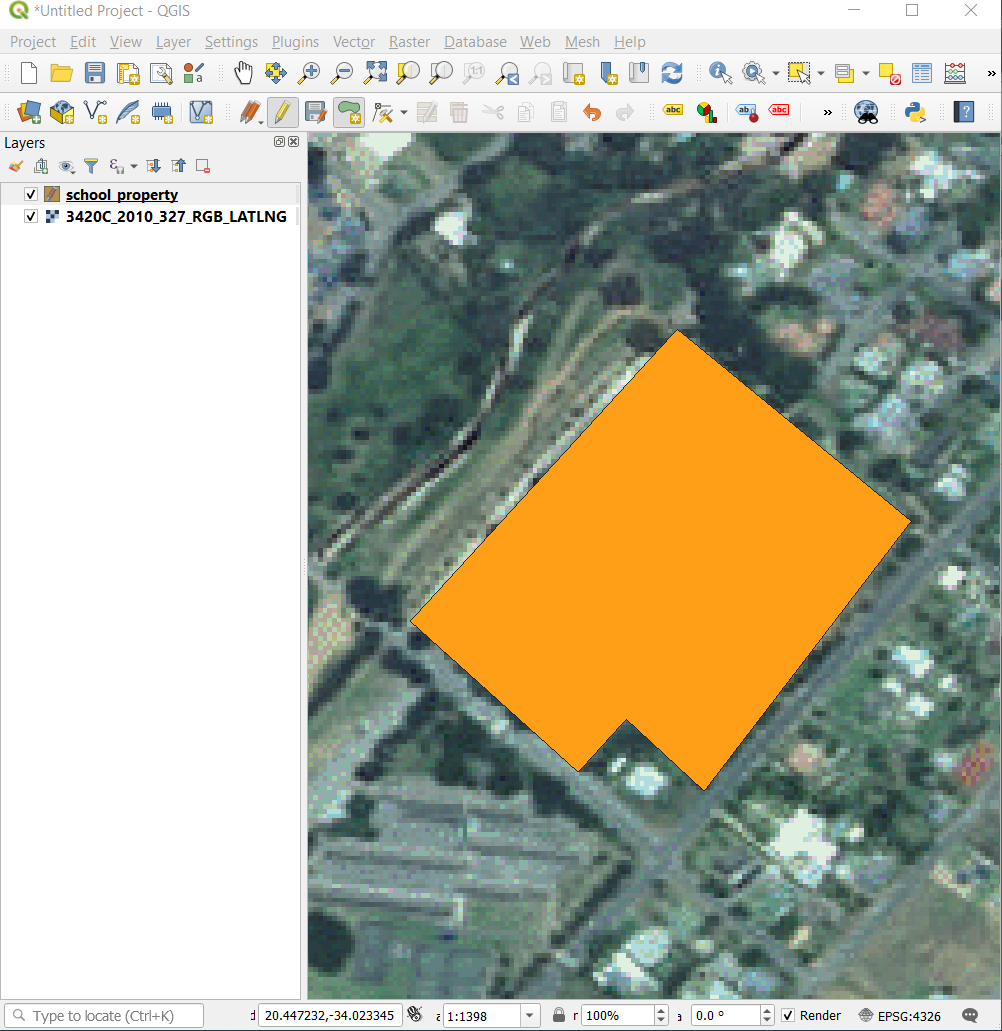
5.1.3. Try Yourself Digitizing Polygons
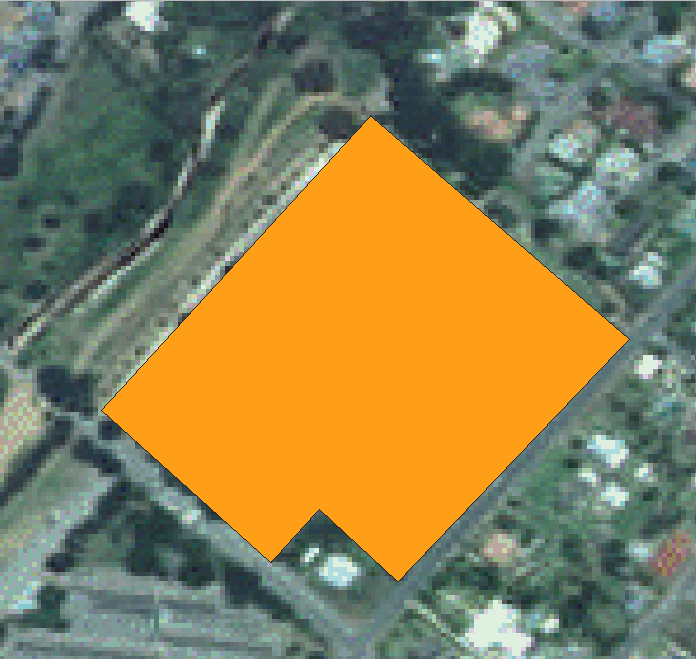
学校自体と上のフィールドをデジタル化します。デジタル化を支援するためにこの画像を使用します:
Remember that each new feature needs to have a unique id value!
注釈
レイヤーに地物を追加し終わったら、編集内容を保存して、編集モードを終了することを忘れないでください。
注釈
You can style the fill, outline and label placement and formatting
of the school_property using techniques learnt in earlier
lessons.
5.1.4.  Follow Along: Using Vertex Editor Table
Another way to edit a feature is to manually enter the actual coordinate values for each vertex using the Vertex Editor table.
Make sure you are in edit mode on layer
school_property.If not already activated, click on
Vertex Tool button.Move the mouse over one of the polygon features you created in the
school_propertylayer and right click on it. This will select the feature and a Vertex Editor pane will appear.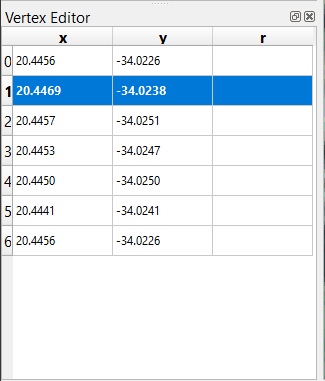
注釈
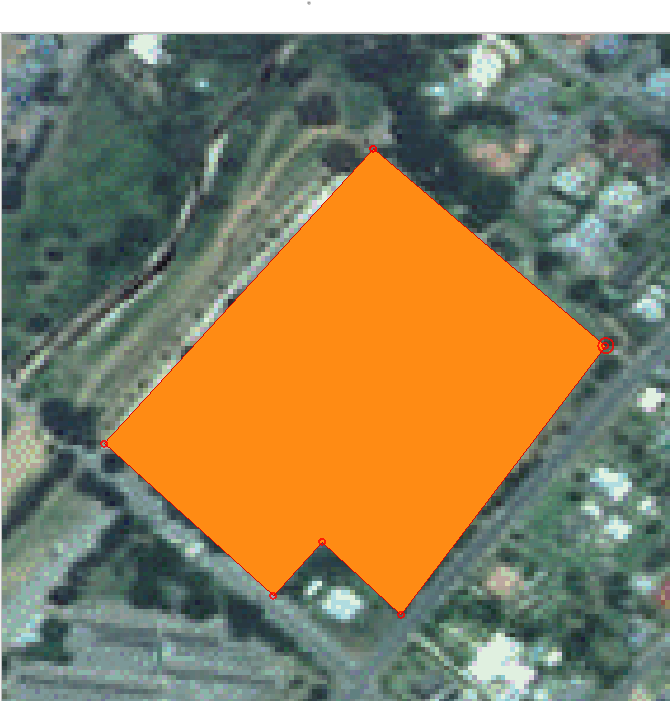
This table contains the coordinates for the vertices of the feature. Notice there are seven vertices for this feature, but only six are visually identified in the map area. Upon closer inspection, one will notice that row 0 and 6 have identical coordinates. These are the start and end vertices of the feature geometry, and are required in order to create a closed polygon feature.
Click and drag a box over a vertex, or multiple vertices, of the selected feature.
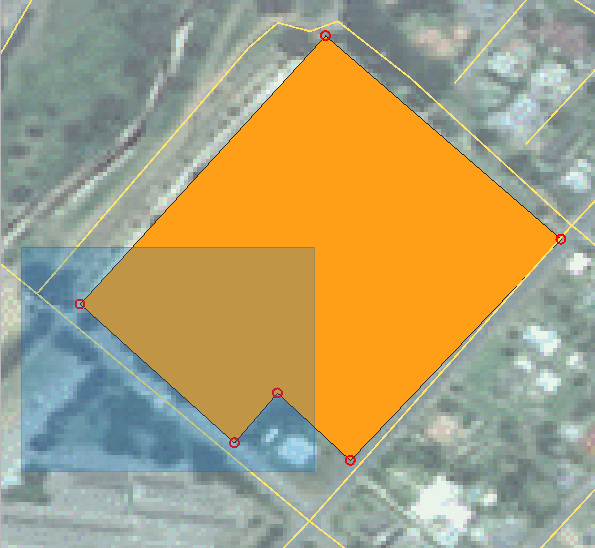
The selected vertices will change to a color blue and the Vertex Editor table will have the corresponding rows highlighted, which contain the coordinates of the vertices.

To update a coordinate, double left click on the cell in the table that you want to edit and enter the updated value. In this example, the x coordinate of row
4is updated from20.4450to20.4444.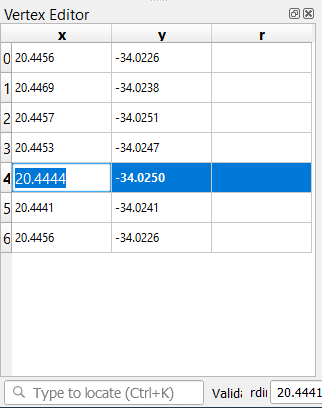
After entering the updated value, hit the enter key to apply the change. You will see the vertex move to the new location in the map window.
When done editing, click the
Toggle Editing
button to get out of edit mode, and save your edits.
5.1.5. Try Yourself Digitizing Lines
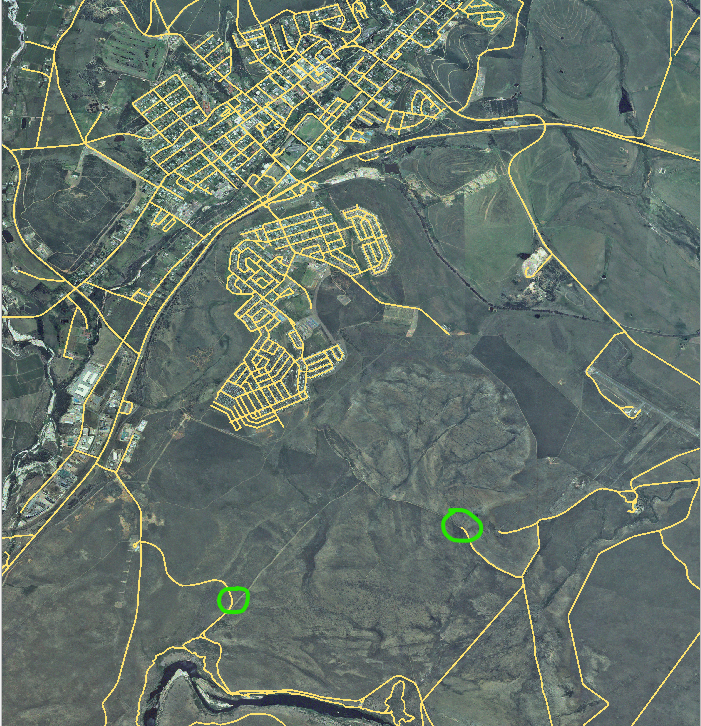
We are going to digitize two routes which are not already marked on the roads layer; one is a path, the other is a track. Our path runs along the southern edge of the suburb of Railton, starting and ending at marked roads:
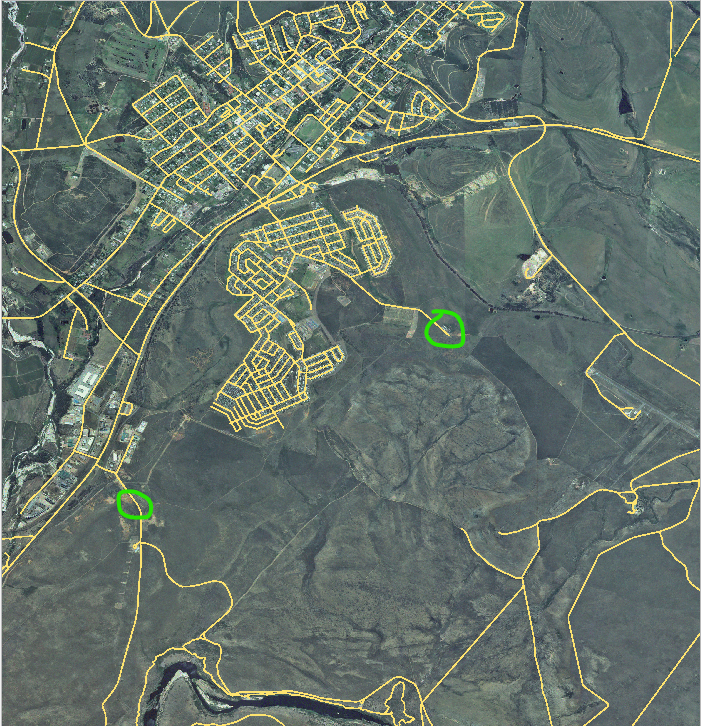
トラックはさらにもう少し南へ:
If the roads layer is not yet in your map, then add the
roadslayer from the GeoPackage filetraining-data.gpkgincluded in theexercise_datafolder of the training data you downloaded. You can read Follow Along: Loading vector data from a GeoPackage Database for a how-to.Create a new ESRI Shapefile line dataset called
routes.shpin theexercise_datadirectory, with attributesidandtype(use the approach above to guide you.)Activate edit mode on the routes layer.
Since you are working with a line feature, click on the
 Add Line button to initiate line
digitizing mode.
Add Line button to initiate line
digitizing mode.One at a time, digitize the path and the track on the
routeslayer. Try to follow the routes as accurately as possible, adding additional points along corners or turns.Set the
typeattribute value topathortrack.Use the Layer Properties dialog to add styling to your routes. Feel free to use different styles for paths and tracks.
Save your edits and toggle off editing mode by pressing the
Toggle Editing button.
5.1.6. In Conclusion
これで地物を作成する方法がわかりましたね!このコースではポイント地物の追加についてカバーしていませんが、より複雑な地物(ラインとポリゴン)で作業してきましたから実際に必要ありません。ポイントを置きたいところを1回クリックし、いつものように属性を与え、その後地物が作成されること以外、まったく同じ動作です。
デジタル化はGISプログラムでは非常に一般的な活動ですので、方法を知ることは重要です。
5.1.7. What's Next?
Features in a GIS layer aren't just pictures, but objects in space. For example, adjacent polygons know where they are in relation to one another. This is called topology. In the next lesson you'll see an example of why this can be useful.