Creating an Output
The figure below shows an example of print layout including each type of layout items described in the previous section.
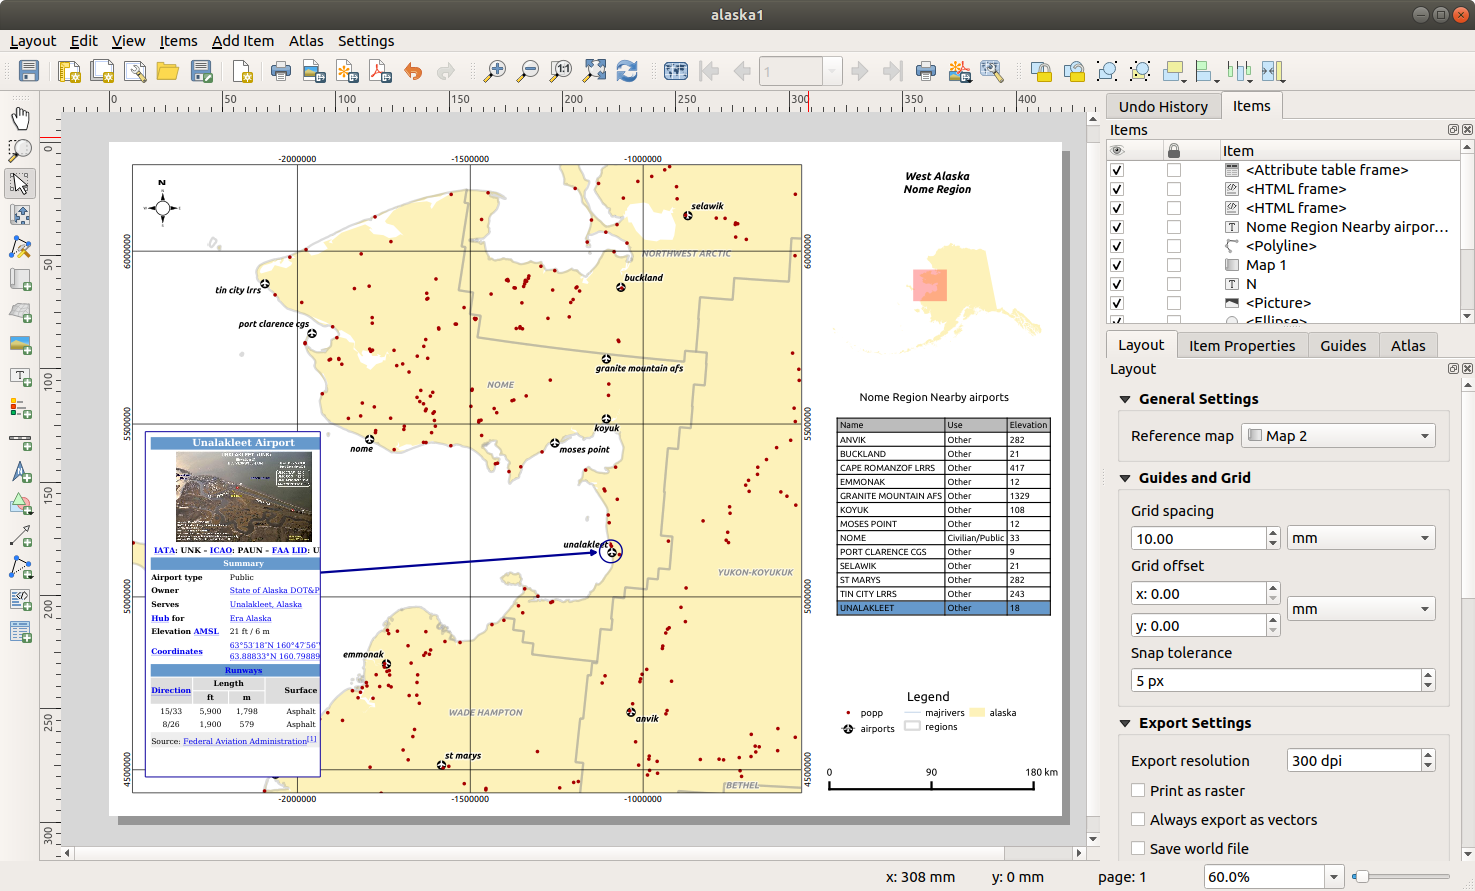
Print Layout with map view, legend, image, scale bar, coordinates, text and HTML frame added
From the menu or toolbar, you can output the print layout to different file formats, and it is possible to modify the resolution (print quality) and paper size:
The
 Print icon allows you to print the layout to a
connected printer or a PostScript file, depending on installed printer drivers.
Print icon allows you to print the layout to a
connected printer or a PostScript file, depending on installed printer drivers.The
 Export as image icon exports the print layout
in several image formats such as
Export as image icon exports the print layout
in several image formats such as PNG,BMP,TIF,JPG, and many others…The
 Export as SVG icon saves the print layout
as an
Export as SVG icon saves the print layout
as an SVG(Scalable Vector Graphic).The
 Export as PDF icon saves the defined print layout
directly as a
Export as PDF icon saves the defined print layout
directly as a PDF.
Export settings
Whenever you export a print layout, there are a selection of export settings QGIS needs to check in order to return the most appropriate output. These configurations are:
the Export settings of the Layout panel, such as Export resolution, Print as raster, Always export as vectors or Save world file;
the Exclude page from exports in the page item properties panel;
the Exclude item from exports in the item properties panel.
Export as Image
Clicking the Export as image icon will ask you to
select the image format and enter the filename to use to export the print layout:
in the case of multi-page composition, each page will be exported to a file with
the given name appended with the page number.
In the next Image Export Options dialog, you can optionally override the print layout resolution and the exported page dimensions (set in Layout panel).
By checking  Crop to content option, the image output
by the layout will include the minimal area enclosing all the items (map,
legend, scale bar, shapes, label, image…) of each page of the composition:
Crop to content option, the image output
by the layout will include the minimal area enclosing all the items (map,
legend, scale bar, shapes, label, image…) of each page of the composition:
If the composition includes a single page, then the output is resized to include EVERYTHING on the composition. The page can then be reduced or extended to all items depending on their position (on, above, below, left or right of the page).
In case of a multi-page layout, each page will be resized to include items in its area (left and right sides for all pages, plus top for the first page and bottom for the last page). Each resized page is exported to a separate file.
The Crop to content dialog also allows to add some margins around the cropped bounds.
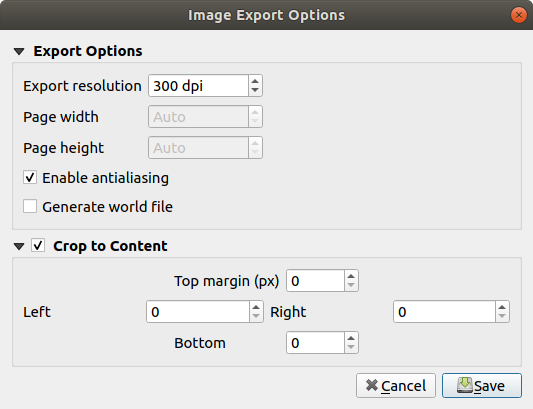
Image Export Options, output is resized to items extent
Tip
Use image formats that support transparency when items extend beyond the paper extent
Since layout items may be placed outside the paper extent, using the Crop
to content option while exporting can result in an image that extends beyond the paper extent.
Since the background outside of the paper extent will be transparent, for image
formats that do not support transparency (eg, .BMP, .JPG) it
will be rendered as full black,
“corrupting” the image.
Use transparency-compatible formats like .TIFF or .PNG in such
a case.
If you need to export your layout as a georeferenced image (e.g., to share
with other projects), check the  Generate world file
option and a world file named like the page on which the map reference set in
Layout panel is placed will be created along the export(s).
This option can also be checked by default in the layout panel.
Generate world file
option and a world file named like the page on which the map reference set in
Layout panel is placed will be created along the export(s).
This option can also be checked by default in the layout panel.
When needed, images rendering can also be improved with the Enable antialiasing option.
Export as SVG
With Export as SVG, you also need to fill the filename (used
as a basename for all files in case of multi-page composition) and then can
apply Crop to content option.
The SVG export options dialog also allows to override the layout default export and offers other settings:
- Export map layers as SVG groups: may affect label
placement.
- Render map labels as outlines: unchecking this will
allow you to edit labels as texts in vector illustration software.
- Always export as vectors: some rendering options
require items to be rasterized for a better rendering. Check this option to
keep the objects as vectors with the risk that the appearance of the output
file may not match the print layout preview (for more details, see
Export settings).
- Export RDF metadata.
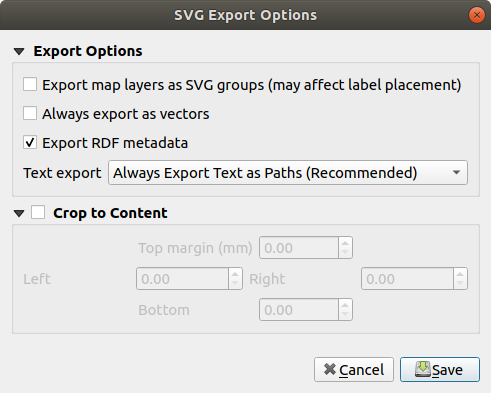
SVG Export Options
Note
Currently, the SVG output is very basic. This is not a QGIS problem, but a problem with the underlying Qt library. This will hopefully be sorted out in future versions.
Export as PDF
The Export as PDF tool exports all the composition pages
into a single PDF file you’d need to provide path and name.
Unlike the other formats, exporting to .PDF does not provide means to
override the layout export settings. So check these settings to ensure they are compatible with your needs.
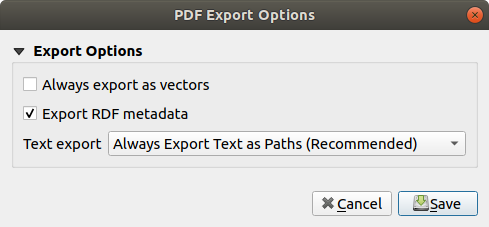
PDF Export Options
Note
Exporting a print layout to formats like .PDF or .TIFF
creates a georeferenced output (no world file needed) by default.
Generate an Atlas
Atlas functions allow you to create map books in an automated way. Atlas uses the features of a vector or table layer called coverage layer and creates an output for each atlas feature. The most common usage is to zoom a map item to the current atlas feature. Further use cases include:
a map item showing, for another layer, only features that share the same attribute as the atlas feature or are within its geometry;
a label or html item whose text is replaced as features are iterated over;
a table item showing attributes of associated parent or children features of the current atlas feature…
For each feature, an output is processed for all pages and items according to their exports settings.
Tip
Use variables for more flexibility
QGIS provides a large panel of functions and variables, including atlas related ones, that you can use to manipulate the layout items but also the layers symbology according to atlas status. Combining these features gives you a lot of flexibility and helps you easily produce advanced mappings.
To enable the generation of an atlas and access atlas parameters, refer to the Atlas panel. This panel contains the following functionalities (see figure_layout_atlas):
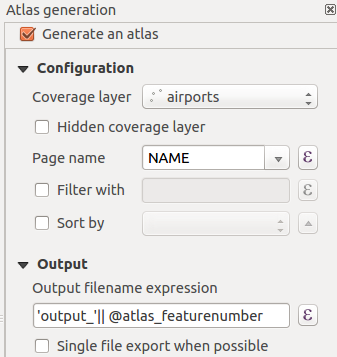
Atlas Panel
- Generate an atlas, which enables or disables the atlas
generation;
A Coverage layer
 combo box that allows you to
choose the table or vector layer containing the features to iterate over;
combo box that allows you to
choose the table or vector layer containing the features to iterate over;An optional
Hidden coverage layer that, if checked,
will hide the coverage layer (but not the other layers) during the generation;An optional Page name combo box to give a more explicit name to each feature page(s) when previewing atlas. You can select a field of the coverage layer or set an expression. If this option is empty, QGIS will use an internal ID, according to the filter and/or the sort order applied to the layer;
An optional Filter with text area that allows you to specify an expression for filtering features from the coverage layer. If the expression is not empty, only features that evaluate to
Truewill be processed;An optional
Sort by that allows you to
sort features of the coverage layer, using a field of the coverage layer or
an expression. The sort order (either ascending or descending) is set by the
two-state Sort direction button that displays an up or a down arrow.
You also have options to set the output of the atlas:
An Output filename expression textbox that is used to generate a filename for each geometry if needed. It is based on expressions. This field is meaningful only for rendering to multiple files;
A
Single file export when possible that allows you to
force the generation of a single file if this is possible with the chosen output
format (PDF, for instance). If this field is checked, the value of the
Output filename expression field is meaningless;An Image export format drop-down list to select the output format when using the
Export atlas as Images… button.
Control map by atlas
The most common usage of atlas is with the map item, zooming to the current atlas feature, as iteration goes over the coverage layer. This behavior is set in the Controlled by atlas group properties of the map item. See Controlled by atlas for different settings you can apply on map item.
Customize labels with expression
In order to adapt labels to the feature the atlas iterates over, you can
include expressions. What you should take care of is to place expression part
(including functions, fields or variables) between [% and %] (see
The Label Item for more details).
For example, for a city layer with fields CITY_NAME and ZIPCODE, you could insert this:
The area of [% concat( upper(CITY_NAME), ',', ZIPCODE, ' is ',
format_number($area/1000000, 2) ) %] km2
or, another combination:
The area of [% upper(CITY_NAME)%],[%ZIPCODE%] is
[%format_number($area/1000000,2) %] km2
The information [% concat( upper(CITY_NAME), ',', ZIPCODE, ' is ', format_number($area/1000000, 2) ) %]
is an expression used inside the label. Both expressions would result in the
generated atlas as:
The area of PARIS,75001 is 1.94 km2
Explore Data-defined override buttons with atlas
There are several places where you can use a  Data defined
override button to override the selected setting. These options are
particularly useful with atlas generation. See Data defined override setup for more
details on this widget.
Data defined
override button to override the selected setting. These options are
particularly useful with atlas generation. See Data defined override setup for more
details on this widget.
For the following examples the Regions layer of the QGIS sample
dataset is used and selected as coverage layer for the atlas generation.
We also assume it’s a single page layout containing a map and a label items.
When the height (north-south) of the extents of a region is greater
than its width (east-west), you rather want to use Portrait instead of
Landscape orientation to optimize the use of paper. With a
Data Defined Override button you can dynamically set the paper
orientation.
Right-click on the page and select Page Properties to open the
panel. We want to set the orientation dynamically, using an expression
depending on the region geometry so press the button of
field Orientation, select Edit… to open the
Expression string builder dialog and enter the following expression:
CASE WHEN bounds_width(@atlas_geometry) > bounds_height(@atlas_geometry)
THEN 'Landscape' ELSE 'Portrait' END
Now if you preview the atlas, the paper orients itself
automatically but items placement may not be ideal. For each Region you need to
reposition the location of the layout items as well. For the map item you can
use the button of its Width property to set it
dynamic using following expression:
@layout_pagewidth - 20
Likewise, use the button of the Height property to
provide following expression and constrain map item size:
@layout_pageheight - 20
To ensure the map item is centered in the page, set its Reference
point to the upper left radio button and enter 10 for its X
and Y positions.
Let’s add a title above the map in the center of the page. Select the label
item and set the horizontal alignment to  Center.
Next move the label to the right position, activate from Reference
point any of the middle buttons, and provide the following expression for
field X:
Center.
Next move the label to the right position, activate from Reference
point any of the middle buttons, and provide the following expression for
field X:
@layout_pagewidth / 2
For all other layout items you can set the position in a similar way so they are correctly positioned when the page is automatically rotated in portrait or landscape. You can also do more tweaks such as customizing the title with feature attributes (see Customize labels with expression example), updating images with atlas feature, resizing the legend columns number according to page orientation…
Information provided is an update of the excellent blog (in English and Portuguese) on the Data Defined Override options Multiple_format_map_series_using_QGIS_2.6 .
This is just one example of how you can use some advanced settings with atlas.
Preview and generate an atlas

Atlas Preview toolbar
Once the atlas settings have been configured and layout items (map, table,
image…) linked to it, you can create a preview of all the pages by clicking
or  Preview Atlas icon.
You can then use the arrows in the same toolbar to navigate through all the
features:
Preview Atlas icon.
You can then use the arrows in the same toolbar to navigate through all the
features:
 First feature
 Previous feature
 Next feature
 Last feature
You can also use the combo box to directly select and preview a specific feature. The combo box shows atlas features name according to the expression set in the atlas Page name option.
As for simple compositions, an atlas can be generated in different ways (see Creating an Output for more information). Instead of menu, rather use tools from menu or toolbar.
This means that you can directly print your compositions with .
You can also create a PDF using :
You will be asked for a directory to save all the generated PDF files,
except if the Single file export when possible has been
selected. In that case, you’ll be prompted to give a filename.
With or tool, you’re also prompted to select a folder. Each page of each atlas feature composition is exported to the image file format set in Atlas panel or to SVG file.
Tip
Print a specific atlas feature
If you want to print or export the composition of only one feature of the atlas, simply start the preview, select the desired feature in the drop-down list and click on (or to any supported file format).
Use project defined relations for atlas creation
For users with HTML and Javascript knowledge it’s possible to operate on GeoJSON objects and use project defined relations from the QGIS project. The difference between this approach and using expressions directly inserted into the HTML is that it gives you a full, unstructured GeoJSON feature to work with. This means that you can use the existing Javascript libraries and functions which operate on GeoJSON feature representations.
The following code includes all related child features from the defined relation.
Using the JavaScript setFeature function it allows you to make flexible HTML
which represents relations in whatever format you like (lists, tables, etc).
In the code sample, we create a dynamic bullet list of the related child features.
// Declare the two HTML div elements we will use for the parent feature id
// and information about the children
<div id="parent"></div>
<div id="my_children"></div>

<script type="text/javascript">
   function setFeature(feature)
   {
   // Show the parent feature's identifier (using its "ID" field)
   document.getElementById('parent').innerHTML = feature.properties.ID;
   //clear the existing relation contents
   document.getElementById('my_children').innerHTML = '';
   feature.properties.my_relation.forEach(function(child_feature) {
   // for each related child feature, create a list element
   // with the feature's name (using its "NAME" field)
      var node = document.createElement("li");
      node.appendChild(document.createTextNode(child_feature.NAME));
      document.getElementById('my_children').appendChild(node);
      });
   }
</script>
During the atlas creation there will be an iteration over the coverage layer containing the parent features. On every page, you will see a bullet list of the related child features following the parent’s identifier.