重要
Translation is a community effort you can join. This page is currently translated at 27.20%.
11.1. 2D地图视图
2D地图视图(也称为**地图画布**)位于窗口的中心,用于显示地图。QGIS启动后默认打开一个以2D方式显示图层的地图视图(称为``主地图``),靠近:guilabel:`图层`面板。该窗口显示了应用于已加载图层的渲染信息(符号、标注、可见性等)。
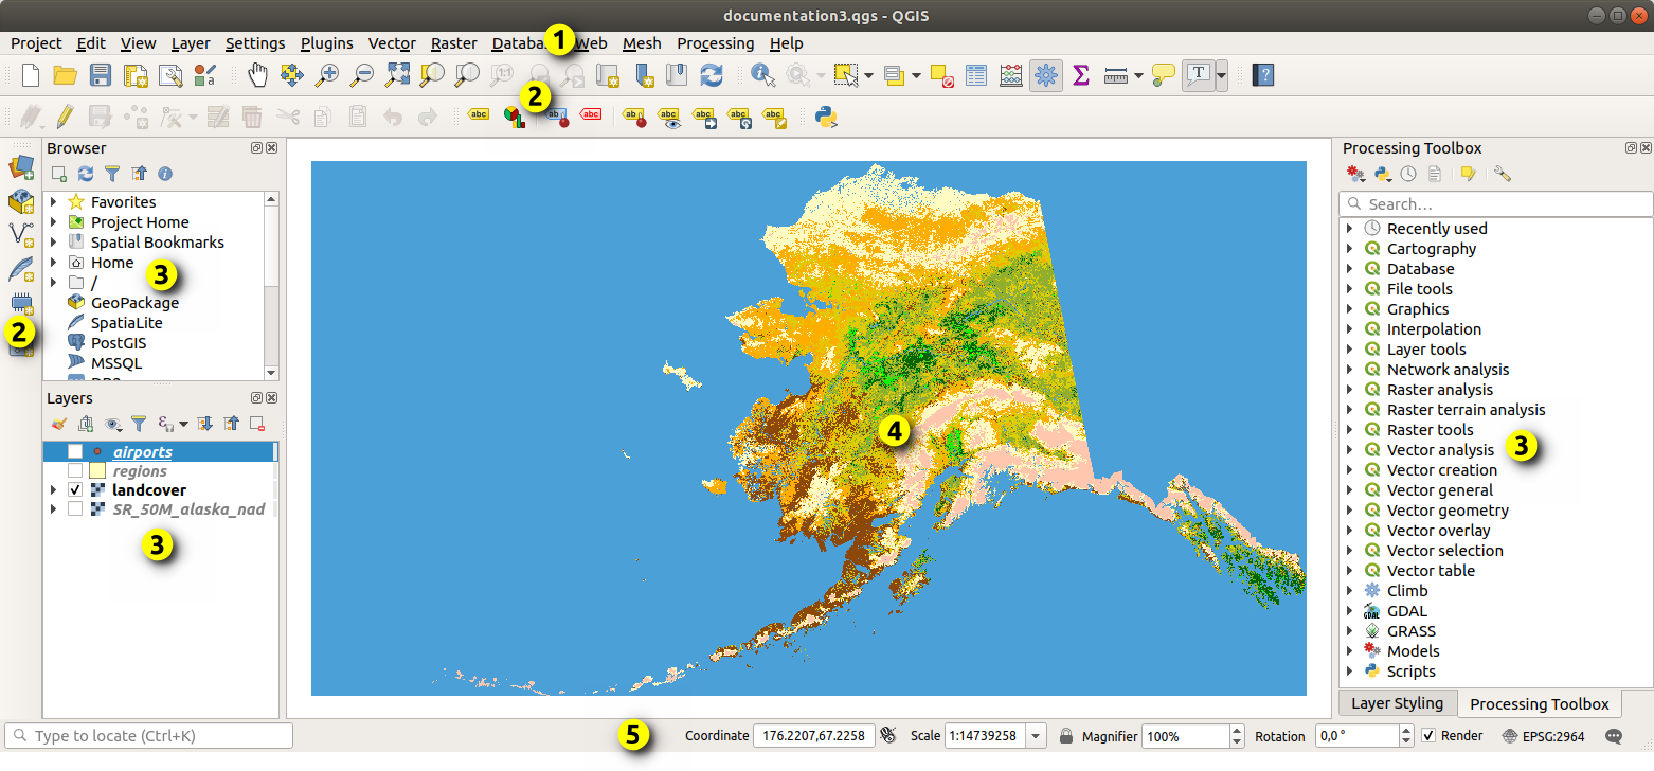
图 11.1 QGIS图形用户界面
11.1.1. 探索地图视图
当您添加图层时 (例如,请参阅 打开数据),QGIS自动查找其CRS。如果默认情况下为工程设置了不同的CRS (请参阅 投影坐标参照系),图层范围将 "动态" 转换为该CRS,如果从空QGIS工程开始,地图视图将缩放到该范围。如果工程中已存在图层,则不会执行地图画布调整,因此只有位于当前地图画布范围内的要素可见。
点击地图视图后,您能够与地图视图进行交互,如平移或缩放地图至不同的区域。
工具 |
Usage |
|---|---|
|
|
|
|
|
|
|
Pan the map to the selected features of all the selected layers in the Layers panel. |
|
Zoom to the selected features of all the selected layers in the Layers panel. Also available in the layer contextual menu |
|
Zoom to the extent of all the selected layers in the Layers panel. Also available in the layer contextual menu |
|
Zoom to the extent of all the layers in the project or to the project full extent. |
|
Zoom the map to the previous extent in history. |
|
Zoom the map to the next extent in history. |
|
Zoom the map to a level where one pixel of the active raster layer covers one screen pixel. Also available in the layer contextual menu |
Mouse wheel |
|
Keyboard |
|


右键单击地图,您应该能够在地图的CRS、WGS84或自定义CRS中  复制坐标 单击点的坐标,然后可以将复制的信息粘贴到表达式、脚本、文本编辑器或电子表格中...
11.1.2. Controlling map rendering
By default, QGIS renders all visible layers whenever the map canvas is refreshed. The events that trigger a refresh of the map canvas include:
changing the visibility of a layer
modifying symbology of a visible layer
adding a layer
panning or zooming
resizing the QGIS window
QGIS allows you to control the rendering process in a number of ways.
at the global level
per layer, using e.g. the scale dependent rendering
or with dedicated tools in the GUI.
To stop the map drawing, press the Esc key. This will halt the refresh of the map canvas and leave the map partially drawn. It may however take a bit of time after pressing Esc for the map drawing to halt.
To suspend rendering, click the  Render checkbox in the
bottom-right corner of the status bar. When Render
is unchecked, QGIS does not redraw the canvas in response to any of
the usual triggers mentioned earlier. Examples of when you
might want to suspend rendering include:
Render checkbox in the
bottom-right corner of the status bar. When Render
is unchecked, QGIS does not redraw the canvas in response to any of
the usual triggers mentioned earlier. Examples of when you
might want to suspend rendering include:
adding many layers and symbolizing them prior to drawing
adding one or more large layers and setting scale dependency before drawing
adding one or more large layers and zooming to a specific view before drawing
any combination of the above
Checking the Render checkbox enables rendering and
causes an immediate refresh of the map canvas.
11.1.3. 地图画布上基于时间的控件
QGIS可以处理加载图层中的时态控制,即根据时间变化修改地图画布渲染。为此,您需要:
设置动态时态属性的图层。QGIS支持使用自定义设置对不同数据提供程序进行时态控制,主要是设置图层显示的时间范围:
栅格图层: 控制是否显示图层。
WMTS layers: controls whether the data should be rendered based on a static time range or following a dynamic temporal range
矢量图层: 根据与其属性关联的时间值过滤要素。
网孔图层: 动态显示活动数据集组值。
当为图层启用动态时态选项时, 图层 面板中的图层旁边会显示一个
 图标,提醒您该图层是受时态控制的。单击图标更新时态设置。
使用 时态控制面板 启用地图画布的时态导航。面板已激活:
使用位于 地图导航 工具栏中的
 时态控制面板 图标
或是 菜单
11.1.3.1. 时态控制面板
时态控制 面板具有以下几种状态:
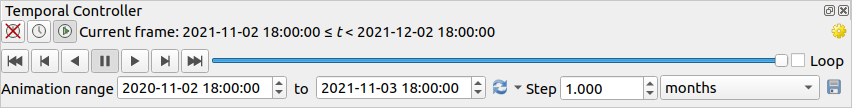
图 11.2 导航状态下的时态控制面板
 关闭时态导航: 所有时态设置都被禁用,可见图层正常渲染
 固定范围的时态导航: 设置时间范围,并且仅在地图上显示时态范围与该范围重叠的图层 (或要素)
 动画时态导航: 设置时间范围,将其分为多个步幅,只有时态范围与每个帧重叠的图层 (或要素) 才会在地图上显示
 设置 用于动画的常规控制
帧速率: 每秒显示的步幅数
 Cumulative range: all animation frames will
have the same start date-time but different end dates and times.
This is useful if you wish to accumulate data in your temporal
visualization instead of showing a ‘moving time window’ across your data.
Cumulative range: all animation frames will
have the same start date-time but different end dates and times.
This is useful if you wish to accumulate data in your temporal
visualization instead of showing a ‘moving time window’ across your data.
11.1.3.2. Animating a temporal navigation
An animation is based on a varying set of visible layers at particular times within a time range. To create a temporal animation:
Toggle on the
Animated temporal
navigation, displaying the animation player widgetEnter the Time range to consider. Using the
 button, this can be defined as:
Set to full range of all the time enabled layers
Set to preset project range as defined in the project properties
Set to single layer's range taken from a time-enabled layer
Fill in the time Step to split the time range. Different units are supported, from
secondstocenturies. Asource timestampsoption is also available as step: when selected, this causes the temporal navigation to step between all available time ranges from layers in the project. It’s useful when a project contains layers with non-contiguous available times, such as a WMS-T service which provides images that are available at irregular dates. This option will allow you to only step between time ranges where the next available image is shown.Click the
 button to preview the animation.
QGIS will generate scenes using the layers rendering at the set times.
Layers display depends on whether they overlap any individual time frame.
button to preview the animation.
QGIS will generate scenes using the layers rendering at the set times.
Layers display depends on whether they overlap any individual time frame.
图 11.3 Temporal navigation through a layer
The animation can also be previewed by moving the time slider. Checking the
Loop checkbox will repeatedly run the
animation while clicking stops a running animation.
A full set of video player buttons is available.Horizontal scrolling using the mouse wheel (where supported) with the cursor on the map canvas will also allow you to navigate, or “scrub”, the temporal navigation slider backwards and forwards.
Click the
 Export animation button if you want to generate
a series of images representing the scene. They can be later combined in a
video editor software:
Export animation button if you want to generate
a series of images representing the scene. They can be later combined in a
video editor software: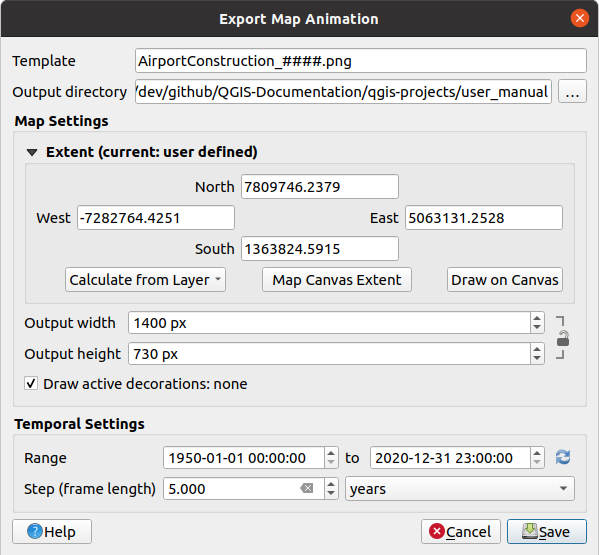
图 11.4 Exporting map canvas animation scenes to images
The filename Template: the
####are replaced with frame sequence numberThe Output directory
Under Map settings, you can:
redefine the spatial extent to use
control the Resolution of the image (Output width and Output height)
Draw active decorations: whether active decorations should be kept in the output
Under Temporal settings, you can redefine:
the time Range for the animation
the Step (frame length) in the unit of your choice
11.1.4. Bookmarking extents on the map
Spatial Bookmarks allow you to "bookmark" a geographic location and return to it later. By default, bookmarks are saved in the user's profile (as User Bookmarks), meaning that they are available from any project the user opens. They can also be saved for a single project (named Project Bookmarks) and stored within the project file, which can be helpful if the project is to be shared with other users.
11.1.4.1. Creating a Bookmark
To create a bookmark:
Zoom and pan to the area of interest.
Select the menu option
 ,
press Ctrl+B or right-click the
,
press Ctrl+B or right-click the  Spatial
Bookmarks entry in
the Browser panel and select New Spatial Bookmark.
The Bookmark Editor dialog opens.
Spatial
Bookmarks entry in
the Browser panel and select New Spatial Bookmark.
The Bookmark Editor dialog opens.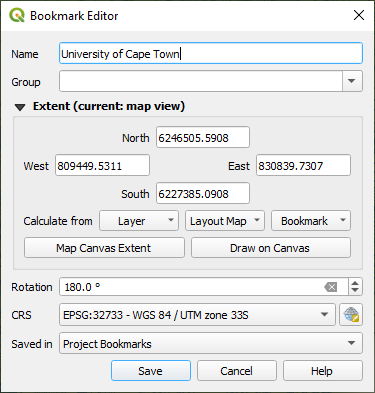
图 11.5 The Bookmark Editor Dialog
Enter a descriptive name for the bookmark
Enter or select a group name in which to store related bookmarks
Select the extent of the area you wish to save, using the extent selector widget
Change the map Rotation
Indicate the CRS to use for the extent
Select whether the bookmark will be Saved in User Bookmarks or Project Bookmarks (by default, this drop-down list is set to User Bookmarks)
Press Save to add the bookmark to the list
Note that you can have multiple bookmarks with the same name.
11.1.4.2. Working with Bookmarks
To use and manage bookmarks, you can either use the Spatial Bookmarks panel or Browser.
Select or press Ctrl+7
to open the Spatial Bookmarks Manager panel.
Select
or Ctrl+Shift+B to show
the Spatial Bookmarks entry in the
Browser panel.
You can perform the following tasks:
Task |
Spatial Bookmark Manager |
Browser |
|---|---|---|
Zoom to a Bookmark |
Double-click on it, or select the bookmark and press the
|
Double-click on it, drag and drop it to the map canvas, or right-click the bookmark and select Zoom to Bookmark. |
Delete a bookmark |
Select the bookmark and click the |
Right-click the bookmark and select Delete Spatial Bookmark. Confirm your choice. |
Export bookmarks to XML |
Click the |
Select one or more folders (user or project) or subfolders (groups),
then right-click and select |
Import bookmarks from XML |
Click the |
Right-click the Spatial Bookmarks entry or one of its folders (user or
project) or subfolders (groups) to determine where to import the
bookmarks, then select |
Edit bookmark |
You can change a bookmark by changing the values in the table. You can edit the name, the group, the extent and if it is stored in the project or not. |
Right-click the desired bookmark and select Edit Spatial Bookmark.... The Bookmark Editor will open, allowing you to redefine every aspect of the bookmark as if you were creating it for the first time. You can also drag and drop the bookmark between folders (user and project) and subfolders (groups). |


You can manage bookmark actions by right-click on the desired bookmark in the Spatial Bookmarks Manager. You can also zoom to bookmarks by typing the bookmark name in the locator.
11.1.5. Decorating the map
Decorations include Grid, Title Label, Copyright Label, Image, North Arrow, Scale Bar and Layout Extents. They are used to 'decorate' the map by adding cartographic elements.
11.1.5.1. Grid
 Grid allows you to add a coordinate grid and coordinate
annotations to the map canvas.
Grid allows you to add a coordinate grid and coordinate
annotations to the map canvas.
Select menu option to open the dialog.
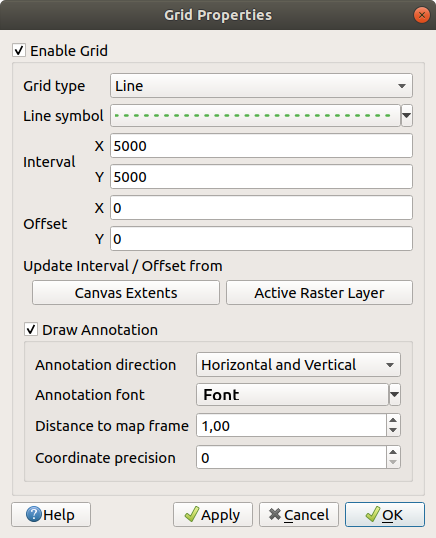
图 11.6 The Grid Dialog
Tick
Enable grid and set grid
definitions according to the layers loaded in the map canvas:The Grid type: it can be Line or Marker
The associated Line symbol or marker symbol used to represent the grid marks
The Interval X and Interval Y between the grid marks, in map units
An Offset X and Offset Y distance of the grid marks from the bottom left corner of the map canvas, in map units
The interval and offset parameters can be set based on the:
Canvas Extents: generates a grid with an interval that is approximatively 1/5 of the canvas width
Active Raster Layer resolution
Tick
Draw annotations to display the coordinates of
the grid marks and set:The Annotation direction, ie how the labels would be placed relative to their grid line. It can be:
Horizontal or Vertical for all the labels
Horizontal and Vertical, ie each label is parallel to the grid mark it refers to
Boundary direction, ie each label follows the canvas boundary, and is perpendicular to the grid mark it refers to
The Annotation font (text formatting, buffer, shadow...) using the font selector widget
The Distance to map frame, margin between annotations and map canvas limits. Convenient when exporting the map canvas eg to an image format or PDF, and avoid annotations to be on the "paper" limits.
The Coordinate precision
Click Apply to verify that it looks as expected or OK if you're satisfied.
11.1.5.2. Title Label
 Title Label allows you to decorate your map with a Title.
To add a Title Label decoration:
Select menu option to open the dialog.
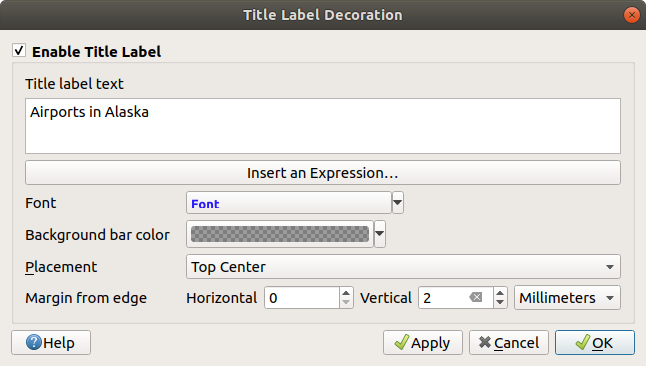
图 11.7 The Title Decoration Dialog
Make sure
Enable Title Label is checkedEnter the title text you want to place on the map. You can make it dynamic using the Insert or Edit an Expression... button.
Choose the Font for the label using the font selector widget with full access to QGIS text formatting options. Quickly set the font color and opacity by clicking the black arrow to the right of the font combo box.
Select the color to apply to the title's Background bar color.
Choose the Placement of the label in the canvas: options are Top left, Top Center (default), Top Right, Bottom left, Bottom Center and Bottom Right.
Refine the placement of the item by setting a horizontal and/or vertical Margin from Edge. These values can be in Millimeters or Pixels or set as a Percentage of the width or height of the map canvas.
Click Apply to verify that it looks as expected or OK if you're satisfied.
11.1.5.3. Copyright Label
 Copyright Label can be used to decorate your
map with a Copyright label.
Copyright Label can be used to decorate your
map with a Copyright label.
To add this decoration:
Select menu option to open the dialog.
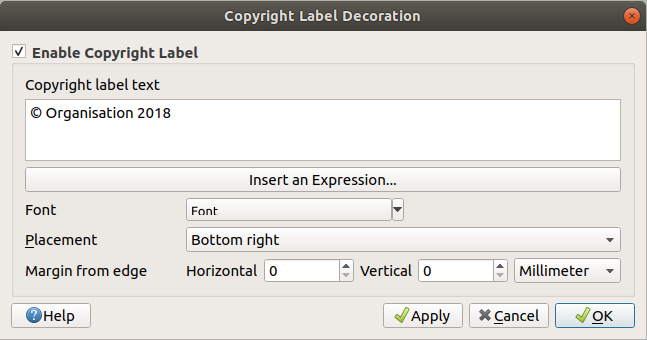
图 11.8 The Copyright Decoration Dialog
Make sure
Enable Copyright Label is checkedEnter the copyright text you want to place on the map. You can make it dynamic using the Insert or Edit an Expression... button.
Choose the Font for the label using the font selector widget with full access to QGIS text formatting options. Quickly set the font color and opacity by clicking the black arrow to the right of the font combo box.
Choose the Placement of the label in the canvas: options are Top left, Top Center, Top Right, Bottom left, Bottom Center, and Bottom Right (default for Copyright decoration)
Refine the placement of the item by setting a horizontal and/or vertical Margin from Edge. These values can be in Millimeters or Pixels or set as a Percentage of the width or height of the map canvas.
Click Apply to verify that it looks as expected or OK if you're satisfied.
11.1.5.4. Image Decoration
 Image allows you to add an image (logo, legend, ..) on the map canvas.
To add an image:
Select menu option to open the dialog.
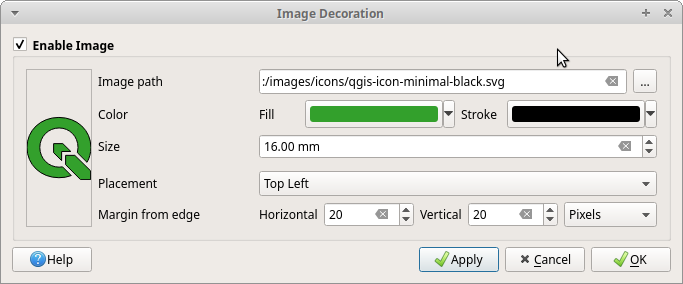
图 11.9 The Image Decoration Dialog
Make sure
Enable Image is checkedSelect a bitmap (e.g. png or jpg) or SVG image using the ... Browse button
If you have chosen a parameter enabled SVG then you can also set a Fill or Stroke (outline) color. For bitmap images, the color settings are disabled.
Set a Size of the image in mm. The width of selected image is used to resize it to given Size.
Choose where you want to place the image on the map canvas with the Placement combo box. The default position is Top Left.
Set the Horizontal and Vertical Margin from (Canvas) Edge. These values can be set in Millimeters, Pixels or as a Percentage of the width or height of the map canvas.
Click Apply to verify that it looks as expected and OK if you're satisfied.
11.1.5.5. North Arrow
![]() North Arrow allows you to add a north arrow on the map canvas.
North Arrow allows you to add a north arrow on the map canvas.
To add a north arrow:
Select menu option to open the dialog.
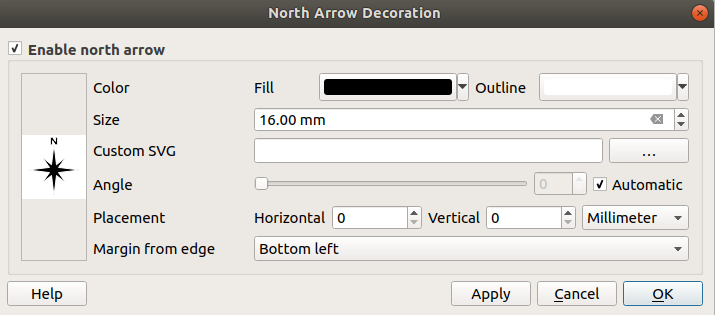
图 11.10 The North Arrow Dialog
Make sure
Enable north arrow is checkedOptionally change the color and size, or choose a custom SVG
Optionally change the angle or choose Automatic to let QGIS determine the direction
Optionally choose the placement from the Placement combo box
Optionally refine the placement of the arrow by setting a horizontal and/or vertical Margin from (Canvas) Edge. These values can be in Millimeters or Pixels or set as a Percentage of the width or height of the map canvas.
Click Apply to verify that it looks as expected and OK if you're satisfied.
11.1.5.6. Scale Bar
 Scale Bar adds a simple scale bar to the map canvas.
You can control the style and placement, as well as the labelling of the bar.
The scale bar respects the active project's distance unit
as defined in .
Scale Bar adds a simple scale bar to the map canvas.
You can control the style and placement, as well as the labelling of the bar.
The scale bar respects the active project's distance unit
as defined in .
To add a scale bar:
Select menu option to open the dialog
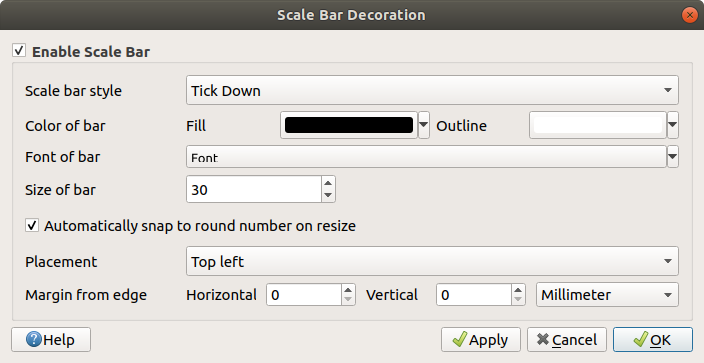
图 11.11 The Scale Bar Dialog
Make sure
Enable scale bar is checkedChoose a style from the Scale bar style
 combo box
Select the Color of bar
 by choosing
a fill color (default: black) and an outline color (default: white). The scale
bar fill and outline can be made opaque by clicking on the down arrow to the right
of the color input.
by choosing
a fill color (default: black) and an outline color (default: white). The scale
bar fill and outline can be made opaque by clicking on the down arrow to the right
of the color input.Select the font for the scale bar from the Font of bar
combo boxSet the Size of bar in the active unit
Optionally check
Automatically snap to round number on resize
to display easy-to-read valuesChoose the placement from the Placement
combo boxYou can refine the placement of the item by setting a horizontal and/or vertical Margin from (Canvas) Edge. These values can be in Millimeters or Pixels or set as a Percentage of the width or height of the map canvas.
Click Apply to verify that it looks as expected or OK if you're satisfied.
11.1.5.7. Layout Extents
 Layout Extents adds the extents of map item(s) in print
layout(s) to the canvas. When enabled, the extents of all map items within all print layouts are
shown using a lightly dotted border labeled with the name of the print layout and map item.
You can control the style and labeling of the displayed layout extents.
This decoration is useful when you are tweaking the positioning of map elements such as labels,
and need to know the actual visible region of print layouts.
Layout Extents adds the extents of map item(s) in print
layout(s) to the canvas. When enabled, the extents of all map items within all print layouts are
shown using a lightly dotted border labeled with the name of the print layout and map item.
You can control the style and labeling of the displayed layout extents.
This decoration is useful when you are tweaking the positioning of map elements such as labels,
and need to know the actual visible region of print layouts.
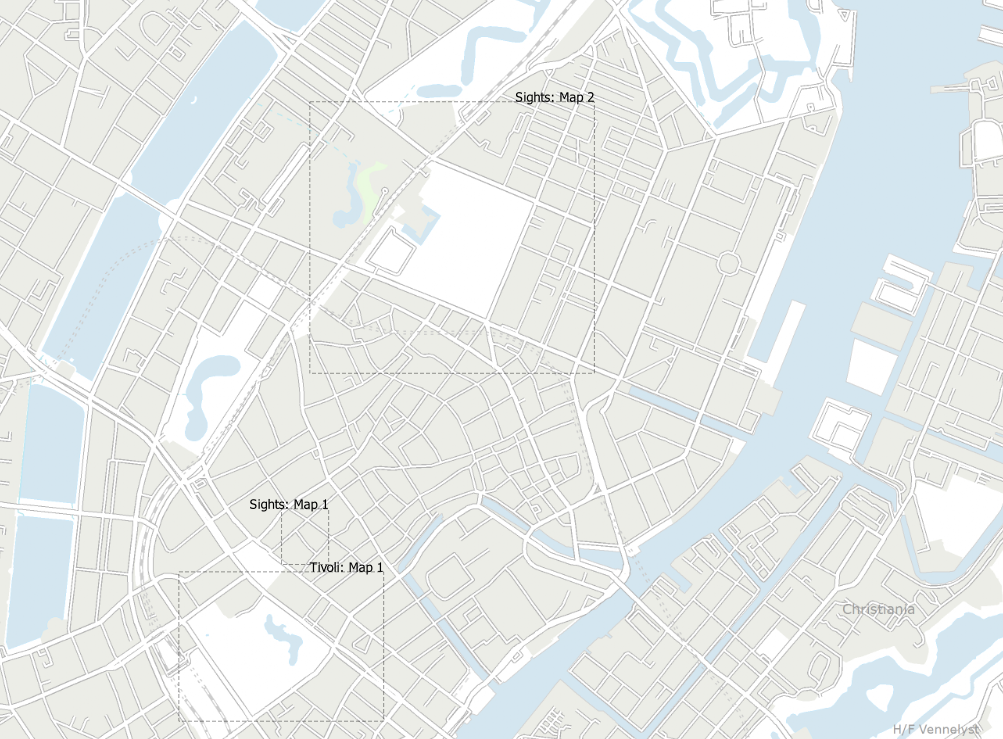
图 11.12 Example of layout extents displayed in a QGIS project with two print layouts. The print layout named 'Sights' contains two map items, while the other print layout contains one map item.
To add layout extent(s):
Select to open the dialog
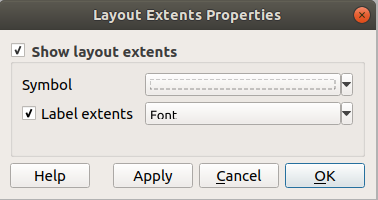
图 11.13 The Layout Extents Dialog
Make sure
Show layout extents is checked.Optionally change the symbol and labeling of the extents.
Click Apply to verify that it looks as expected and OK if you're satisfied.
小技巧
Decorations Settings
When you save a QGIS project file, any changes you have made to Grid, North Arrow, Scale Bar, Copyright and Layout Extents will be saved in the project and restored the next time you load the project.
11.1.6. Annotation Tools
Annotations are another type of elements added onto the map canvas to provide additional information that can not be depicted by the rendered layers. Unlike labels that rely on attribute values stored in vector layers, annotations are independent details, stored within the project file itself.
Two families of annotations are available in QGIS:
Feature annotations: they are actual georeferenced features of text, marker, line or polygon type stored within a special layer type called "annotation layer". They are tied to a particular geographic location, meaning that moving your map, changing the scale or changing projection won’t cause your annotations to jump around the map. Rather, they’ll be locked in place to the location you’ve drawn them.
Balloon annotations: these are individuals annotations of text, form or image type placed inside a bubble. They can be associated to any layer for their visibility, are drawn on top of the map canvas. The size is dependent from the map canvas scale, and its position can be anchored.
小技巧
Layout the map with annotations
You can print or export annotations with your map to various formats using:
map canvas export tools available in the menu
print layout, in which case you need to check Draw map canvas items in the corresponding map item properties
The Annotations Toolbar provides a set of tools to create and interact with both families of annotations.
工具 |
Usage |
Scope |
|
Create a new layer to store annotations |
Feature annotations |
Main Annotation Layer Properties |
Control settings of the Main Annotation Layer |
|
|
Select, move, resize and modify symbology properties of annotations |
|
|
Create an annotation as a polygon feature |
|
|
Create an annotation as a polyline feature |
|
|
Create an annotation as a point feature |
|
|
Create an annotation as a text label |
|
|
Create an annotation as a curved text along a linestring |
|
|
Select and create a text formatted annotation |
Balloon annotations |
|
Select and create annotation with an |
|
|
Select and create annotation showing an |
|
|
Select and create annotation showing attributes of a vector layer in a custom form file |
11.1.6.1. Feature Annotations
Feature annotations are stored in annotation layers. Unlike conventional layers, an annotation layer is available only in the current project and can contain features of different types (text, marker, line, polygon). The layer has no attributes and no symbology associated, but instead each feature can be symbolized on an item-by-item basis, through Layer Styling panel.
Two types of annotation layer are available in QGIS:
A common Annotation Layer: you can create one using the
 New Annotation Layer tool. It is listed
in the Layers panel, allowing you to control its features'
visibility, move it to show above or below particular layers in your map,
like any common layer.
Double-click the layer and you can access its properties.
New Annotation Layer tool. It is listed
in the Layers panel, allowing you to control its features'
visibility, move it to show above or below particular layers in your map,
like any common layer.
Double-click the layer and you can access its properties.The Main Annotation Layer: By default, this is where annotations are stored when no annotation layer is available in the project or is selected at creation time. This layer is always drawn on the very top of your map and you won't see it listed in the Layers panel alongside the other layers in your project, meaning that its features are always visible. The Main Annotation Layer Properties entry on the Annotations toolbar helps you open its properties dialog.
Layer Properties
The properties dialog of an annotation layer provides the following tabs:
Information: a read-only dialog representing an interesting place to quickly grab summarized information and metadata on the current layer. This may include the layer extent, count of items per annotation type and total count, CRS details, ...
Source: defines general settings for the annotation layer. You can:
Set a Layer name that will be used to identify the layer in the project (in the Layers Panel, with expressions, ...)
Display the layer's Assigned Coordinate Reference System (CRS): you can change the layer's CRS, selecting a recently used one in the drop-down list or clicking on
 Select CRS button
(see Coordinate Reference System Selector). Use this process only if the CRS applied to the
layer is a wrong one or if none was applied.
Select CRS button
(see Coordinate Reference System Selector). Use this process only if the CRS applied to the
layer is a wrong one or if none was applied.
Rendering:
You can set the Maximum (inclusive) and Minimum (exclusive) scale, defining a range of scale in which features will be visible. Out of this range, they are hidden. The
 Set to current canvas scale button helps you use the current map
canvas scale as boundary of the range visibility.
See 可见比例选择器 for more information.
Set to current canvas scale button helps you use the current map
canvas scale as boundary of the range visibility.
See 可见比例选择器 for more information.Opacity: You can make the underlying layer in the map canvas visible with this tool. Use the slider to adapt the visibility of your vector layer to your needs. You can also make a precise definition of the percentage of visibility in the menu beside the slider.
Blending mode at the Layer level: You can achieve special rendering effects with these tools that you may previously only know from graphics programs. The pixels of your overlaying and underlying layers are mixed through the settings described in Blending Modes.
Apply paint effects on all the layer features with the Draw Effects button.
Some of these options are accessible from the feature annotation Symbology properties.
与要素交互
The Feature annotations have dedicated tools for creation depending on their type:
 Create Polygon Annotation
 Create Line Annotation
 Create Marker Annotation
 Create Text Annotation at Point
 Create Text Annotation along Line
All the usual QGIS shortcuts for creating features apply when creating annotation items. A line or polygon annotation is drawn by left-clicking once for each vertex, with a final right mouse click to complete the shape. Snapping can be enabled while you draw, you can use the Advanced Digitizing Tools to precisely place vertices, and even switch the drawing tools to the streaming mode for completely free-form shapes.
Unlike common layers, an annotation layer does not need to be active before you
select its features. Simply grab the  Modify Annotations tool and
you will be able to interact with any feature annotation:
Modify Annotations tool and
you will be able to interact with any feature annotation:
Selection: left-click on the annotation. By default, annotations are rendered in the order of creation, meaning that recent annotations will be placed on top of older. You may need to play with the Z-index property of features in order to select ones they would sit above.
Moving: Left click on a selected annotation item to start moving it. A right-click or pressing Esc key cancels the move, while a second left click will confirm the move. The displacement can also be controlled pressing the cursor keys:
Shift+key for big movement
Alt+key for
1 pxmovement
Geometry modification: for line or polygon annotations, left-click on a vertex of the geometry, move and click again. Double-click a segment to add a new vertex.
Delete: Pressing the Del or Backspace key while an annotation is selected will delete that annotation
Feature symbology
A selected annotation will display its Symbology properties in the Layer styling panel. You can:
Modify the appearance using full capabilities of:
the symbol properties for polygon, polyline and marker annotations
the text format properties for text-based annotations. A text area allows you to construct the string to display using QGIS expression functions. It is also possible to set the Alignment for text annotation at point (left, center or right of the text point).
For text annotation at point, also configure whether it should Ignore map rotation or Rotate with map. In both cases, a custom Angle can be set for the feature orientation.
For text annotation along a line, configure an Offset from line in the unit of your choice
Configure a
Reference scale: indicates the map scale
at which symbol or text sizes which uses paper-based units (such as millimeters or points) relate to.
The sizes will be scaled accordingly whenever the map is viewed at a different scale.
For instance, a line feature wide of 2mm at 1:2000 Reference scale
will be rendered using 4mm when the map is viewed at 1:1000.Set a Z-index: a feature with a higher index is placed on top of features with lower index. A convenient setting for both feature display and selection.
Modify some of the Layer rendering settings
11.1.6.2. Balloon annotations
You can add balloon annotations through menu or from the Annotations Toolbar:
 Text Annotation for custom formatted text
 HTML Annotation to place the content of an
 htmlfile SVG Annotation to add an
 SVGsymbol Form Annotation: useful to display attributes
of a vector layer in a customized
Form Annotation: useful to display attributes
of a vector layer in a customized uifile (see 图 11.14). This is similar to the custom attribute forms, but displayed in an annotation item. Also see this video https://www.youtube.com/watch?v=0pDBuSbQ02o&feature=youtu.be&t=2m25s from Tim Sutton for more information.
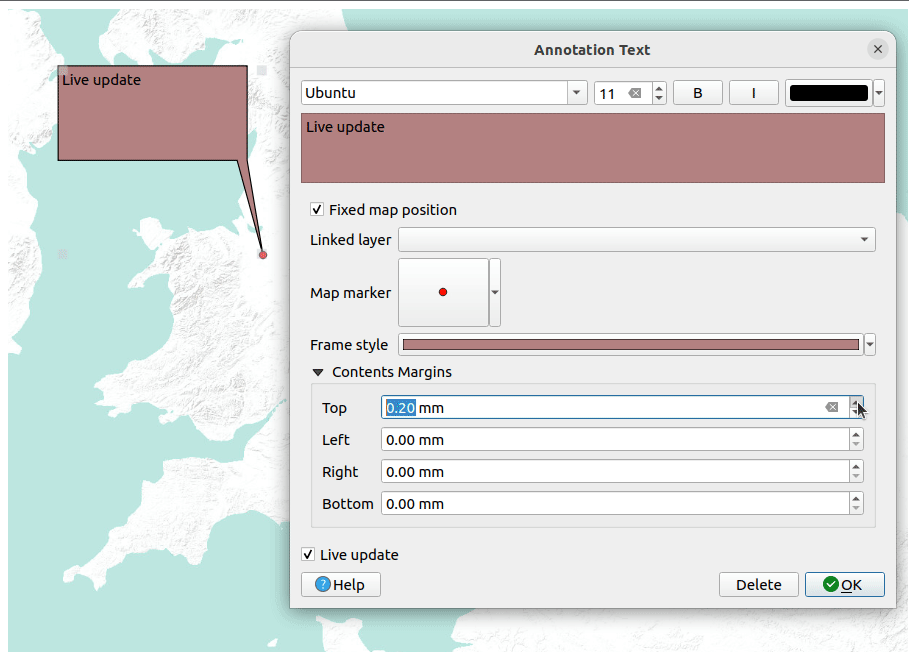
图 11.14 Examples of balloon annotations
To add a balloon annotation, select the corresponding tool and click on the map canvas. An empty balloon is added. Double-click on it and a dialog opens with various options. This dialog is almost the same for all the annotation types:
At the top, a file selector to fill with the path to an
html,svgoruifile depending on the type of annotation. For text annotation, you can enter your message in a text box and set its rendering with the normal font tools.- Fixed map position: when unchecked, the balloon placement
is based on a screen position (instead of the map), meaning that it's always shown
regardless the map canvas extent.
Linked layer: associates the annotation with a map layer, making it visible only when that layer is visible.
Map marker: using QGIS symbols, sets the symbol to display at the balloon anchor position (shown only when Fixed map position is checked).
Frame style: sets the frame background color, transparency, stroke color or width of the balloon using QGIS symbols.
Contents margins: sets interior margins of the annotation frame.
- Live update allows you to live preview your changes.
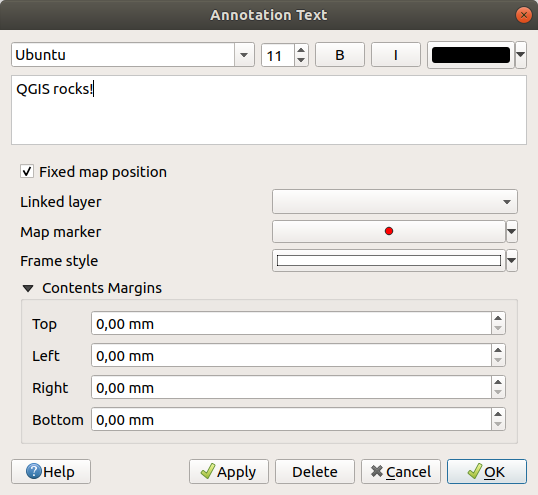
图 11.15 A ballon annotation text dialog
When a balloon annotation tool is active, you can also:
Select an annotation
Resize an annotation
Move an annotation by map position (by dragging the map marker) or by moving only the balloon.
Delete an annotation: select it and either press the Del or Backspace button, or double-click it and press the Delete button in the properties dialog.
Right-click and in the contextual menu:
- Copy coordinate of the annotation's map marker in various CRS
 Edit properties of the annotation. Same as double-clicking the annotation.
 Delete the annotation
11.1.7. Measuring
11.1.7.1. General information
QGIS provides four means of measuring geometries:
interactive measurement tools

measuring in the
 Field Calculator
derived measurements in the 识别要素 tool
the vector analysis tool:
Measuring works within projected coordinate systems (e.g., UTM) and unprojected data. The first three measuring tools behave equally to global project settings:
Unlike most other GIS, the default measurement metric is ellipsoidal, using the ellipsoid defined in . This is true both when geographic and projected coordinate systems are defined for the project.
If you want to calculate the projected/planimetric area or distance using cartesian maths, the measurement ellipsoid has to be set to "None/Planimetric" (). However, with a geographic (ie unprojected) CRS defined for the data and project, area and distance measurement will be ellipsoidal.
However, neither the identify tool nor the field calculator will transform your data to the project CRS before measuring. If you want to achieve this, you have to use the vector analysis tool: . Here, measurement is planimetric, unless you choose the ellipsoidal measurement.
11.1.7.2. Measure length, areas, bearings and angles interactively
Click the icon in the Attribute toolbar to begin measurements.
The down arrow near the icon switches between
length,  area,
area,  bearing or
  angle.
The default unit used in the dialog is the one set in menu.
angle.
The default unit used in the dialog is the one set in menu.
For the Measure Line and the Measure Area the
measurements can be done in  Cartesian or
Ellipsoidal measure.
Cartesian or
Ellipsoidal measure.
备注
Configuring the measure tool
While measuring length or area, clicking the Configuration button at the bottom of the widget opens the menu, where you can select the rubberband color, the precision of the measurements and the unit behavior. You can also choose your preferred measurement or angle units, but keep in mind that those values are overridden in the current project by the selection made in the menu, and by the selection made in the measurement widget.
All measuring modules use the snapping settings from the digitizing module (see section 设置捕捉容差和搜索半径). So, if you want to measure exactly along a line feature, or around a polygon feature, first set its layer snapping tolerance. Now, when using the measuring tools, each mouse click (within the tolerance setting) will snap to that layer.
The Measure Line measures distances between given points.
The tool then allows you to click points on the map.
Each segment length, as well as the total, shows up in the measure window.
In the measure window, you will see coordinates for all your points and distances.
Keep in mind that the first row will contain only coordinates, as it represents your starting point.
Now it is possible to copy all your line measurements at once to the clipboard
using the Copy button. Clicking the Configuration button
you will access to Measure Tool Copy Settings where you can set up
copy options. To stop measuring, click the right
mouse button.
Note that you can use the drop-down list near the total to change the measurement units interactively while working with the measure tool. This unit is retained for the widget until a new project is created or another project is opened.
The Info section in the dialog explains how calculations are made according to the CRS settings available.
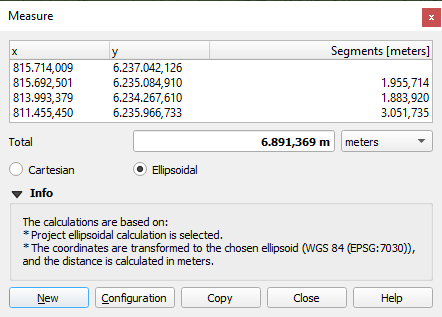
图 11.16 Measure Distance
Measure Area: Areas can also be measured. In the
measure window, the accumulated area size appears. Right-click to stop drawing.
The Info section is also available as well as the ability to switch between
different area units.
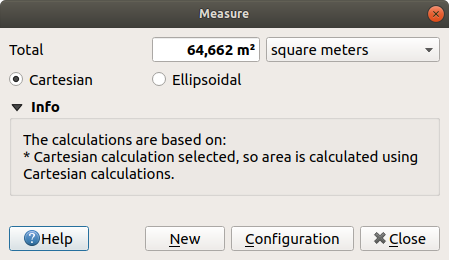
图 11.17 Measure Area
Measure Bearing: You can also measure bearings.
The cursor becomes cross-shaped.
Click to draw the first point of the bearing,
then move the cursor to draw the second point.
The measurement is displayed in a pop-up dialog.
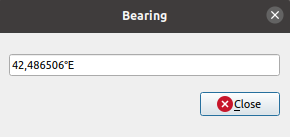
图 11.18 Measure Bearing
Measure Angle: You can also measure angles.
The cursor becomes cross-shaped.
Click to draw the first segment of the angle you wish to measure,
then move the cursor to draw the desired angle.
The measurement is displayed in a pop-up dialog.
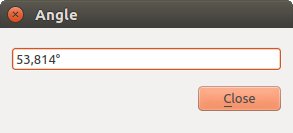
图 11.19 Measure Angle
11.1.8. 设置其他地图视图
It is also possible to open additional map views whose content could diverge
from the Layers panel current state.
To add a new map view, go to  . A new floating widget, mimicking the main map
view's rendering, is added to QGIS. You can add as many map views as you need.
They can be kept floating, placed side by side or stacked on top of each
other.
. A new floating widget, mimicking the main map
view's rendering, is added to QGIS. You can add as many map views as you need.
They can be kept floating, placed side by side or stacked on top of each
other.
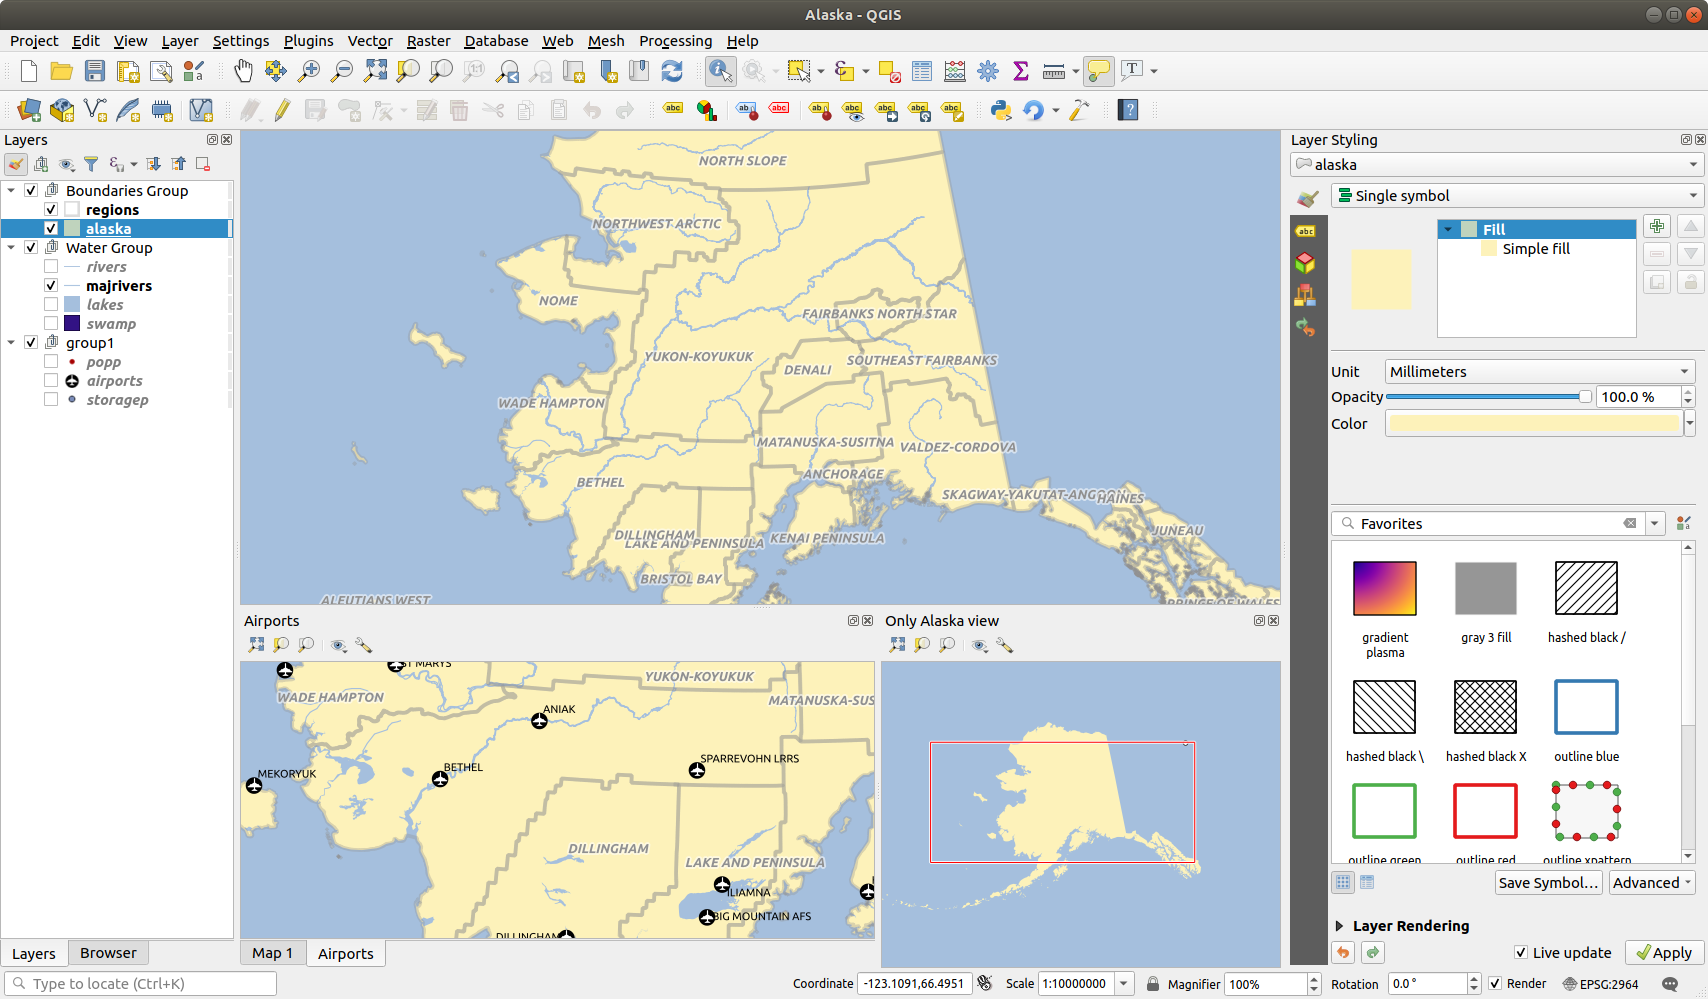
图 11.20 具有不同设置的多个地图视图
在新建的地图画布顶部,有一个具有以下功能的工具栏:
 全图显示,
全图显示,  缩放到选中要素的范围 和
  缩放到图层 可在视图中导航
 设置视图主题 以选择要在地图视图中显示的:ref:地图主题 <map_themes>。如果设置为
 (无),视图将跟随 图层 面板的变化而变化。 视图设置 用来配置地图视图:
- 视图中心与主地图同步: 在不更改比例的情况下同步地图视图的中心,这允许您在主画布中心有一个鹰眼图样式或放大的地图。
 将视图与所选内容同步: 与 "缩放到选中的区域" 作用相同
比例
旋转角度
放大
- 同步比例 与主地图比例一致。然后可以应用 比例因子,使您可以拥有一个例如始终是主画布比例2倍的视图。
- 显示注记
- 显示指针位置
- 显示主要画布范围
- 显示标注: 允许隐藏标注,无论它们在显示图层的属性中如何设置
更改地图CRS...
重命名视图...
11.1.9. 导出地图视图
使用 打印布局或报告 的高级功能,可以将您制作的地图布局导出为各种格式,也可以不使用布局直接导出当前渲染。这个地图视图的快速 "截图" 有一些方便的功能。
要使用当前渲染导出地图画布,请执行以下操作:
转到
根据您的输出格式,选择
 导出地图为图像...
或
 导出地图为PDF文件...
这两个工具为您提供了一组通用选项。在打开的对话框中:
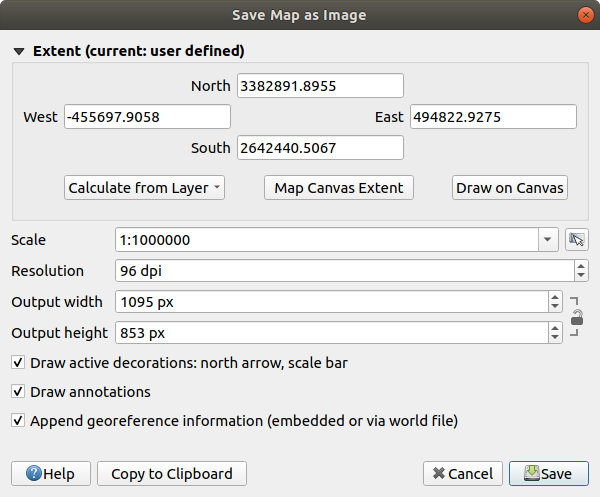
图 11.21 地图另存为图像对话框
选择要导出的 范围:可以是当前视图范围 (默认)、图层范围或在地图画布上绘制的自定义范围。将显示所选区域的坐标,并可手动编辑。
输入地图 比例 或从 预定义比例 选择:更改比例将调整要导出范围的大小 (从中心开始)。
设置输出的 分辨率
以像素为单位控制图像的 输出宽度 和 输出高度: 默认是基于当前分辨率和范围,可以自定义并将调整地图范围的大小 (从中心开始)。大小比值可以锁定,这在画布上绘制范围时可能特别方便。
- 绘制活动装饰: 使用中的 装饰 (比例尺、标题、网格、指北针等) 与地图一起导出
- 绘制注记 导出全部 注记
- 附加配准信息 (嵌入或者借助于坐标信息文件): 根据输出格式,一个同名的坐标信息文件 (扩展名为
PNGW表示PNG图像,扩展名为JPGW表示JPG, ...) 与您的图像保存在同一文件夹中。PDF格式将信息嵌入到PDF文件中。 导出为PDF时,地图另存为PDF... 对话框提供了更多选项:
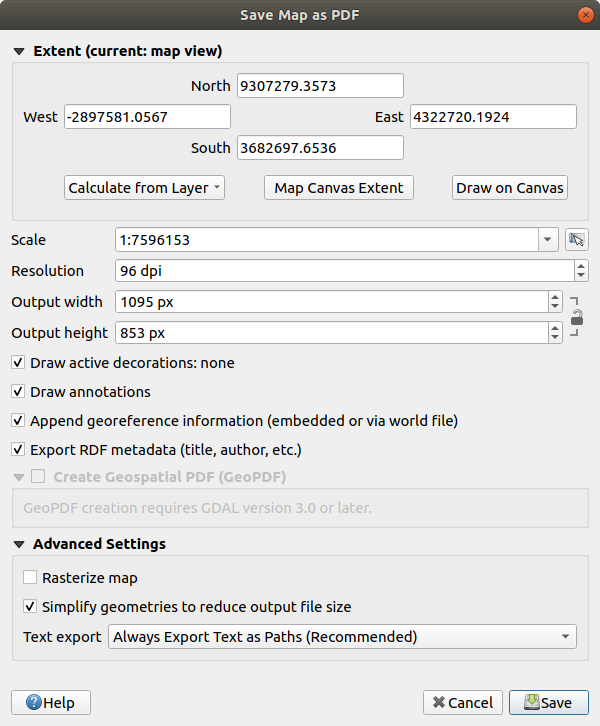
图 11.22 地图另存为PDF的对话框
文档的
导出RDF元数据,例如标题、作者、日期、描述...- Create Geospatial PDF: Generate a
georeferenced PDF file.
You can:
Choose the Geospatial PDF Format
- Include vector feature information in the
Geospatial PDF file: will include all the geometry and attribute
information from features visible within the map in the output
Geospatial PDF file.
备注
A Geospatial PDF file can also be used as a data source. For more on Geospatial PDF support in QGIS, see https://north-road.com/2019/09/03/qgis-3-10-loves-geospatialpdf/.
地图栅格化
- Simplify geometries to reduce output file
size:
Geometries will be simplified while exporting the map by removing
vertices that are not discernibly different at the export
resolution (e.g. if the export resolution is
300 dpi, vertices that are less than1/600 inchapart will be removed). This can reduce the size and complexity of the export file (very large files can fail to load in other applications). 设置 文本导出: 控制文本标注是作为正确的文本对象导出 (始终将文本导出为文本对象) 还是仅作为路径导出 (始终将文本导出为路径)。如果作为文本对象导出,可以在外部应用程序 (例如Inkscape) 中作为普通文本进行编辑。但其副作用是渲染质量降低,并且当设置某些文本如描边效果时,渲染会出现问题。这就是为什么建议导出为路径的原因。
单击 保存 后可以选择文件位置、名称和格式。
导出到图像时,还可以将上述设置的预期结果 复制到剪贴板,并将地图粘贴到另一应用程序中,如 LibreOffice、GIMP...