重要
Translation is a community effort you can join. This page is currently translated at 89.08%.
15.1. 打开数据
作为开源软件生态系统的一部分,QGIS构建在不同的库基础之上,这些库与自己的提供程序相结合,提供读取和编辑多种格式的功能:
矢量数据格式包括地理包、GML、GeoJSON、GPX、KML、逗号分隔值、ESRI格式 (形状文件、地理数据库…)、MapInfo和MicroStation文件格式、AutoCAD DWG/DXF、GRASS等。请参阅 支持矢量格式 的完整列表。
栅格数据格式包括GeoTIFF、JPEG、ASCII Gridded XYZ、MBTiles、R或Idrisi栅格、GDAL Virtual、SRTM、Sentinel数据、ERDAS IMAGINE、ArcInfo二进制网格、ArcInfo ASCII 网格等。请参阅 支持栅格格式 的完整列表。
数据库格式包括PostgreSQL/PostGIS、SQLite/SpatiaLite、Oracle、MS SQL Server、SAP HANA、MySQL等。
Web地图和数据服务 (WM(T)S、WFS、WCS、CSW、XYZ瓦片、ArcGIS服务等) 也由QGIS提供程序处理。有关内容的更多信息,请参阅 Working with OGC / ISO protocols 。
您可以从存档文件夹读取支持的文件,并使用QGIS本地格式,如QML文件 (QML - QGIS样式文件格式) 以及虚拟和存储图层。
GDAL 和QGIS本地提供程序支持80多种矢量和140多种栅格格式。
备注
由于各种原因,并非所有列出的格式都可以在QGIS中使用。例如,有些需要外部专有库,或者您的操作系统的GDAL/OGR安装程序可能无法支持想要使用的格式。要查看可用格式的列表,请在命令行运行 ogrinfo --formats (矢量) 和 gdalinfo --formats (栅格) ,或在QGIS菜单 中查验。
在QGIS中,不同的数据格式使用不同的工具打开数据集,主要在 菜单或从 图层管理 工具栏 (通过 菜单激活) 中获取。但是,所有这些工具都指向同一对话框,即 数据源管理器 对话框,您可以使用 数据源管理器工具栏 上的  打开数据源管理器 按钮或按 Ctrl+L 打开该对话框。 数据源管理器 对话框 (图 15.1) 提供了统一的界面来打开基于文件的数据以及QGIS支持的数据库或Web服务。
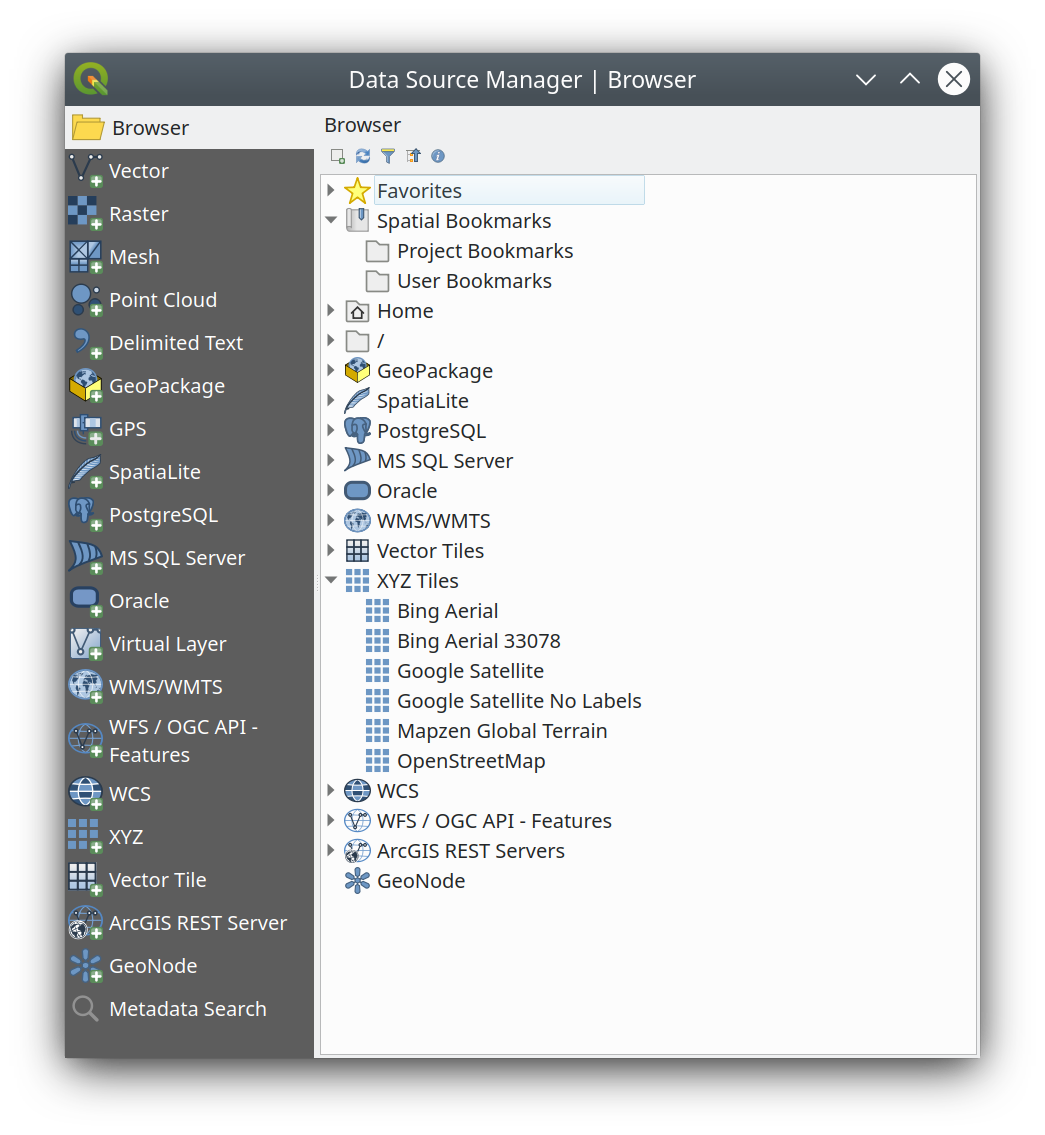
图 15.1 QGIS数据源管理器对话框
除了这个主要入口点之外,还可以使用  数据库管理器 插件,它提供了分析和操作连接数据库的高级功能。有关数据库管理器功能的更多信息,请参阅 DB Manager Plugin 。
还有许多其他工具 (本地或第三方插件),可以帮助您打开各种数据格式。
本章仅介绍QGIS中默认提供的用于加载数据的工具。主要聚焦 数据源管理器 对话框,但除了介绍每个选项卡之外,还将探索基于数据提供程序或格式特性的工具。
15.1.1. 浏览器面板
浏览器 是快速方便地将数据添加到工程中的主要方式之一。它有以下几种途径:
数据源管理器 选项卡,可按
打开数据源管理器 按钮 (Ctrl+L) 激活;作为QGIS面板,可以从菜单 (或
 ) 或按 Ctrl+2 打开。
在这两种情况下,无论图层类型 (栅格、矢量、表) 或数据源格式 (普通或压缩文件、数据库、Web服务) 如何, 浏览器 都可以帮助您在文件系统中导航并管理地理数据。
15.1.1.1. 探索界面
在浏览器面板的顶部,可以找到一些按钮来帮助您执行以下操作:
 添加选中的图层: 可以通过从图层的上下文菜单选择 添加选中的图层 ,将数据添加到地图画布;
 刷新 浏览器树;
 过滤浏览器 搜索指定数据。输入搜索关键词或通配符,浏览器将过滤树,只显示匹配数据库表、文件名或文件夹的路径 -- 其他数据或文件夹不会显示。请参阅 图 15.2 中的浏览器面板 (2) 示例。可以区分或不区分大小写,也可以设置为:
正常: 显示包含搜索文本的项
通配符: 使用
?和/或*字符精确搜索指定搜索文本的位置正则表达式
 全部折叠 整个树;
 启用/禁用属性控件: 打开后,将在面板底部添加一个新控件,显示所选项的元数据 (如果可用)。
浏览器 面板中的条目是按层级结构组织的,并有几个顶级条目:
收藏夹 可以在其中放置指向常用位置的快捷方式
空间书签 可以在其中储存常用的地图范围 (请参阅 Bookmarking extents on the map)
工程主目录: 快速访问存储与工程相关 (大部分) 数据的文件夹。默认值是工程文件所在的目录。
文件系统和文件系统根目录中的 主 目录。
连接本地或网络驱动器
之后是容器/数据库类型和服务协议,具体取决于您的平台和底层库:
 GeoPackage
 SpatiaLite
 PostgreSQL
 SAP HANA
 MS SQL Server
 Oracle
 WMS/WMTS
 矢量瓦片
矢量瓦片 XYZ瓦片
XYZ瓦片 WCS
WCS WFS/OGC API-Features
 ArcGIS REST Server
15.1.1.2. 与浏览器项交互
浏览器支持在浏览器中拖放,从浏览器拖放到画布和 图层 面板,从 图层 面板拖放到浏览器中的图层容器 (例如地理包)。
可以展开浏览器中的工程文件项,显示该工程中包含的完整图层树 (包括组)。工程项的处理方式与浏览器中的任何其他项相同,因此可以在浏览器中拖放 (例如,将图层项复制到地理包文件中),也可以通过拖放或双击将其添加到当前工程中。
在 浏览器 面板中的某个元素上单击鼠标右键,即可打开该元素的上下文菜单。
对于文件系统目录条目,上下文菜单提供以下内容:
要在所选条目中创建:
目录...
地理包...
形状文件...
添加到收藏夹: 收藏夹文件夹可以随时重命名 (重命名收藏条目...) 或移除 (移除收藏条目) 。
从浏览器中隐藏: 隐藏文件夹可以从 设置切换为可见
快速扫描此目录
打开目录
在终端打开
工程属性...
目录属性...
对于可以在工程中充当图层的子条目,上下文菜单将支持条目。例如,对于非数据库、非基于服务的矢量、栅格和网孔数据源:
添加图层到工程
图层属性
或 删除 "<name of file>"...
在文件资源管理器中显示
文件属性
在 图层属性 条目中,您将发现 (类似于将图层添加到工程后在 矢量 和 栅格 图层属性中发现的内容):
图层的 元数据 。元数据组: 来自数据源的信息 (如果可以, 路径 将是到源的超链接)、 识别 、 范围 、 访问 、 字段 (用于矢量图层) 、 波段 (用于栅格图层) 、 联系人 、 链接 (用于矢量图层) 、 参考 (用于栅格图层) 、 历史 。
预览 面板
矢量源的属性表 (在 属性 面板中)。
要使用 浏览器 将图层添加到工程中,请执行以下操作:
如上所述启用 浏览器 后,将显示包含文件系统、数据库和Web服务的浏览器树。在数据库和Web服务呈现之前,您可能需要进行连接 (请参阅专用章节)。
在列表中查找图层。
使用上下文菜单、双击其名称,或将其拖放到 地图画布 中。您的图层现在已添加到 图层面板 ,并且可以在地图画布上查看。
小技巧
直接从浏览器打开QGIS工程
也可以双击其名称或拖放到地图画布,直接从浏览器面板打开QGIS工程。
加载文件后,可以使用地图导航工具对其进行缩放。要更改图层的样式,请双击图层名称或右键单击图例中的名称,然后从上下文菜单选择 ,打开 图层属性 对话框。有关为矢量图层设置符号的详细信息,请参阅 Symbology Properties 章节。
右键单击浏览器树中的项可以帮助您:
对于文件或表,显示其元数据或在您的工程中打开。表甚至可以被重命名、删除或清空。
对于文件夹,可以将其标记到您的收藏夹,或从浏览器树中隐藏。隐藏文件夹可以在 选项卡进行管理。
管理 空间书签: 书签可以作为
XML文件创建、导出和导入。创建与数据库或Web服务的连接。
刷新、重命名或删除架构。
还可以通过简单拖放将文件导入数据库,或将表从一个架构/数据库复制到另一个。第二个浏览器面板可用于避免拖动时长时间滚动,只需选择文件并从一个面板拖放到另一个面板即可。
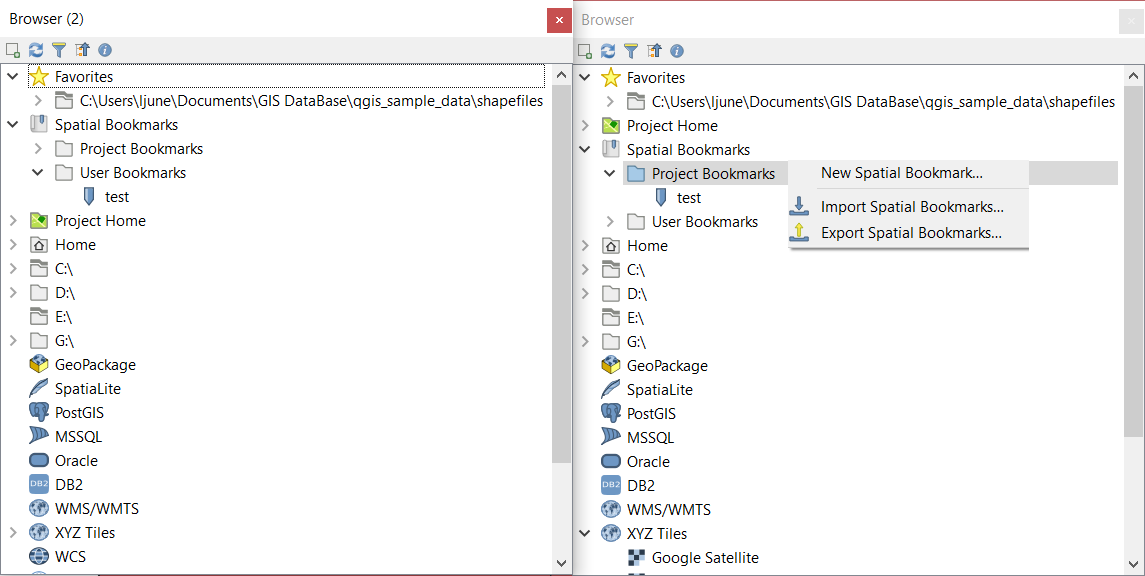
图 15.2 QGIS浏览器面板并排显示
小技巧
从操作系统文件浏览器中通过简单拖放将图层添加到QGIS
您还可以通过将文件从操作系统文件浏览器拖放到 图层面板 或地图画布来将文件添加到工程中。
15.1.2. 数据库管理器
数据库管理器 插件是另一个用于集成和管理QGIS支持的空间数据库格式 (PostGIS、SpatiaLite、地理包、Oracle Spatial、MS SQL Server、Virtual图层) 的工具。通过 菜单激活。
数据库管理器 插件提供了几个功能:
连接到数据库并显示其结构和内容
预览数据库表
通过双击或拖放将图层添加到地图画布
从QGIS浏览器或其他数据库向数据库添加图层
创建SQL查询并将其输出添加到地图画布
创建 虚拟图层
有关数据库管理器功能的更多信息,请参阅 DB Manager Plugin 。
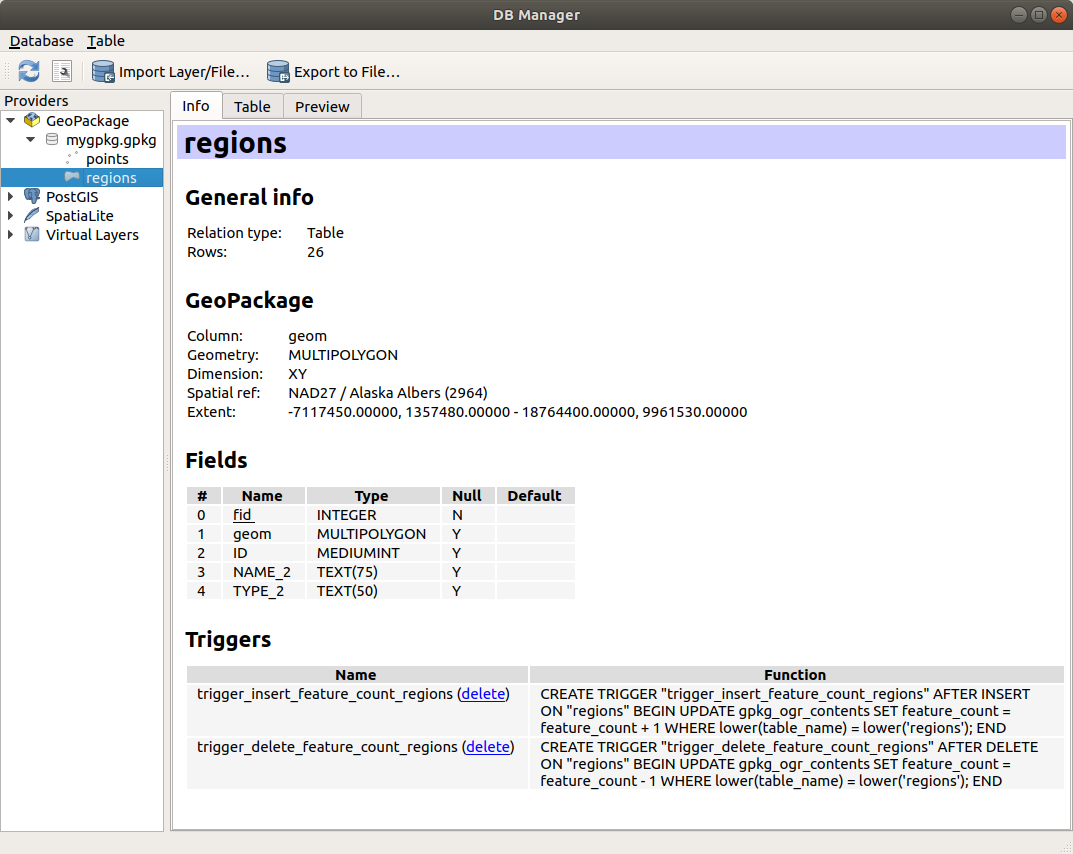
图 15.3 数据库管理器对话框
15.1.3. 基于提供程序加载工具
除了浏览器面板和数据库管理器 (QGIS提供的用于添加图层的主要工具) 之外,您还可以找到特定于数据提供程序的工具。
备注
一些 外部插件 还提供了在QGIS中打开特定文件格式的工具。
15.1.3.1. 从文件加载图层
要从文件加载图层,请执行以下操作:
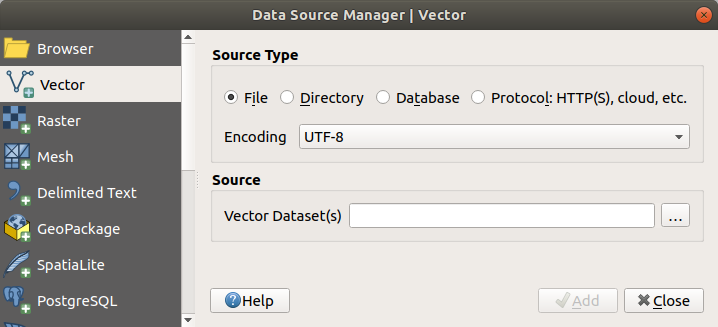
在 数据源管理器 对话框中打开图层类型选项卡,即单击
打开数据源管理器 按钮 (或按 Ctrl+L) 并启动目标选项卡或:勾选
 文件 源类型
单击 ... 浏览 按钮
导航到文件系统并加载支持的数据源。按住 Ctrl 键并单击对话框中的多个项目,或者按住 Shift 键单击范围中的第一个和最后一个项目来选择项目范围,这样可以同时加载多个图层。只有受支持的格式才会显示在格式过滤器中。可以通过选择
所有文件(下拉菜单中的顶级项) 加载其他格式。点击 打开 将选中的文件加载到 数据源管理器 对话框中
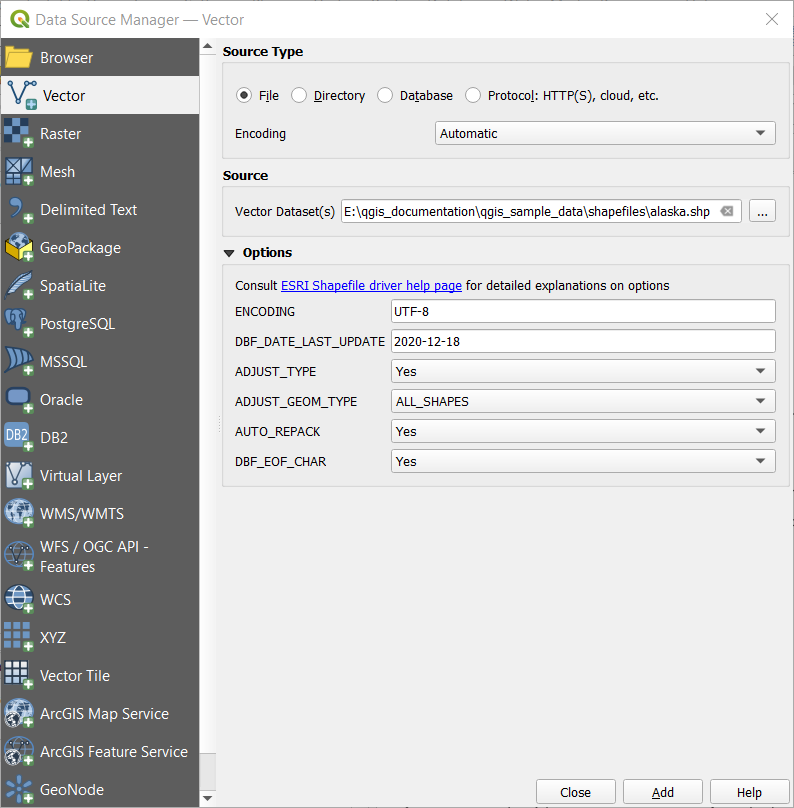
图 15.6 加载具有打开选项的形状文件
Press Add to load the file in QGIS and display them in the map view. When adding vector datasets containing multiple layers, the Select Items to Add dialog will appear. In this dialog, you can choose the specific layers from your dataset that you want to add. Also, under Options you can choose to:
 Add layers to a group
- Show system and internal tables
- Show empty vector layers.
图 15.7 shows QGIS after loading the
alaska.shpfile.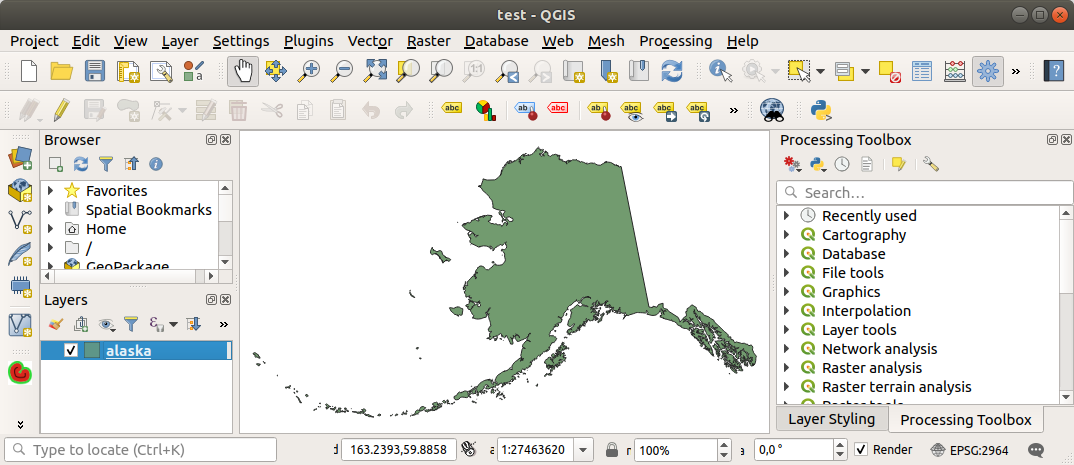
图 15.7 加载Alaska形状文件的QGIS
备注
为了加载矢量和栅格文件,GDAL驱动程序提供了定义打开操作的功能。当选择文件时,将显示这些内容。有关选项的详细说明,请参阅 https://gdal.org/en/latest/drivers/vector/ 、 https://gdal.org/en/latest/drivers/raster 。如果在QGIS中选择了文件,带有超链接的文本将直接指向所选文件类型的文档。
备注
由于某些格式如 MapInfo (.tab) 或 Autocad (.dxf) 允许在单个文件中混合不同类型的几何图形,因此在加载此类数据集会打开一个对话框,选择要使用的几何图形,以便每个图层有一个几何图形类型。
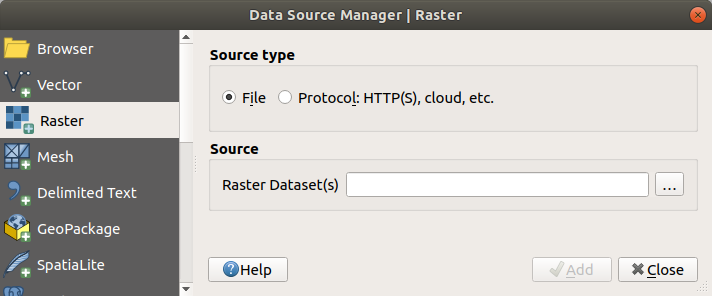
 添加矢量图层 和
  添加栅格图层 选项卡允许从 文件 其他源类型加载图层:
您可以加载特定的矢量格式,如
ArcInfo Binary Coverage、UK. National Transfer Format, 以及US Census Bureau或OpenfileGDB的原始TIGER格式。要执行此操作,请选择 目录 作为 源类型 。在这种情况下,点击 ... 浏览 后可以在对话框中选择目录。使用
数据库 源类型,可以选择现有的数据库连接或创建一个所选数据库类型的连接。一些支持的数据库类型是 ODBC,Esri个人地理数据库,MS SQL Server以及PostgreSQL或MySQL。点击 新建 按钮将打开 创建新OGR数据库连接 对话框,该对话框的参数可以在 创建存储的连接 中查找。点击 打开 从可用的表中进行选择,例如启用PostGIS数据库。
- 协议: HTTP、云及其他 源类型可以打开存储在本地或网络的数据,可以是公共访问或商业云存储服务的私有存储桶中的数据。支持的协议类型包括:
15.1.3.2. 加载网孔图层
网孔是一种具有时态和其他构件的非结构化网格。空间构件包含2D或3D空间中的顶点、边和面的集合。有关网孔图层的详细信息,请参阅 Working with Mesh Data 。
要将网孔图层添加到QGIS,请执行以下操作:
打开 对话框,方法是从 菜单或单击
打开数据源管理器 按钮。启用左侧面板上的
 网孔 选项卡
点击 ... 浏览 按钮选择文件。请查看支持的 各种格式 。
选择文件,然后点击 添加 按钮。图层添加将使用本地网孔渲染。
如果选中的文件包含多个网孔图层,将显示一个对话框,提示您选择要加载的子图层。进行选择并点击 确定 按钮,图层将使用本地网孔渲染加载。也可以将其加载到群组中。
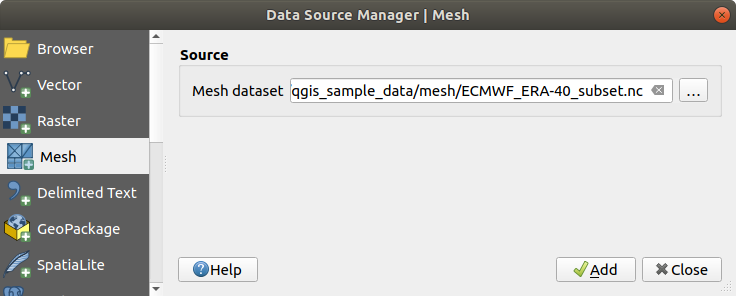
图 15.8 数据源管理器中的网孔选项卡
15.1.3.3. 导入分隔文本文件
可以使用上述工具加载分隔文本文件 (例如 .txt, .csv, .dat, .wkt)。这样,它们将显示为简单的表格。有时,分隔文本文件可能包含您想要可视化的坐标/几何图形。这就是  添加分隔文本图层 的设计目的。
单击
打开数据源管理器 图标打开 数据源管理器 对话框启用
分隔文本 选项卡单击 ... 浏览 按钮选择要导入的分隔文本文件 (例如
qgis_sample_data/csv/elevp.csv) 。在 图层名 字段中,提供用于工程中图层的名称 (例如
高程) 。配置设置以满足您的数据集和需求,如下所述。
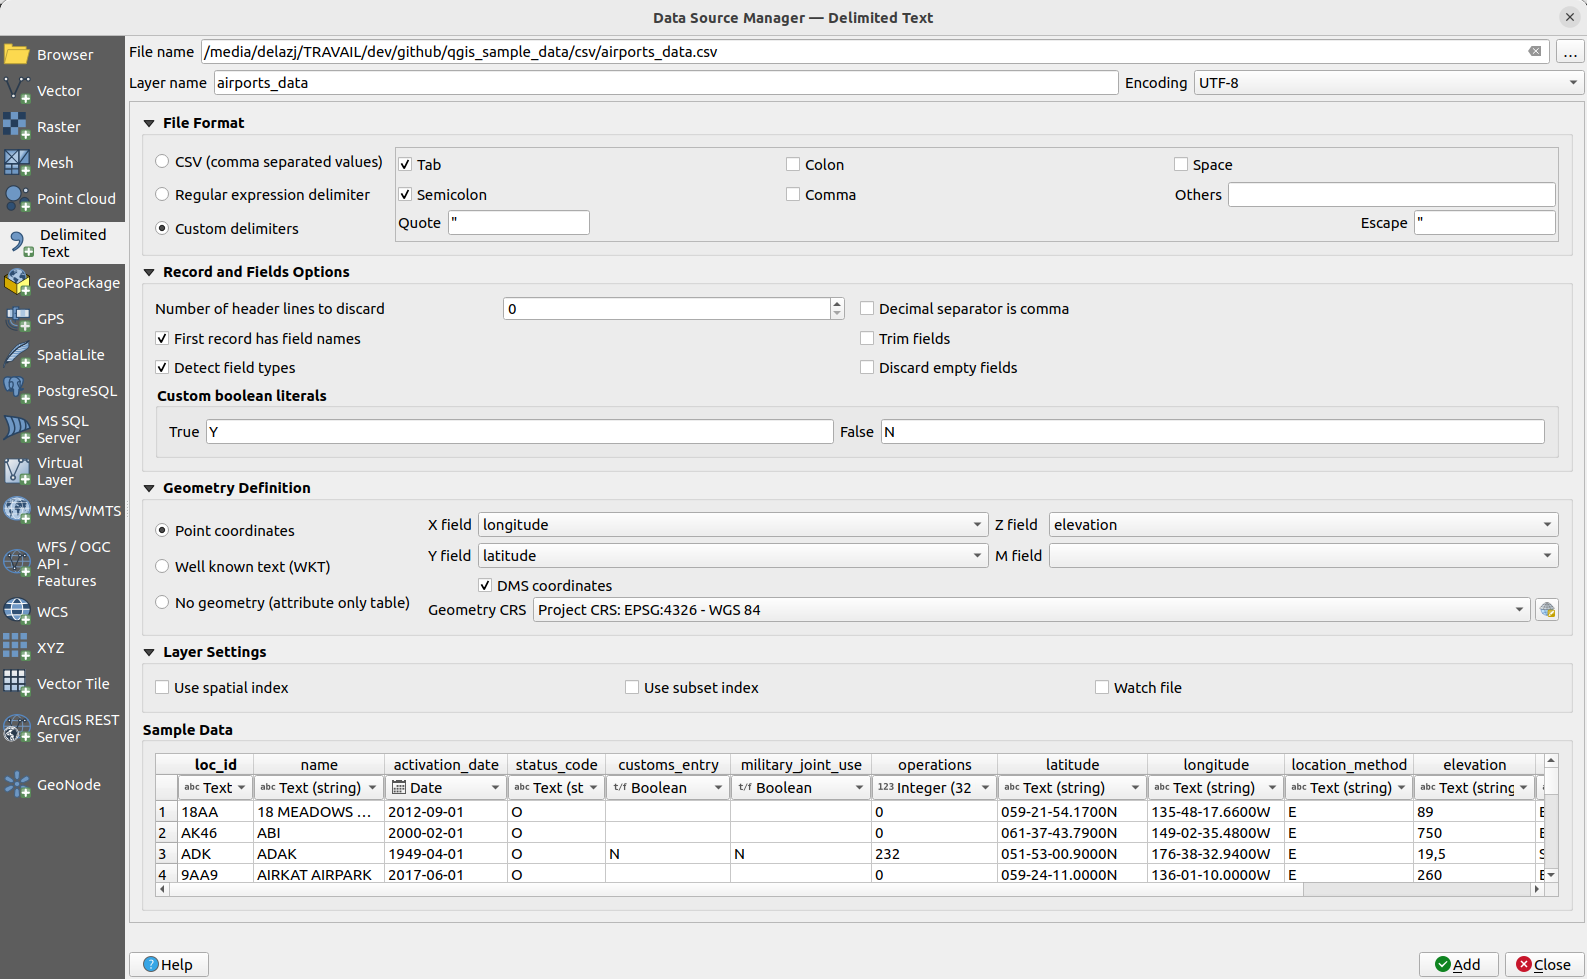
图 15.9 分隔文本对话框
文件格式
选择文件后,QGIS就会尝试用最近使用的分隔符解析文件,识别字段和行。为了使QGIS能够正确解析文件,选择正确的分隔符非常重要。您可以通过以下选项指定分隔符:
- CSV (逗号分隔值) 以使用逗号字符。
 正则表达式分隔符 ,在 表达式 字段输入文本。例如,要将分隔符更改为制表符,请使用
 \t(这在正则表达式中用于制表字符)。- 自定义分隔符, 在一些预定义分隔符中进行选择,如
逗号,空格,制表符,分号等。
记录和字段
其他一些合适的选项可用于数据识别:
从文件开头起忽略的行数: 当您想要避免导入文件中的第一行时非常方便,因为这些可能是空行或其他格式。
- 首行包含字段名称: 第一行中的值用作字段名称,否则QGIS将使用字段名
field_1,field_2等。 - 检测字段类型: 自动识别字段类型。如果不勾选,所有属性都将被视为文本字段。
- 小数点为逗号: 可以强制小数分隔符为逗号。
- 裁剪字段前后的空格: 允许从字段中裁剪前导空格和尾随空格。
- 忽略空字段 。
自定义布尔常量: 允许添加一对将被检测为布尔值的自定义字符串。
字段类型检测
QGIS尝试检查可选附属CSVT文件的内容 (请参阅: GeoCSV specification) 并扫描整个文件,以确保所有值都可以正确转换而自动检测字段类型 (除非未勾选 检测字段类型 ),回退字段类型为文本。
检测到的字段类型显示在数据样例预览表中的字段名称下,如有必要可以手动更改。
支持以下字段类型:
布尔型被解析为布尔值的不区分大小写的文字对是1/0,true/false,t/f,yes/no非负整数 (整数)非负整数 (整数 - 64位)小数: 双精度浮点数日期时间日期和时间文本
几何图形定义
解析文件后,将 几何图形定义 设置为
- 点坐标 图层为点几何图形类型并包含此类字段: X字段, Y字段, Z字段 (3D数据) 和 M字段 (测量尺寸)。如果坐标定义为度/分/秒,则激活 度分秒格式坐标 复选框。使用
 选择CRS 控件选择恰当的 几何图形CRS 。
 如果空间信息表示为WKT,则
熟知文本 (WKT) 选项是:选择包含WKT几何图形的 几何图形字段 ,选择适当的 几何图形类型 或让QGIS自动检测。使用 选择CRS 控件选择恰当的 几何图形CRS 。如果文件包含非空间数据,请激活
无几何图形 (仅属性表) ,将作为普通表加载。
图层设置
此外,您还可以启用:
- 使用空间索引 可以提高显示和空间选择要素的性能。
- 使用子集索引 可以提高 子集筛选 的性能 (在图层属性中定义时)。
- 追踪文件 在QGIS运行时追踪其他应用程序对文件的更改。
最后,单击 添加 将图层添加到地图。在我们的示例中,名称为 Elevation 的点图层被添加到工程中,其行为与QGIS中的任何其他地图图层类似。该图层是对 .csv 源文件 (因此链接到该文件) 进行查询的结果,需要 保存 才能在磁盘上获得空间图层。
示例数据
在设置解析属性时,示例数据预览会根据应用的设置进行更新。
此外,在示例数据表中,可以覆盖自动确定的列类型。
15.1.3.4. 导入DXF或DWG文件
DXF 和 DWG 文件可以通过浏览器面板的简单拖放添加到QGIS中。系统将提示您选择要添加到工程中的子图层。添加的图层具有随机样式属性。
备注
对于包含多种几何图形类型 (点、线和/或多边形) 的DXF文件,图层名称将生成为 <filename.dxf> entities <geometry type> 。
为了在QGIS中保留dxf/dwg文件结构及其符号,您可能需要使用专用的 工具,并允许:
将元素从图形文件导入到地理包数据库。
将导入的元素添加到工程中。
在 DWG/DXF导入 对话框,要导入图形文件内容,请执行以下操作:
Input the location of the Source drawing, i.e. the DWG/DXF drawing file to import.
指定图形文件中数据的坐标参照系。
Input the location of the Target package, i.e. the GeoPackage file that will store the data. If an existing file is provided, then it will be overwritten.
Choose how to import
blockswith the dedicated combobox:Expand Block Geometries: imports the blocks in the drawing file as normal elements.
Expand Block Geometries and Add Insert Points: imports the blocks in the drawing file as normal elements and adds the insertion point as a point layer.
Add Only Insert Points: adds the blocks insertion point as a point layer.
选中
使用曲线 将导入的图层提升为 曲线几何图形类型。Use the Import button to import the drawing into the destination GeoPackage file. The GeoPackage database will be automatically populated with the drawing file content. Depending on the size of the file, this can take some time.
将 .dwg 或 .dxf 数据导入地理包数据库后,对话框下半部分的框架将填充导入文件的图层列表。在此,可以选择要添加到QGIS工程的图层:
At the top, set a Group name to group the drawing files in the project. By default this is set to the filename of the source drawing file.
检查要显示的图层:每个选中图层都添加到特设组中,该组包含图形图层的点、线、标注和面积要素的矢量图层。图层的样式类似于它们最初在 *CAD 中的外观。
选择图层是否应在打开时可见。
选中
合并图层 选项可将所有图层放置在单个组中。点击 确定 在QGIS中打开图层。
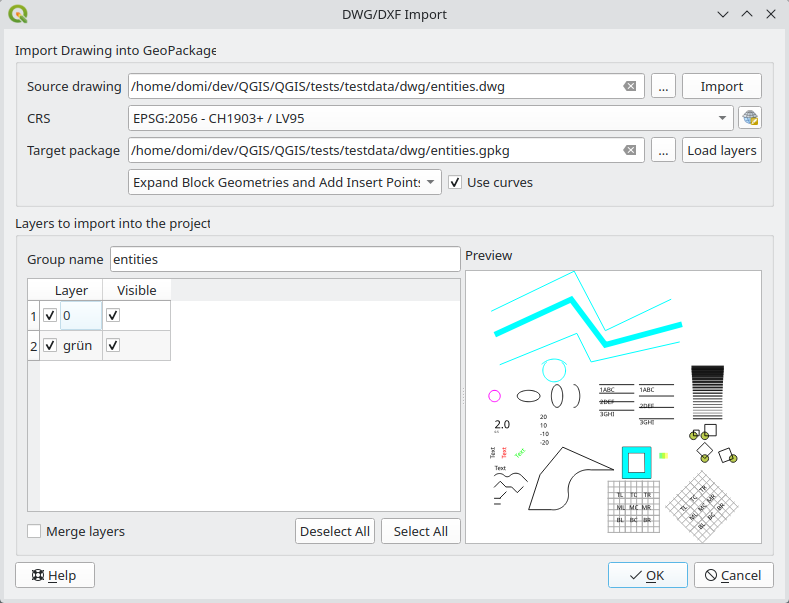
图 15.10 DWG/DXF文件的导入对话框
15.1.3.5. 导入开放街道地图矢量
开放街道地图项目之所以受欢迎,是因为许多国家没有免费的地理数据,比如数字路线图。OSM项目的目标是根据GPS数据、航空摄影和当地知识创建免费可编辑的世界地图。为了支持这一目标,QGIS提供了对OSM数据的支持。
使用 浏览器面板, 可以将 .osm 文件加载到地图画布,在此情况下,您将看到一个对话框,用于根据几何图形类型选择子图层。加载的图层将包含 .osm 文件中几何图形类型的所有数据,并保留 osm 文件的数据结构。
15.1.3.6. SpatiaLite图层
 第一次从SpatiaLite数据库加载数据时,首先执行以下操作:
单击
添加SpatiaLite图层 工具栏按钮从 菜单选择
选项或按 Ctrl+Shift+L
这将打开一个窗口,允许您连接到QGIS已知的SpatiaLite数据库 (从下拉菜单中选择),或者定义与新数据库的新连接。要定义新连接,请单击 新建 ,然后使用文件浏览器指向SpatiaLite数据库,该数据库是扩展名为 .sqlite 的文件。
QGIS还支持SpatiaLite中的可编辑视图。
15.1.3.7. GPS
有几十种不同的文件格式用于存储GPS数据。QGIS使用的格式称为GPX (GPS交换格式),这是一种标准的交换格式,可以在同一文件中包含任意数量的航点、路径和轨迹。
使用 ... 浏览 按钮选择GPX文件,然后使用复选框选择要从该GPX文件加载的要素类型。每个要素类型都将加载在一个单独的图层中。
有关GPS数据操作的更多信息,请访问 使用GPS数据 。
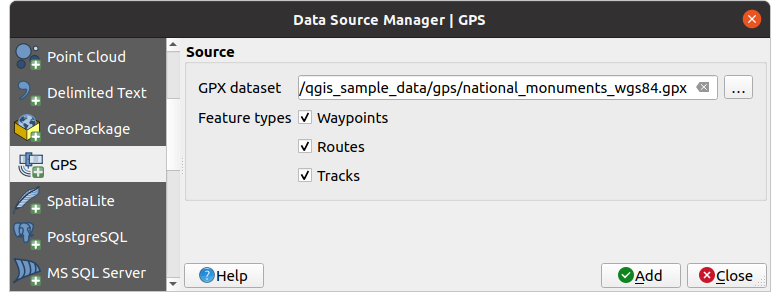
图 15.11 加载GPS数据对话框
15.1.3.8. GRASS
GRASS GIS Integration 章节介绍了使用GRASS矢量数据的方法。
15.1.3.9. 数据库相关工具
创建存储的连接
为了从QGIS支持的数据库格式读取和写入表,必须创建与该数据库的连接。虽然 QGIS浏览器面板 是连接和使用数据库的最简单和推荐的方式,但QGIS提供了其他工具与每个数据库连接并加载其表:
 或按 Ctrl+Shift+D
 或按 Ctrl+Shift+O
 或按 Ctrl+Shift+G
这些工具可从 图层管理工具栏 和 菜单访问。 SpatiaLite图层 介绍了连接到SpatiaLite数据库的方法。
小技巧
从QGIS浏览器面板创建与数据库的连接
在浏览器树中选择相应的数据库格式,右键单击并选择连接,将提供数据库连接对话框。
多数连接对话框界面类似,下面将以PostgreSQL数据库工具为例进行阐述。有关特定于其他提供程序的相关设置,可以在以下找到相应的说明:
首次使用PostGIS数据源时,必须创建与包含数据的数据库的连接。首先单击上面显示的相应按钮,打开 添加PostGIS表 对话框 (参见 图 15.15) 。要访问连接管理器,请单击:guilabel:新建 按钮以显示 新建PostGIS连接 对话框。
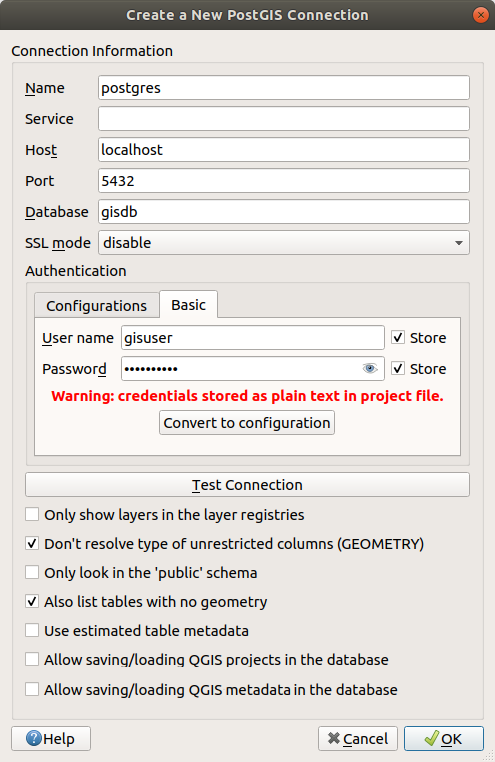
图 15.12 新建PostGIS连接对话框
PostGIS连接所需参数如下所述。对于其他数据库类型,请参阅 特殊连接要求 的差异。
名称: 此连接的名称。可以与 数据库 相同。
服务: 要替代主机名/端口 (以及可能的数据库) 使用的服务参数。可以在
pg_service.conf中定义。有关更多信息,请查看 PostgreSQL服务连接文件 章节。主机: 数据库主机的名称。必须是可解析的主机名,例如用于打开TCP/IP连接或Ping主机的名称。如果数据库与QGIS处于同一台计算机,只需在此处输入 localhost 即可。
端口: PostgreSQL数据库服务器侦听的端口号。PostGIS的默认端口为
5432。数据库: 数据库的名称。
SSL模式: SSL加密设置以下选项可用:
优先 (默认): 我不关心加密,但如果服务器支持,希望支付加密的开销。
需要: 我希望我的数据被加密并接受开销。相信网络会确保始终连接到我想要的服务器。
检验证书颁发机构: 我希望我的数据加密并接受开销。希望确保连接到我信任的服务器。
完全检验: 我希望我的数据加密并接受开销。我想确保连接到我信任的服务器,并且是由我指定的服务器。
允许: 我不关心安全性,但如果服务器坚持加密,我会支付加密的开销。
禁用: 我不关心安全性,也不想为加密支付开销。
认证, 基本:
用户名: 用于登录数据库的用户名。
密码: 与 用户名 一起使用的用于连接到数据库的密码。
您可以保存
用户名和密码参数中的任何一个或两个,在这种情况下,每次需要连接到此数据库时,默认都会使用它们。如果未保存,系统将提示您提供凭据,以便在接下来的QGIS会话中连接到数据库。您输入的连接参数存储在临时内部缓存中,并在请求同一数据库时返回用户名/密码,直到结束当前QGIS会话。警告
QGIS用户设置和安全性
在 认证 选项卡,保存 用户名 和 密码 将在连接配置中保留未受保护的凭据。例如,如果您与某人共享工程文件,这些 凭据将可见 。因此,建议将凭据保存在 认证配置 (配置 选项卡 - 更多信息请参阅 认证系统 ) 或服务连接文件中 (请参阅 PostgreSQL服务连接文件 ) 。
认证, 配置。选择认证配置。可以使用
 按钮添加配置。可选配置包括:
基本认证
PKI PKCS#12 认证
PKI路径认证
PKI存储身份证书
根据数据库的类型,可以选择激活以下复选框:
- 只显示图层注册表中的图层
- 不解析无限制的列类型 (几何图形)
- 仅查找 '公共' 架构
- 同时列出没有几何图形的表
- 使用预估表元数据
- 允许在数据库中保存/加载QGIS工程 - 更多信息 在此
- 允许在数据库中保存/加载QGIS图层元数据 - 更多信息 在此
小技巧
使用预估表元数据加快操作速度
初始化图层时,可能需要各种查询来建立存储在数据库表中的几何图形的特性。勾选 使用预估表元数据 选项时,这些查询只检查一行样本,并使用表统计信息,而不是整个表。这样可以极大地加快大型数据集的操作,但可能导致图层的错误特性描述 (例如,过滤图层的特性计数将无法准确确定),如果本应是唯一的列实际上不是,甚至可能导致奇怪的行为。
设置了所有参数和选项后,就可以单击 测试连接 按钮进行测试,或单击 确定 按钮应用连接。在 添加PostGIS表 中,现在单击 连接 ,对话框将填充所选数据库中的表 (如图 图 15.15 所示) 。
特殊连接要求
由于数据库类型的特殊性,提供的选项不尽相同。数据库特定选项如下所述。
PostgreSQL服务连接文件
服务连接文件允许PostgreSQL连接参数与单个服务名称相关联。然后,客户端可以指定该服务名称,并将使用相关的设置。
在 *nix 系统 (GNU/Linux、macOS等) 称为 .pg_service.conf ,在Windows称为 pg_service.conf 。
服务文件可能如下所示:
[water_service]
host=192.168.0.45
port=5433
dbname=gisdb
user=paul
password=paulspass

[wastewater_service]
host=dbserver.com
dbname=water
user=waterpass
备注
There are two services in the above example: water_service
and wastewater_service. You can use these to connect from QGIS,
pgAdmin, etc. by specifying only the name of the service you want to
connect to (without the enclosing brackets).
If you want to use the service with psql, you can do psql service=water_service.
可以 在此 查找所有PostgreSQL参数
备注
如果不想将密码保存在服务文件中,可以使用 .pg_pass 选项。
备注
QGIS Server and service
When using a service file and QGIS Server, you must configure the service on the server side as well. You can follow the QGIS Server documentation.
在 *nix 操作系统 (GNU/Linux、macOS等) ,可以将 .pg_service.conf 文件保存在用户的主目录,PostgreSQL客户端在此自动查找。例如,如果登录的用户是 web, 应将 .pg_service.conf 保存在 /home/web/ 目录中,以便直接工作 (无需指定任何其他环境变量)。
可以通过创建 PGSERVICEFILE 环境变量来指定服务文件的位置 (例如,在 *nix OS 操作系统运行 export PGSERVICEFILE=/home/web/.pg_service.conf 命令可以临时设置 PGSERVICEFILE 变量)
还可以将 .pg_service.conf 文件放在 pg_config --sysconfdir 或添加 PGSYSCONFDIR 环境变量来指定包含服务文件的目录,从而使服务文件在系统范围内 (所有用户) 可用。如果用户和系统文件中存在相同名称的服务定义,则优先用户文件。
警告
Windows的注意事项:
服务文件应保存为
pg_service.conf,而不是.pg_service.conf。服务文件应该以Unix格式保存才能工作。一种方法是用 Notepad++ 打开并 。
可以通过各种方式添加环境变量。一个经过测试而可靠的方式是通过 添加
PGSERVICEFILE的路径 - 例如C:\Users\John\pg_service.conf添加环境变量后,可能还需要重新启动计算机。
连接到 Oracle Spatial
Oracle spatial 中的空间要素有助于用户在Oracle数据库管理本地类型的地理和位置数据。除了 创建存储的连接 中的一些选项外,连接对话框还提供:
数据库: Oracle实例的SID或 SERVICE_NAME
端口: Oracle数据库服务器侦听的端口号。默认端口为
1521选项: Oracle连接特定选项 (例如 OCI_ATTR_PREFETCH_ROWS、OCI_ATTR_PREFETCH_MEMORY)。选项字符串的格式是以分号分隔的选项名称或选项=值对列表
工作区: 要切换到的工作区
架构: 存储数据的架构
您可以激活以下复选框 (可选):
- 仅在元数据表中查找: 将显示的表限制为
all_sdo_geom_metadata视图中的表。这可以加快空间表的初始显示。 - 仅查找用户表: 在搜索空间表时,将搜索限制为用户拥有的表。
- 同时列出没有几何图形的表: 表示默认也应列出没有几何图形的表。
- 对图层元数据使用预估表统计: 设置图层时,Oracle表需要各种元数据,包括表行数、几何图形类型和几何图形列中数据的空间范围等信息。如果表包含大量行,准确算出此表元数据可能非常耗时。通过激活此选项,将完成以下快速表元数据操作:行计数由
all_tables.num_rows确定。表范围始终由 SDO_TUNE.EXTENTS_OF 函数确定,即使应用了图层过滤也是如此。表几何图形是根据表中的前100个非空几何图形行确定的。 - 仅既有几何图形类型: 仅列出现有而不提供添加其他几何图形类型。
- 包含附加几何图形属性 。
小技巧
Oracle Spatial 图层
通常,Oracle Spatial 图层由 USER_SDO_METADATA 表中的条目定义。
为确保选择工具正常工作,建议您的表设置 主键 。
连接到 MS SQL Server
As mentioned in 创建存储的连接 QGIS allows you to create MS SQL Server connection through Data Source Manager.
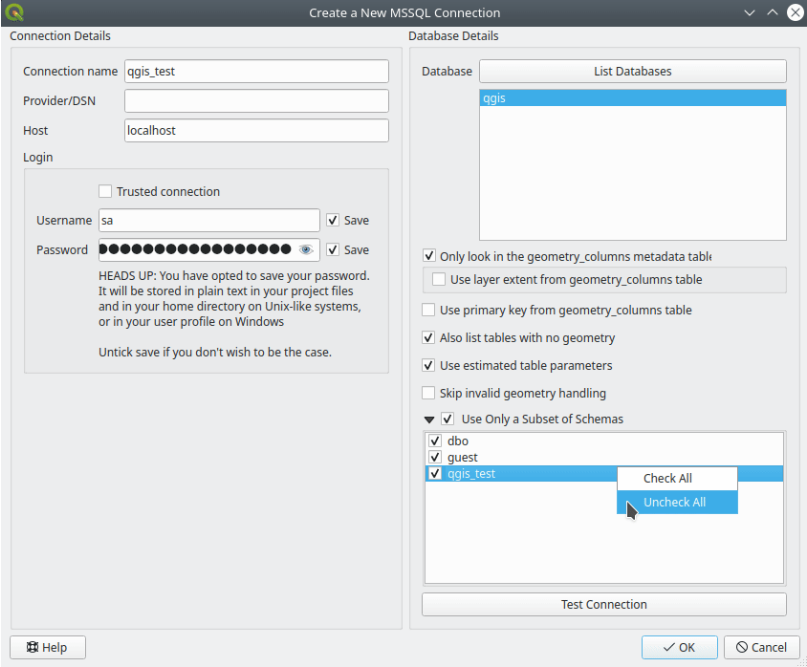
图 15.13 MS SQL Server Connection
To create a new MS SQL Server connection, you need to provide some of the following information in the Connection Details dialog:
Connection name
Provider/DSN
Host
Login information. You can choose to
Save your credentials.
Navigate to the Database Details section and click the List Databases button to view the available datasets. Select datasets that you want, then press OK. Optionally, you can also perform a Test Connection. Once you click OK the Create a New MS SQL Server Connection dialog will close and in the Data Source Manager press Connect, select a layer and then click Add.
Optionally, you can activate the following options:
- Only look in the geometry_columns metadata table.
- Use layer extent from geometry_columns table,
this checkbox is dependent on the first one; it remains disabled unless
the first option is checked.
- Use primary key from geometry_columns table
- Also list table with no geometry: tables without a
geometry column attached will also be shown in the available table list.
- Use estimated table parameters: only estimated table
metadata will be used. This avoids a slow table scan, but may result in
incorrect layer properties such as layer extent.
- Skip invalid geometry handling: all handling of records
with invalid geometry will be disabled. This speeds up the provider, however,
if any invalid geometries are present in a table then the result is unpredictable
and may include missing records. Only check this option if you are certain that
all geometries present in the database are valid, and any newly added geometries
or tables will also be valid.
- Use only a Subset of Schemas will allow you to filter
schemas for MS SQL connection. If enabled, only checked schemas will be displayed.
You can right-click to Check or Uncheck any schema
in the list.
连接到 SAP HANA
备注
需要 SAP HANA 客户端连接到 SAP HANA 数据库。可以在 SAP Development 工具网站 下载适用于您平台的 SAP HANA 客户端。
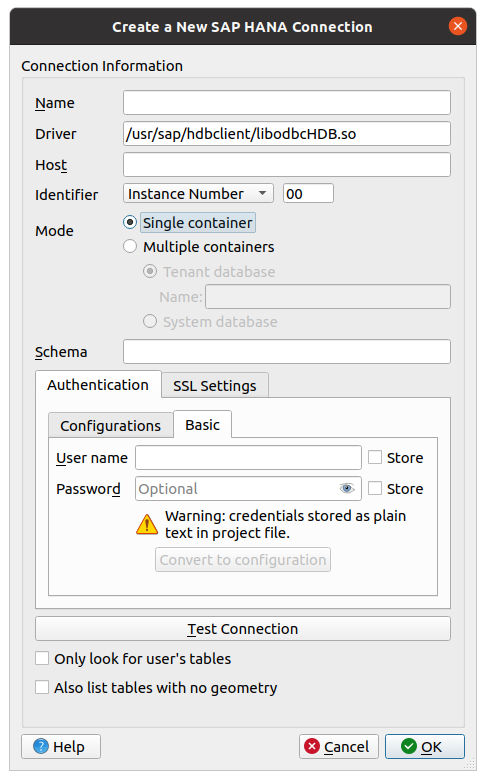
图 15.14 新建 SAP HANA 连接对话框
可以输入以下参数:
名称: 此连接的名称。
驱动
 : HANA ODBC 驱动程序的名称。如果使用64位QGIS则为
 HDBODBC,如果使用32位QGIS则为HDBODBC32。将自动输入相应的驱动程序名称。驱动

 : 在
: 在 /etc/odbcinst.ini中注册 SAP HANA ODBC 驱动程序时使用的名称,或 SAP HANA ODBC 驱动程序的完整路径。默认 SAP HANA 客户端安装程序会将ODBC驱动程序安装到/usr/sap/hdbclient/libodbcHDB.so。主机: 数据库主机的名称。
标识符: 标识主机上要连接到的实例。可以是 实例号 或 端口号 。实例号由两位数字组成,端口号在 1 到 65,535 之间。
模式: 指定 SAP HANA 实例运行的模式。只有当 标识符 设置为 实例号 时,才会考虑此设置。如果数据库托管多个容器,可以使用 Tenant数据库 中给定的名称连接到租用者,也可以连接到系统数据库。
架构: 此参数可选。如果给定了架构名称,QGIS只搜索该架构中的数据。如果此字段为空,QGIS将搜索所有架构中的数据。
。
用户名: 用于连接到数据库的用户名。
密码: 用于连接到数据库的密码。
SSL设置
- 启用 TLS/SSL 加密: 启用 TLS 1.1 - TLS1.2 加密。服务器将选择可用的最高级。
提供程序: 指定用于SSL通信的加密库提供程序。 sapcrypto 适用于所有平台, openssl 适用于
, mscrypto 适用于 , commoncrypto 需要安装CommonCryptoLib。- 验证SSL证书: 如果勾选,SSL证书将使用 带公钥的信任储存文件 中给定的信任存储库进行验证。
替换证书中的主机名: 指定用于检验服务器标识的主机名。此处指定的主机名验证服务器的标识,而不是与之建立连接的主机名。如果将
*指定为主机名,则不会验证服务器的主机名。不允许使用其他通配符。含私钥的密钥库文件: 当前已忽略。此参数允许将来通过证书进行身份验证,而不是使用用户名和密码。
带公钥的信任储存文件: 如果使用OpenSSL,则指定包含服务器公共证书的信任储存文件的路径。通常,信任储存包含根证书或对服务器的公共证书进行签名的证书颁发机构的证书。如果您正在使用加密库CommonCryptoLib或msCrypto,请将此属性留空。
- 仅查找用户表: 如果勾选,QGIS只搜索连接到数据库的用户所拥有的表和视图。
- 同时列出没有几何图形的表: 如果勾选,QGIS还会搜索不包含空间列的表和视图。
小技巧
连接到 SAP HANA 云
如果要连接到 SAP HANA 云实例,必须将 端口号 设置为 443 并勾选 启用 TLS/SSL 加密 。
加载数据库图层
定义到数据库的一个或多个连接后 (请参阅 创建存储的连接), 就可以从中加载图层。当然,这是指数据可用。有关将数据导入PostGIS数据库的讨论,请参阅 将数据导入PostgreSQL 。
要从数据库加载图层,可以执行以下步骤:
打开 "添加表" 对话框 (请参阅 创建存储的连接) 。
从下拉列表中选择连接,然后单击 连接 。
选择或取消选择
同时列出没有几何图形的表 。可选,使用某些
搜索选项 将表列表缩减为与搜索匹配的表。也可以在点击 连接 按钮之前设置此选项,从而加快数据库获取速度。在可用图层列表中查找要添加的图层。
单击即可选择。单击时按住 Shift 或 Ctrl 键可以选择多个图层。
如果适用,请使用 设置过滤 按钮 (或双击图层) 启动 查询构建器 对话框 (请参阅 查询构建器) ,并定义从所选图层加载的要素。过滤表达式显示在
sql列。可以在 框架中移除或编辑此限制。默认激活的
按ID选择列中的复选框将获取不带属性的要素ID,通常会加快数据加载速度。单击 添加 按钮将图层添加到地图。
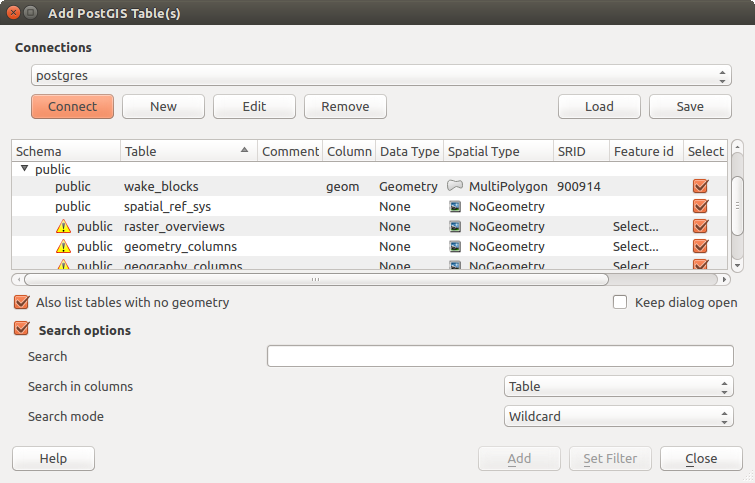
图 15.15 添加PostGIS表对话框
15.1.4. 图层元数据搜索面板
By default, QGIS can retrieve layers metadata from the connections or data providers that allow metadata storage (more details on saving metadata to the database). The Metadata search panel allows to browse the layers by their metadata and add them to the project (either with a double-click or the Add button). The list can be filtered:
by text, watching a set of metadata properties (identifier, title, abstract)
by spatial extent, using the current project extent or the map canvas extent
by the layer (geometry) type
备注
元数据的来源是通过图层元数据提供程序系统实现的,该系统可以通过插件进行扩展。
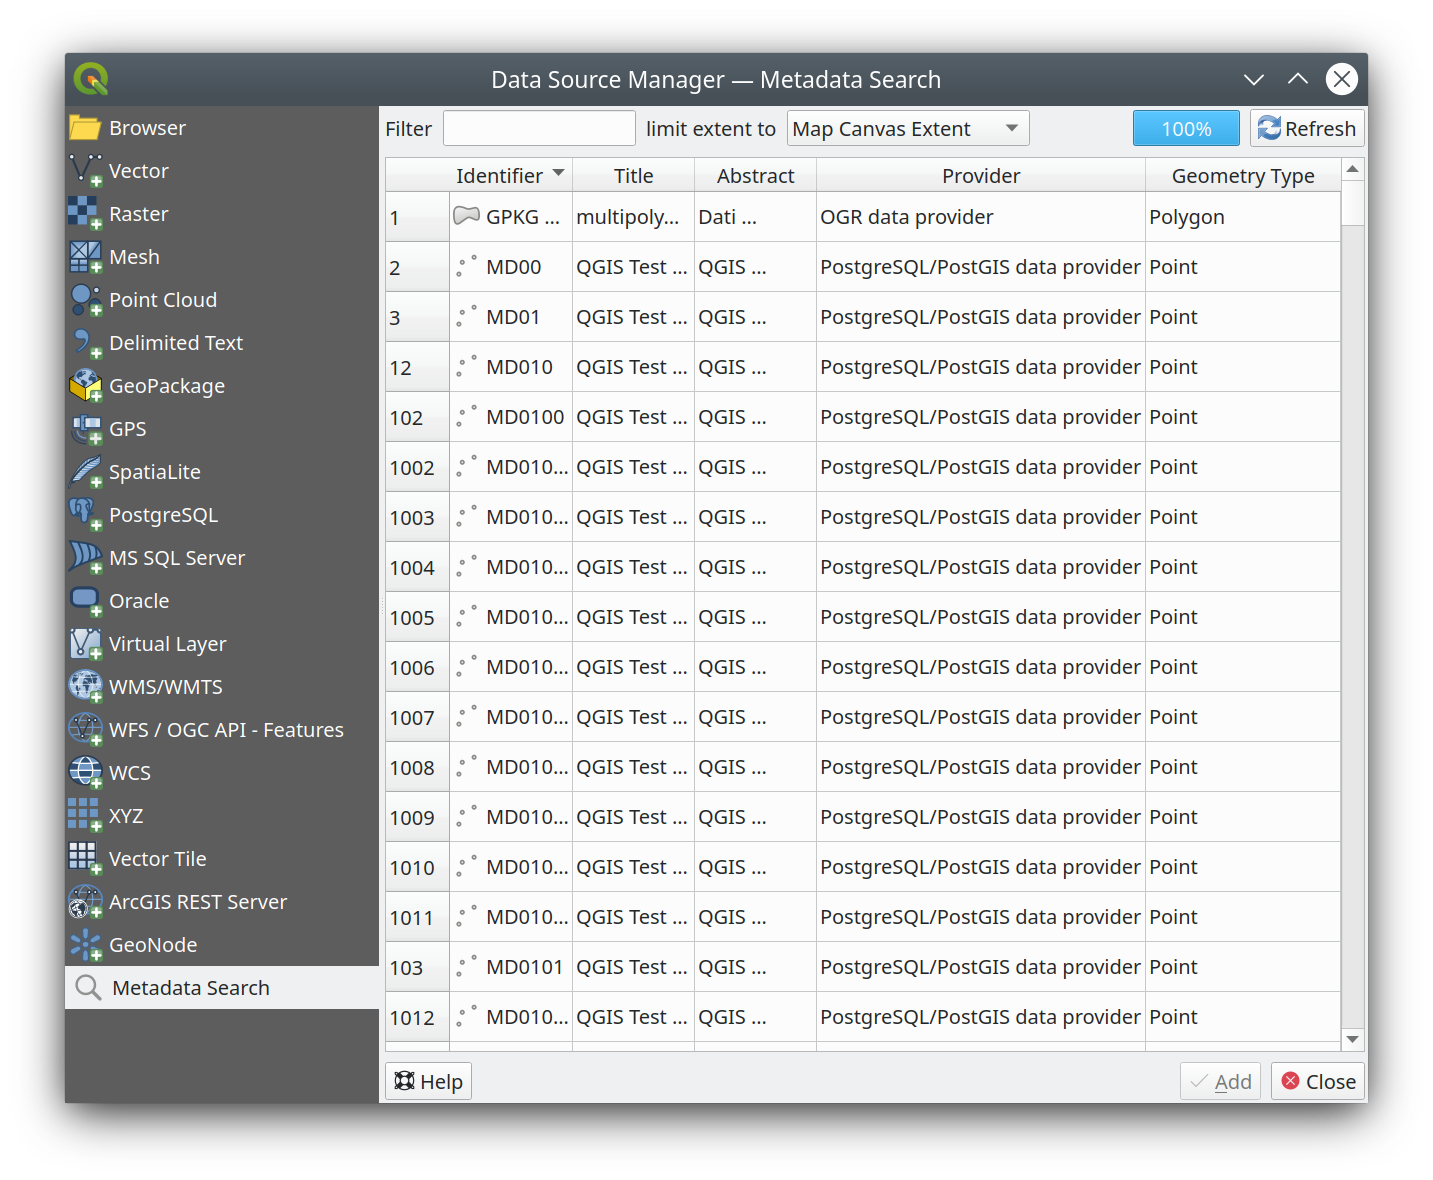
图 15.16 图层元数据搜索面板
15.1.5. QGIS自定义格式
QGIS提供了两种自定义格式:
15.1.6. QLR - QGIS图层定义文件
可以在图层上下文菜单使用 将图层定义保存为 图层定义文件 (QLR - .qlr) 。
QLR格式可以与其他QGIS用户共享 "完整" 的QGIS图层。QLR文件包含指向数据源的链接,以及为图层设置样式所需的所有QGIS样式信息。
QLR文件显示在浏览器面板中,可用于将图层 (及其保存的样式) 添加到图层面板。还可以将QLR文件从系统文件管理器拖放到地图画布。
15.1.7. 连接到Web服务
使用QGIS,可以访问不同类型的 OGC Web 服务 (WM(T)S, WFS(-T), WCS, CSW 等)。借助 QGIS Server 还可以发布此类服务。 QGIS服务器指南/手册 包含对这些功能的描述。
15.1.7.1. 使用矢量瓦片服务
可以通过 数据源管理器 对话框的  矢量瓦片 选项卡或 浏览器 面板中 矢量瓦片 条目的上下文菜单添加矢量瓦片服务。服务可以是 新建通用连接... 或 新建ArcGIS矢量瓦片服务连接... 。
您可以通过添加以下内容来设置服务:
名称
URL: 通用服务的类型为
http://example.com/{z}/{x}/{y}.pbf,基于ArcGIS的服务类型是http://example.com/arcgis/rest/services/Layer/VectorTileServer。该服务必须提供.pbf格式的瓦片。- 最小缩放级别 和 最大缩放级别: 矢量瓦片具有金字塔结构。通过使用这些选项,可以从瓦片金字塔单独生成图层。然后,这些图层将用于在QGIS中渲染矢量瓦片。
对于墨卡托投影 (OpenStreetMap矢量瓦片使用),缩放级别 0 以 1:500.000.000 的比例表示整个世界。缩放级别 14 表示的比例为 1:35.000。
样式URL: 指向 MapBox GL JSON 样式配置的URL。如果提供,那么每当将连接中的图层添加到QGIS时,就会应用该样式。对于Arcgis矢量瓦片服务连接,URL会覆盖服务器配置中指定的默认样式配置。
认证 配置 (如有必要)
引用
图 15.17 显示了带有MapTiler行星矢量瓦片服务配置的对话框。
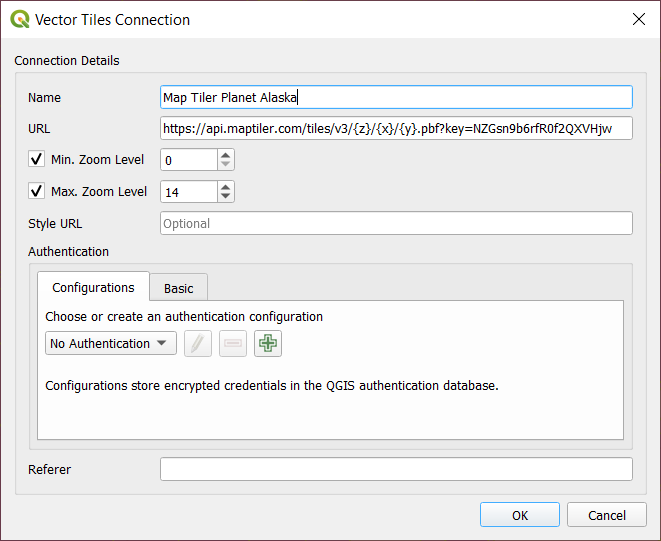
图 15.17 矢量瓦片 - Maptiler行星配置
可以通过 数据源管理器 对话框中的 矢量瓦片 条目或 浏览器 面板中的上下文菜单将配置保存到 .XML 文件 (保存连接) 。同样,也可以从文件 (加载连接) 添加配置。
设置与矢量瓦片服务的连接后,可以:
编辑 矢量瓦片连接设置
移除 连接
在 浏览器 面板的条目上右键单击,还可以:
添加图层到工程: 双击也可以添加图层
查看 图层属性... 并访问元数据以及由服务提供的数据预览。将图层加载到工程后,可以使用更多设置。
15.1.7.2. 使用XYZ瓦片服务
XYZ Tile services can be added via the  XYZ tab
of the Data Source Manager dialog or the contextual menu of the
XYZ Tiles entry in the Browser panel.
By default, QGIS provides some default and ready-to-use XYZ Tiles services:
XYZ tab
of the Data Source Manager dialog or the contextual menu of the
XYZ Tiles entry in the Browser panel.
By default, QGIS provides some default and ready-to-use XYZ Tiles services:
- Mapzen Global Terrain: 允许直接访问工程的全球DEM源。更多信息和资源,请访问 https://registry.opendata.aws/terrain-tiles/
- OpenStreetMap: 访问世界2D地图。 图 15.18 显示了具有 OpenStreetMap XYZ 瓦片服务配置的对话框。
To add a new service, press New (respectively New Connection from the Browser panel) and provide:
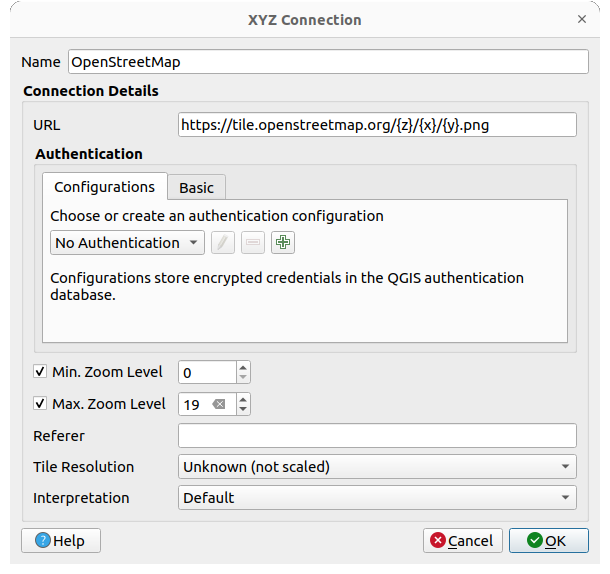
图 15.18 XYZ瓦片 - 开放街道地图配置
名称
the URL, you can add
http://example.com/{z}/{x}/{y}.pngorfile:///local_path/{z}/{x}/{y}.png认证 配置 (如有必要)
最小缩放级别 和 最大缩放级别
引用
瓦片分辨率: 可接受的值为 未知 (无缩放), 标准 (256x256 / 96DPI) 和 高 (512x512 / 192DPI)
插值: 按照预定义的编码方案将WMTS/XXYZ栅格数据集转换为单波段浮点类型的栅格图层。支持的方案有 默认 (不进行转换), MapTiler地形RGB 和 Terrarium地形RGB 。所选转换器将把RGB源值转换为每个像素的浮点值。加载后,该图层将显示为单波段浮点栅格图层,可以使用QGIS常见的 栅格渲染器 进行样式设置。
Press OK to establish the connection. It will then be possible to:
Add the new layer to the project; it is loaded with the name given in the settings.
编辑 XYZ连接设置
移除 连接
在 浏览器 面板的条目上右键单击,还可以:
, 将其另存为栅格
添加图层到工程: 双击也可以添加图层
查看 图层属性... 并访问元数据以及由服务提供的数据预览。将图层加载到工程后,可以使用更多设置。
Configurations can be saved to .XML file (Save Connections)
through the XYZ entry in Data Source Manager dialog
or its contextual menu in the Browser panel.
Likewise, they can be added from a file (Load Connections).
开放街道地图的XML文件如下所示:
<!DOCTYPE connections>
<qgsXYZTilesConnections version="1.0">
  <xyztiles url="https://tile.openstreetmap.org/{z}/{x}/{y}.png"
   zmin="0" zmax="19" tilePixelRatio="0" password="" name="OpenStreetMap"
   username="" authcfg="" referer=""/>
</qgsXYZTilesConnections>
小技巧
Loading XYZ tiles without creating a connection
It is also possible to add XYZ tiles to a project without necessarily storing
its connection settings in you user profile (e.g. for a dataset you may need once).
In the tab, edit any properties
in the Connection Details group.
The Name field above should turn into Custom.
Press Add to load the layer in the project.
It will be named by default XYZ Layer.
XYZ瓦片服务示例:
OpenStreetMap单色: URL:
http://tiles.wmflabs.org/bw-mapnik/{z}/{x}/{y}.png, 最小缩放级别: 0, 最大缩放级别: 19。谷歌地图: URL:
https://mt1.google.com/vt/lyrs=m&x={x}&y={y}&z={z}, 最小缩放级别: 0, 最大缩放级别: 19。Open Weather Map Temperature: URL:
http://tile.openweathermap.org/map/temp_new/{z}/{x}/{y}.png?appid={api_key}最小缩放级别: 0, 最大缩放级别: 19。
15.1.7.3. 使用 ArcGIS REST 服务器
可以通过 数据源管理器 对话框的  ArcGIS REST Server 选项卡或 浏览器 面板中 ArcGIS REST 服务器 条目的上下文菜单添加 ArcGIS REST 服务器。点击 新建 (分别 新建连接) 并提供:
名称
URL
共享终端URL
内容终端URL
认证 配置 (如有必要)
引用
备注
设置相应Portal终端URLS集的 ArcGIS Feature Service 连接后,可由浏览器面板中的内容组进行浏览。
如果连接设置了Portal终端,在浏览器展开连接将显示 “组” 和 “服务” 文件夹,而不是通常显示服务的完整列表。展开组文件夹将显示用户所属的所有内容组的列表,每个内容组都可以展开以显示属于该组的服务条目。
可以通过 数据源管理器 对话框中的 ArcGIS REST Server 条目将配置保存到 .XML 文件 (保存连接) 。同样,也可以从文件 (加载连接) 添加配置。
设置与 ArcGIS REST Server 的连接后,可以:
编辑 ArcGIS REST Server 连接设置
移除 连接
刷新 连接
对可用图层使用过滤
从可用列表中选择具有
仅请求与当前视图范围重叠的要素 选项的图层在 浏览器 面板的连接条目上右键单击,可以:
刷新
编辑连接...
移除连接...
显示服务信息 ,将打开默认的Web浏览器并显示服务信息。
在图层条目上右键单击,还可以:
显示服务信息 ,将打开默认的Web浏览器并显示服务信息。
添加图层到工程: 双击也可以添加图层
查看 图层属性... 并访问元数据以及由服务提供的数据预览。将图层加载到工程后,可以使用更多设置。
15.1.7.4. Using 3D tiles services
To load a 3D tiles into QGIS, use the  Scene tab
in the Data Source Manager dialog.
Scene tab
in the Data Source Manager dialog.
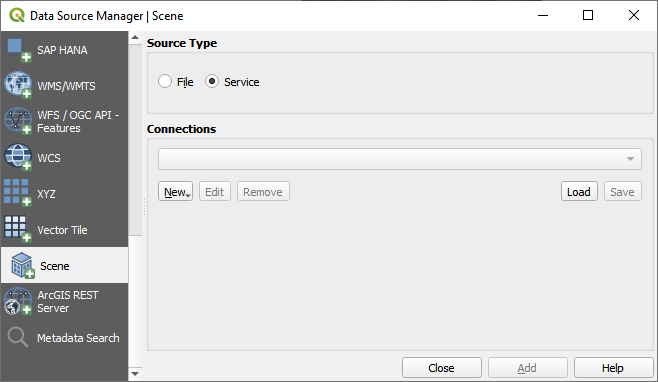
图 15.19 Data Source Manager - Scene
Create a New Cesium 3D Tiles Connection by clicking on New. Add Name and URL or add local tileset file.
Support for 3D tiles:
Remote source -
http://example.com/tileset.jsonLocal files -
file:///path/to/tiles/tileset.json
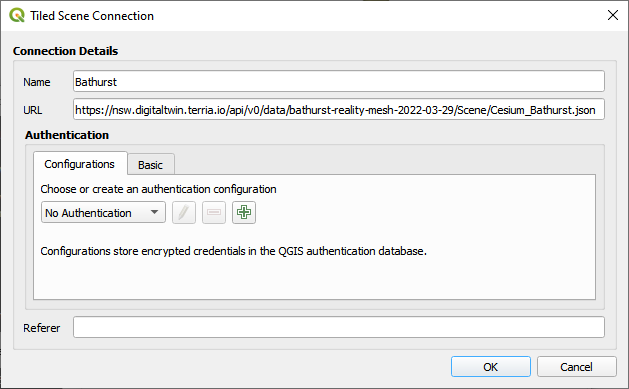
图 15.20 Tiled Scene Connection
You can also add the service from Browser Panel.
After creating new connection you are able to Add the new layer to your map.
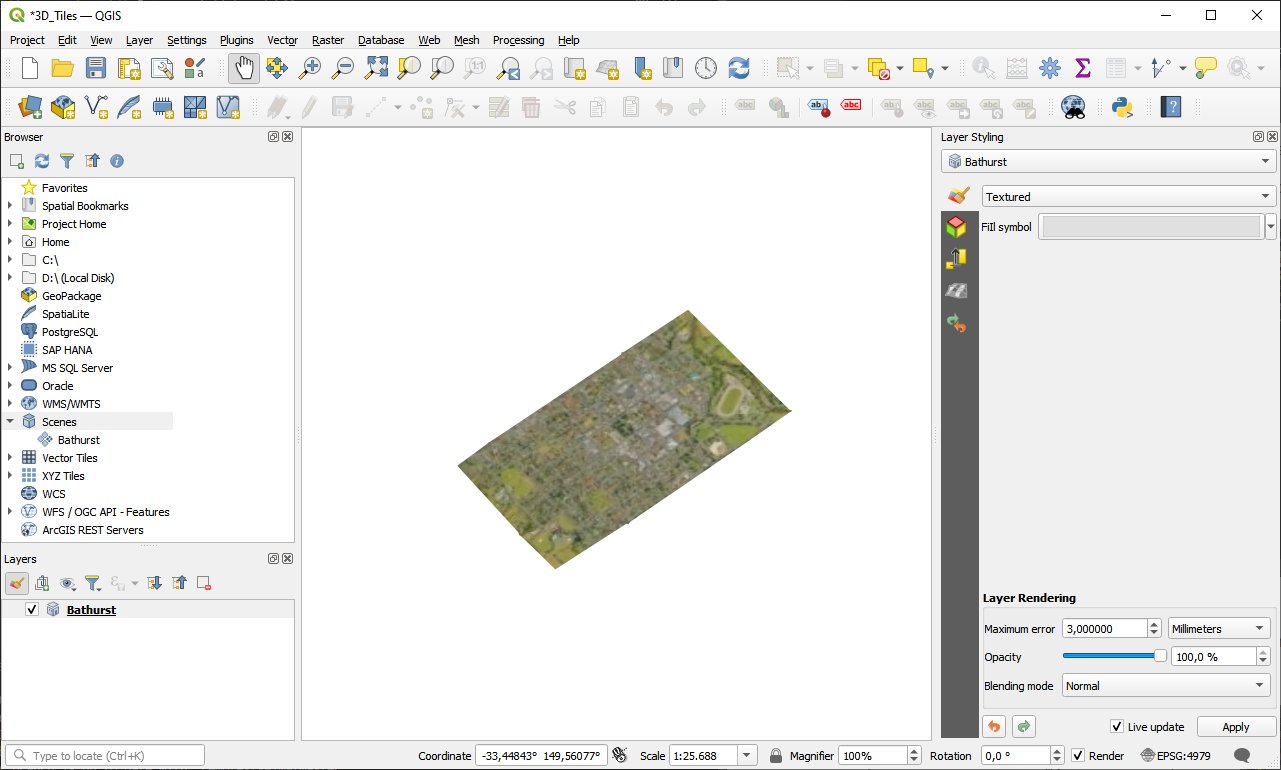
图 15.21 3D Tiles Layer - Textured