18. Working with Mesh Data
18.1. O que é uma malha?
A mesh is an unstructured grid usually with temporal and other components. The spatial component contains a collection of vertices, edges and/or faces, in 2D or 3D space:
vértices - pontos XY(Z) (no sistema de referência de coordenadas da camada)
arestas - conecta pares de vértices
faces - a face is a set of edges forming a closed shape - typically a triangle or a quadrilateral (quad), rarely polygons with more vertices
Relying on the above, mesh layers can thus have different types of structure:
1D Meshes: consist of vertices and edges. An edge connects two vertices and can have assigned data (scalars or vectors) on it. The 1D mesh network can be for example used for modelling of an urban drainage system.
2D meshes: consist of faces with triangles, regular or unstructured quads.
3D layered meshes: consist of multiple stacked 2D unstructured meshes each extruded in the vertical direction (levels) by means of a vertical coordinate. The vertices and faces have the same topology in each vertical level. The mesh definition (vertical level extrusion) could in general change in time. The data is usually defined in volume centres or by some parametric function.
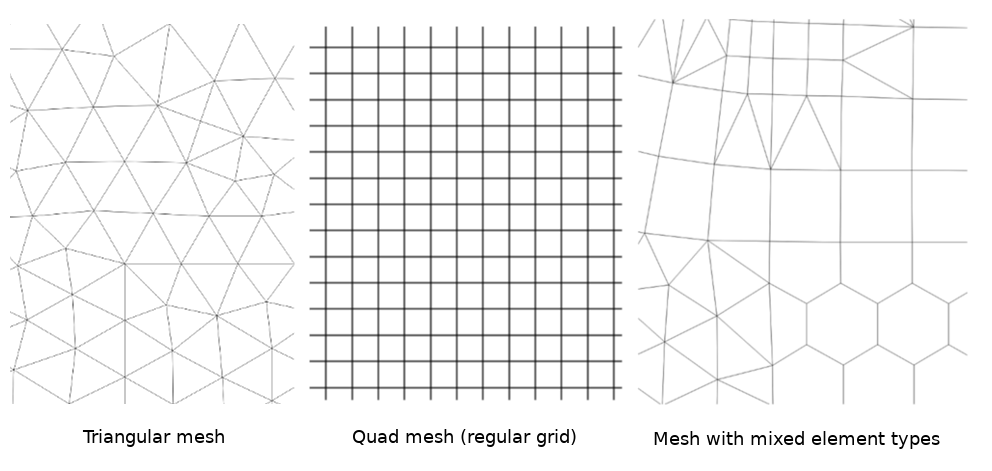
Fig. 18.1 Diferentes tipos de malha
Mesh provides information about the spatial structure. In addition, the mesh can have datasets (groups) that assign a value to every vertex. For example, having a triangular mesh with numbered vertices as shown in the image below:
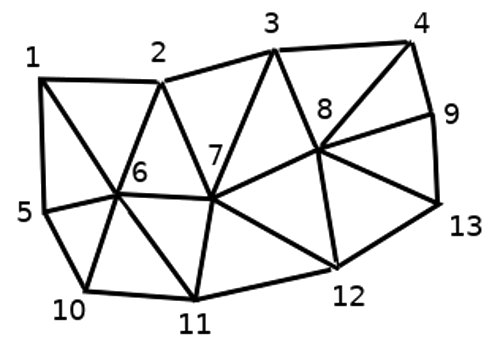
Fig. 18.2 Triangular grid with numbered vertices
Each vertex can store different datasets (typically multiple quantities), and those datasets can also have a temporal dimension. Thus, a single file may contain multiple datasets.
The following table gives an idea about the information that can be stored in mesh datasets. Table columns represent indices of mesh vertices, each row represents one dataset. Datasets can have different datatypes. In this case, it stores wind velocity at 10m at a particular moments in time (t1, t2, t3).
In a similar way, the mesh dataset can also store vector values for each vertex. For example, wind direction vector at the given time stamps:
10 metros de vento |
1 |
2 |
3 |
… |
|---|---|---|---|---|
10 metros de velocidade no tempo=t1 |
17251 |
24918 |
32858 |
… |
10 metros de velocidade no tempo=t2 |
19168 |
23001 |
36418 |
… |
10 metros de velocidade no tempo=t3 |
21085 |
30668 |
17251 |
… |
… |
… |
… |
… |
… |
10m wind direction time=t1 |
[20,2] |
[20,3] |
[20,4.5] |
… |
10m wind direction time=t2 |
[21,3] |
[21,4] |
[21,5.5] |
… |
10m wind direction time=t3 |
[22,4] |
[22,5] |
[22,6.5] |
… |
… |
… |
… |
… |
… |
We can visualize the data by assigning colors to values (similarly to how it is done with Singleband pseudocolor raster rendering) and interpolating data between vertices according to the mesh topology. It is common that some quantities are 2D vectors rather than being simple scalar values (e.g. wind direction). For such quantities it is desirable to display arrows indicating the directions.
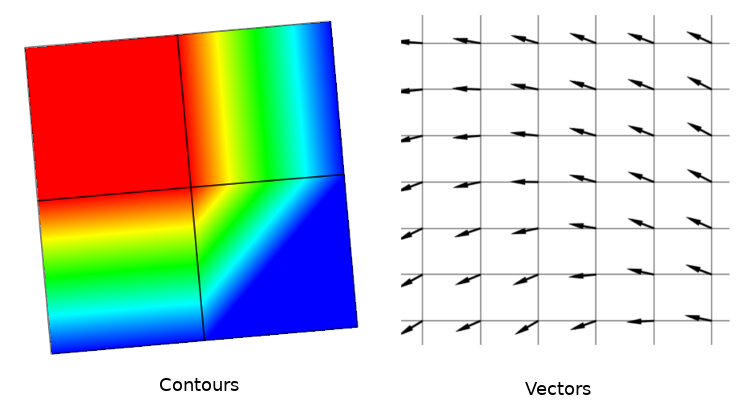
Fig. 18.3 Possível visualização de dados de malha
18.2. Formatos suportados
O QGIS acessa os dados da malha utilizando os MDAL drivers, e suporta nativamente uma variedade de formatos. Se o QGIS pode editar uma camada de malha depende do formato e do tipo de estrutura da malha.
To load a mesh dataset into QGIS, use the  Mesh tab
in the Data Source Manager dialog. Read Carregando uma camada de malha for
more details.
Mesh tab
in the Data Source Manager dialog. Read Carregando uma camada de malha for
more details.
18.3. Mesh Dataset Properties
The Layer Properties dialog for a mesh layer provides general settings to manage dataset groups of the layer and their rendering (active dataset groups, symbology, 2D and 3D rendering). It also provides information about the layer.
Para acessar a caixa de diálogo: guilabel: Propriedades da camada:
No painel: guilabel: Camadas, clique duas vezes na camada ou clique com o botão direito do mouse e selecione: guilabel:` Propriedades… `no menu pop-up;
Vá para: seleção de menu: menu Camada -> Propriedades da camada … `quando a camada estiver selecionada.
The mesh Layer Properties dialog provides the following sections:
|
||
|
||
[1] Also available in the Layer styling panel
Nota
Most of the properties of a mesh layer can be saved to or loaded from
a .qml using the Style menu at the bottom of the dialog.
More details at Gerenciar Estilos Personalizados.
18.3.1. Propriedades da informação
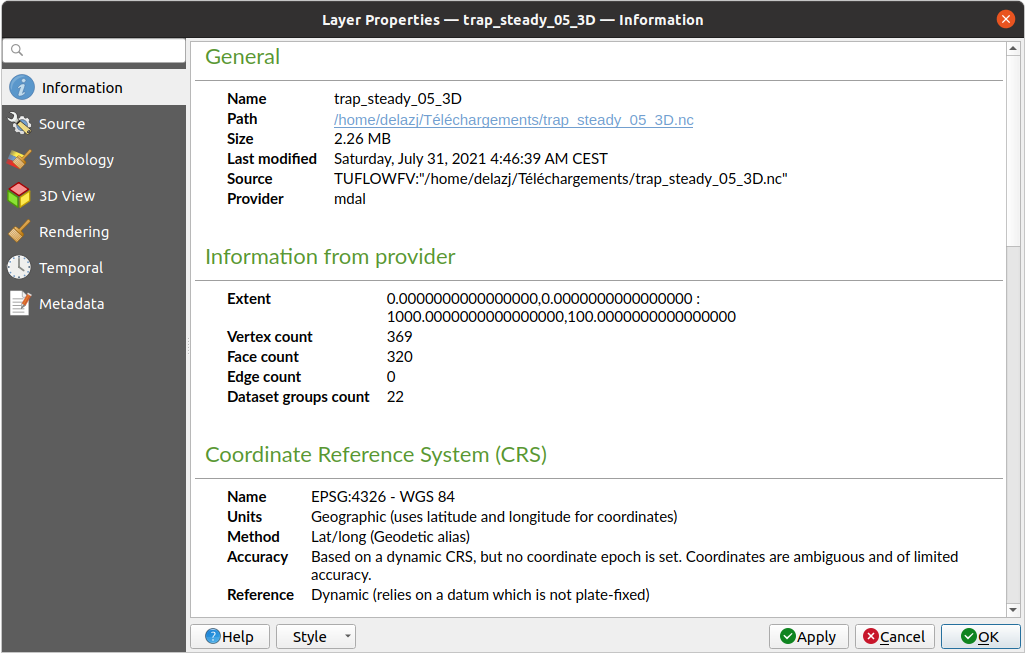
Fig. 18.4 Mesh Layer Information Properties
The  Information tab is read-only and represents an interesting
place to quickly grab summarized information and metadata on the current layer.
Provided information are:
Information tab is read-only and represents an interesting
place to quickly grab summarized information and metadata on the current layer.
Provided information are:
general such as name in the project, source path, list of auxiliary files, last save time and size, the used provider
com base no provedor da camada: extensão, vértice, face, arestas e/ou contagem de grupos de conjuntos de dados
o Sistema de Referência de Coordenadas: nome, unidades, método, precisão, referência (ou seja, se é estático ou dinâmico)
extracted from filled metadata: access, extents, links, contacts, history…
18.3.2. Propriedades de origem
The  Source tab displays basic information about
the selected mesh, including:
Source tab displays basic information about
the selected mesh, including:
Fig. 18.5 Mesh Layer Source Properties
the layer name to display in the Layers panel
setting the Coordinate Reference System: Displays the layer’s Assigned Coordinate Reference System (CRS). You can change the layer’s CRS by selecting a recently used one in the drop-down list or clicking on
 Select CRS button (see Seletor do Sistemas de Referência de Coordenadas).
Use this process only if the CRS applied to the layer is wrong or
if none was applied.
Select CRS button (see Seletor do Sistemas de Referência de Coordenadas).
Use this process only if the CRS applied to the layer is wrong or
if none was applied.The Available datasets frame lists all the dataset groups (and subgroups) in the mesh layer, with their type and description in a tree view. Both regular datasets (i.e. their data is stored in the file) and virtual datasets (which are calculated on the fly) are listed.
Use the
 Assign extra dataset to mesh button to add more
groups to the current mesh layer.
Assign extra dataset to mesh button to add more
groups to the current mesh layer. Collapse all and
  Expand
all the dataset tree, in case of embedded groups
Expand
all the dataset tree, in case of embedded groupsSe você estiver interessado em poucos conjuntos de dados, poderá desmarcar os outros e torná-los indisponíveis no projeto
Clique duas vezes sobre um nome e você poderá renomear o conjunto de dados.
 Reset to defaults: checks all the groups and
renames them back to their original name in the provider.
Reset to defaults: checks all the groups and
renames them back to their original name in the provider.Clique com o botão direito do mouse em um grupo de conjuntos de dados virtuais e você poderá:
Remove dataset group from the project
Save dataset group as… a file on disk, to any supported format. The new file is kept assigned to the current mesh layer in the project.
Checking the
 Treat as static dataset group allows
to ignore the map temporal navigation properties
while rendering the mesh layer.
For each active dataset group (as selected in
Treat as static dataset group allows
to ignore the map temporal navigation properties
while rendering the mesh layer.
For each active dataset group (as selected in 
 Datasets tab), you can:
set to None: the dataset group is not displayed at all
Display dataset: e.g., for the “bed elevation” dataset which is not time aware
extract a particular date time: the dataset matching the provided time is rendered and stay fixed during map navigation.
18.3.3. Propriedades da simbologia
Click the Symbology button to activate the dialog.
Symbology properties are divided into several tabs:
18.3.3.1. Conjunto de dados
The tab Datasets is the main place to control and set which
datasets will be used for the layer. It presents the following items:
Groups available in the mesh dataset, with whether they provide:
 scalar dataset
or
 vector dataset: by default, each vector dataset has
a scalar dataset representing its magnitude automatically generated.
vector dataset: by default, each vector dataset has
a scalar dataset representing its magnitude automatically generated.
Click on the icon next to the dataset name to select the group and type of data to represent.
Selected dataset group(s) metadata, with details on:
the mesh type: edges or faces
o tipo de dados: vértices, arestas, faces ou volume
se é do tipo vetorial ou não
o nome original na camada de malha
a unidade, se aplicável
blending mode available for the selected datasets.
Fig. 18.6 Mesh Layer Datasets
Você pode aplicar simbologia ao vetor e/ou grupo escalar selecionado usando as próximas abas.
18.3.3.2. Simbologia de Contornos
Nota
The  Contours tab can be activated only if a
scalar dataset has been selected in the Datasets tab.
Contours tab can be activated only if a
scalar dataset has been selected in the Datasets tab.
In the Contours tab you can see and change the current
visualization options of contours for the selected group, as shown in
Fig. 18.7 below:
Fig. 18.7 Styling Contours in a Mesh Layer
For 1D mesh, set the Stroke width of the edges. This can be a fixed size for the whole dataset, or vary along the geometry (more details with the interpolated line renderer)
Use the slider or the spinbox to set the Opacity of the current group, if of a 2D mesh type.
Enter the range of values you want to represent on the current group: use
Load to fetch the min and max values of the current group
or enter custom values if you want to exclude some.For 2D/3D meshes, select the Resampling method to interpolate the values on the surrounding vertices to the faces (or from the surrounding faces to the vertices) using the Neighbour average method. Depending on whether the dataset is defined on the vertices (respectively on the faces), QGIS defaults this setting to None (respectively Neighbour average) method in order to use values on vertices and keep the default rendering smooth.
Classify the dataset using the color ramp shader classification.
18.3.3.3. Simbologia de Vetores
Nota
The  Vectors tab can be activated only if a
vector dataset has been selected in the Datasets tab.
Vectors tab can be activated only if a
vector dataset has been selected in the Datasets tab.
Na aba Vetores você pode ver e alterar as opções atuais de visualização de vetores para o grupo selecionado, como mostrado em Fig. 18.8:
Fig. 18.8 Styling Vectors in a Mesh Layer with arrows
Mesh vector dataset can be styled using various types of Symbology:
Arrows: vectors are represented with arrows at the same place as they are defined in the raw dataset (i.e. on the nodes or center of elements) or on a user-defined grid (hence, they are evenly distributed). The arrow length is proportional to the magnitude of the arrow as defined in the raw data but can be scaled by various methods.
Streamlines: vectors are represented with streamlines seeded from start points. The seeding points can start from the vertices of the mesh, from a user grid or randomly.
Traces: a nicer animation of the streamlines, the kind of effect you get when you randomly throws sand in the water and see where the sand items flows.
As propriedades disponíveis dependem da simbologia selecionada, conforme mostrado na tabela a seguir.
Label |
Descrição e Propriedades |
Seta |
Streamlines |
Traços |
|---|---|---|---|---|
Line width |
Largura da representação vetorial |
|
|
|
Coloring method |
|
|
|
|
Filter by magnitude |
Only vectors whose length for the selected dataset falls between a Min and Max range are displayed |
|
|
|
Display on user grid |
Places the vector on a grid with custom X spacing and Y spacing and interpolates their length based on neighbours |
|
|
|
Head options |
Length and Width of the arrow head, as a percentage of its shaft length |
|
||
Arrow length |
|
|
||
Streamlines seeding method |
|
|
||
Particles count |
A quantidade de “areia” que você deseja jogar na visualização |
|
||
Max tail length |
The time until the particle fades out |
|
18.3.3.4. Renderização
In the tab  Rendering tab, QGIS offers possibilities to
display and customize the mesh structure. Line width and
Line color can be set to represent:
Rendering tab, QGIS offers possibilities to
display and customize the mesh structure. Line width and
Line color can be set to represent:
as arestas para malhas 1D
Para malhas 2D:
Native mesh rendering: shows original faces and edges from the layer
Triangular mesh rendering: adds more edges and displays the faces as triangles
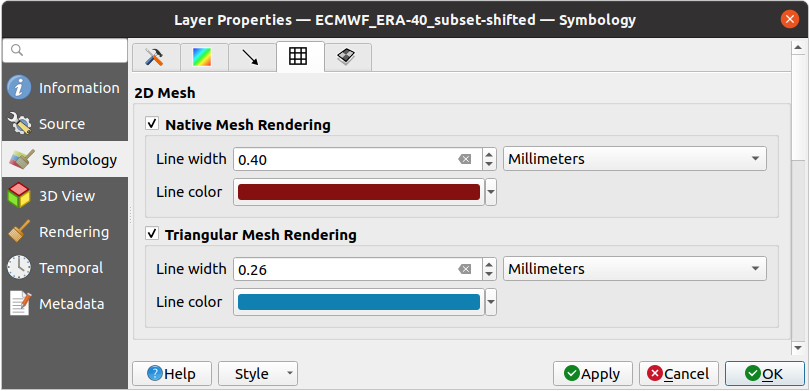
Fig. 18.9 2D Mesh Rendering
18.3.3.5. Stacked mesh averaging method
3D layered meshes consist of multiple stacked 2D unstructured meshes each
extruded in the vertical direction (levels) by means of a vertical
coordinate. The vertices and faces have the same topology in each vertical level.
Values are usually stored on the volumes that are regularly stacked over
base 2d mesh. In order to visualise them on 2D canvas, you need to convert
values on volumes (3d) to values on faces (2d) that can be shown in mesh layer.
The  Stacked mesh averaging method provides different
averaging/interpolation methods to handle this.
Stacked mesh averaging method provides different
averaging/interpolation methods to handle this.
You can select the method to derive the 2D datasets and corresponding parameters (level index, depth or height values). For each method, an example of application is shown in the dialog but you can read more on the methods at https://fvwiki.tuflow.com/index.php?title=Depth_Averaging_Results.
18.3.4. Propriedades da vista 3D
Mesh layers can be used as terrain in a 3D map view
based on their vertices Z values. From the  3D View properties tab,
it’s also possible to render the mesh layer’s dataset in the same 3D view.
Therefore, the vertical component of the vertices can be set equal to dataset
values (for example, level of water surface) and the texture of the mesh can
be set to render other dataset values with color shading (for example velocity).
3D View properties tab,
it’s also possible to render the mesh layer’s dataset in the same 3D view.
Therefore, the vertical component of the vertices can be set equal to dataset
values (for example, level of water surface) and the texture of the mesh can
be set to render other dataset values with color shading (for example velocity).
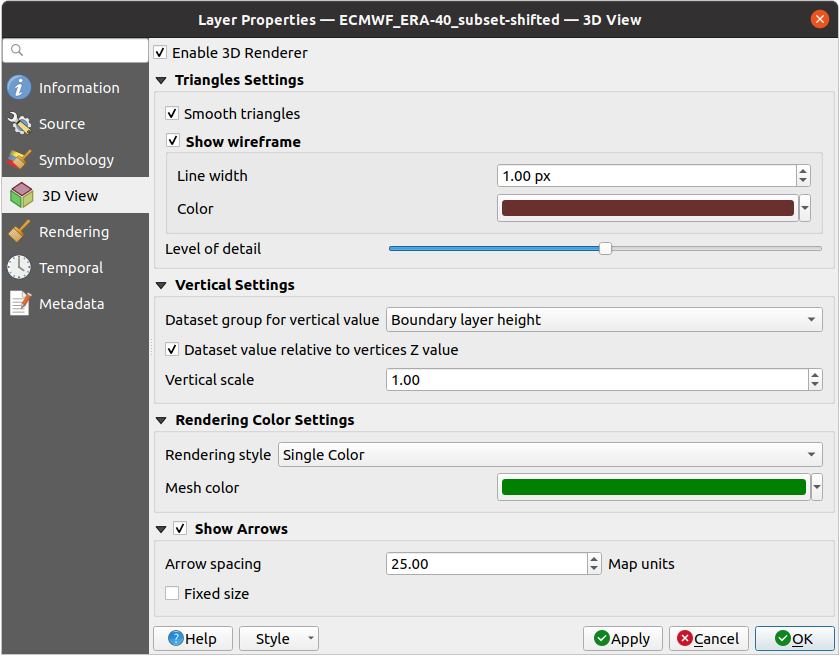
Fig. 18.10 Propriedades 3D do conjunto de dados de malha
Check  Enable 3D Renderer and you can edit following
properties:
Enable 3D Renderer and you can edit following
properties:
Under Triangle settings
Smooth triangles: Angles between consecutive triangles are smoothed for a better 3D rendering
Show wireframe whose you can set the Line width and Color
Level of detail: Controls how simplified the mesh layer to render should be. On the far right, it is the base mesh, and the more you go left, the more the layer is simplified and is rendered with less details. This option is only available if the Simplify mesh option under the Rendering tab is activated.
- Vertical settings to control behavior of the vertical component
de vértices de triângulos renderizados
Dataset group for vertical value: the dataset group that will be used for the vertical component of the mesh
- Dataset value relative to vertices Z value: whether
to consider the dataset values as absolute Z coordinate or relative to
the vertices native Z value
Vertical scale: the scale factor to apply to the dataset Z values
Rendering color settings with a Rendering style that can be based on the color ramp shader set in Simbologia de Contornos (2D contour color ramp shader) or as a Single color with an associated Mesh color
Show arrows: displays arrows on mesh layer dataset 3D entity, based on the same vector dataset group used in the vector 2D rendering. They are displayed using the 2D color setting. It’s also possible to define the Arrow spacing and, if it’s of a Fixed size or scaled on magnitude. This spacing setting defines also the max size of arrows because arrows can’t overlap.
18.3.5. Propriedades de Renderização
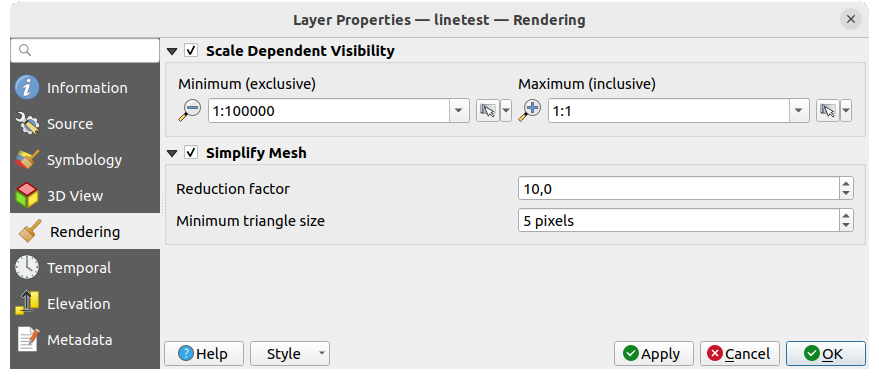
Fig. 18.11 Mesh rendering properties
Under the Scale dependent visibility group box,
you can set the Maximum (inclusive) and Minimum
(exclusive) scale, defining a range of scale in which mesh elements will be
visible. Out of this range, they are hidden. The  Set to current canvas scale button helps you use the current map
canvas scale as boundary of the range visibility.
See Visibility Scale Selector for more information.
Set to current canvas scale button helps you use the current map
canvas scale as boundary of the range visibility.
See Visibility Scale Selector for more information.
Nota
You can also activate scale dependent visibility on a layer from within the Layers panel: right-click on the layer and in the contextual menu, select Set Layer Scale Visibility.
Como as camadas de malha podem ter milhões de faces, sua renderização às vezes pode ser muito lenta, especialmente quando todas as faces são exibidas na visualização, embora sejam muito pequenas para serem visualizadas. Para acelerar a renderização, você pode simplificar a camada de malha, resultando em uma ou mais malhas representando diferentes níveis de detalhes e selecionar em qual nível de detalhe você gostaria que o QGIS renderizasse a camada de malha. Observe que a malha simplificada contém apenas faces triangulares.
From the  Rendering tab, check
Simplify mesh and set:
Rendering tab, check
Simplify mesh and set:
a Reduction factor: Controls generation of successive levels of simplified meshes. For example, if the base mesh has 5M faces, and the reduction factor is 10, the first simplified mesh will have approximately 500 000 faces, the second 50 000 faces, the third 5000,… If a higher reduction factor leads quickly to simpler meshes (i.e. with triangles of bigger size), it produces also fewer levels of detail.
Minimum triangle size: the average size (in pixels) of the triangles that is permitted to display. If the average size of the mesh is lesser than this value, the rendering of a lower level of details mesh is triggered.
18.3.6. Propriedades Temporais
The  Temporal tab provides options to control
the rendering of the layer over time. It allows to dynamically display
temporal values of the enabled dataset groups. Such a dynamic rendering
requires the temporal navigation to be enabled
over the map canvas.
Temporal tab provides options to control
the rendering of the layer over time. It allows to dynamically display
temporal values of the enabled dataset groups. Such a dynamic rendering
requires the temporal navigation to be enabled
over the map canvas.
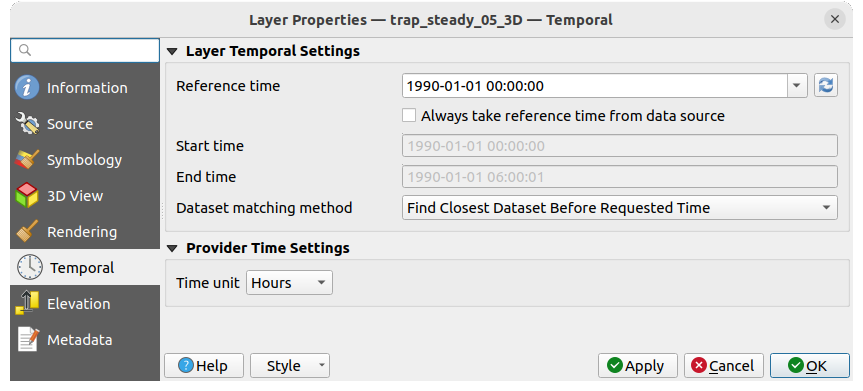
Fig. 18.12 Propriedades temporais da malha
Configurações da camada temporal
Reference time of the dataset group, as an absolute date time. By default, QGIS parses the source layer and returns the first valid reference time in the layer’s dataset group. If unavailable, the value will be set by the project time range or fall back to the current date. The Start time and End time to consider are then calculated based on the internal timestamp step of the dataset.
It is possible to set a custom Reference time (and then the time range), and revert the changes using the
Reload from provider button.
With Always take reference time from data source checked,
you ensure that the time properties are updated from the file
each time the layer is reloaded or the project reopened.Dataset matching method: determines the dataset to display at the given time. Options are Find closest dataset before requested time or Find closest dataset from requested time (after or before).
Provider time settings
Time unit extracted from the raw data, or user defined. This can be used to align the speed of the mesh layer with other layers in the project during map time navigation. Supported units are Seconds, Minutes, Hours and Days.
18.3.7. Elevation Properties
The  Elevation tab provides options to control
the layer elevation properties within a 3D map view
and its appearance in the profile tool charts.
Specifically, you can set:
Elevation tab provides options to control
the layer elevation properties within a 3D map view
and its appearance in the profile tool charts.
Specifically, you can set:
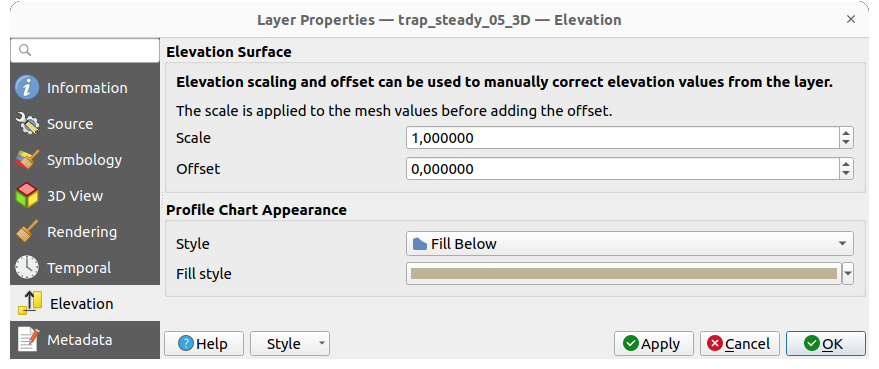
Fig. 18.13 Mesh Elevation properties
Elevation Surface: how the mesh layer vertices Z values should be interpreted as terrain elevation. You can apply a Scale factor and an Offset.
Profile Chart Appearance: controls the rendering Style the mesh elevation will use when drawing a profile chart. It can be set as:
a profile Line with a line style applied
a surface with Fill below and a corresponding fill style
18.3.8. Propriedades dos Metadados
The  Metadata tab provides you with options
to create and edit a metadata report on your layer.
See Metadados for more information.
Metadata tab provides you with options
to create and edit a metadata report on your layer.
See Metadados for more information.
18.4. Editando uma camada de malha
QGIS allows to create a mesh layer from scratch or based on an existing one. You can create/modify the geometries of the new layer whom you can assign datasets afterwards. It’s also possible to edit an existing mesh layer. Because the editing operation requires a frames-only layer, you will be asked to either remove any associated datasets first (make sure you have them available if they still are necessary) or create a copy (only geometries) of the layer.
Nota
O QGIS não permite a digitalização de bordas em camadas de malha. Apenas vértices e faces são elementos de malha que podem ser criados. Também nem todos os formatos de malha suportados podem ser editados no QGIS (ver permissões).
18.4.1. Visão geral das ferramentas de digitalização de malhas
Para interagir com ou editar um elemento da camada base da malha, estão disponíveis as seguintes ferramentas.
Label |
Propósito |
Localização |
|---|---|---|
|
Acesso para salvar, reverter ou cancelar mudanças em todas as camadas ou em camadas selecionadas simultaneamente |
Digitizing toolbar |
|
Ativar/desativar a camada no modo de edição |
Digitizing toolbar |
|
Salvar as alterações feitas na camada |
Digitizing toolbar |
|
Desfazer a(s) última(s) mudança(s) - Ctrl+Z |
Digitizing toolbar |
|
Refazer a(s) última(s) ação(ões) desfeita(s) - Ctrl+Shift+Z |
Digitizing toolbar |
|
Ligar/desligar o Painel de Digitalização Avançada |
Advanced Digitizing toolbar |
|
Recrie o índice e renumere os elementos da malha para otimização |
Mesh menu |
|
Selecionar/criar vértices e faces |
Mesh Digitizing toolbar |
|
Selecionar vértices e faces sobrepostas por um polígono desenhado |
Mesh Digitizing toolbar |
|
Selecionar vértices e faces usando uma expressão |
Mesh Digitizing toolbar |
|
Modificar coordenadas de uma seleção de vértices |
Mesh Digitizing toolbar |
|
Dividir faces e restringir o valor Z usando uma geometria linear |
Mesh Digitizing toolbar |


18.4.2. Explorando a lógica de atribuição de valor Z
When a mesh layer is turned into edit mode, a Vertex Z value widget opens at the top right of the map canvas. By default, its value corresponds to the Default Z value set in tab. When there are selected vertices, the widget displays the average Z value of the selected vertices.
During editing, the Vertex Z value is assigned to new vertices.
It is also possible to set a custom value: edit the widget, press Enter
and you will override the default value and make use of this new value in
the digitizing process.
Click the  icon in the widget to reset its value to the Options
default value.
icon in the widget to reset its value to the Options
default value.
18.4.2.1. Regras de atribuição
Quando criado um novo vértice, sua definição do valor Z pode variar dependendo da seleção ativa na camada de malha e de sua localização. A tabela a seguir mostra as várias combinações.
Criação de vértice |
Existem vértices selecionados na camada de malha? |
Fonte do valor atribuído |
Valor Z atribuído |
|---|---|---|---|
Vértice “livre”, não conectado a nenhum face ou borda de uma face |
Não |
Valor Z do vértice |
Padrão ou definido pelo usuário |
Advanced
Digitizing Panel (if
z widget is in
|
z widget if in
|
||
Sim |
Valor Z do vértice |
Média dos vértices selecionados |
|
Vértice em uma borda |
— |
Camada de malha |
Interpolado a partir dos vértices da aresta |
Vértice em uma face |
— |
Camada de malha |
Interpolado a partir dos vértices da face |
Vértice encaixado em uma feição vetorial 2D |
— |
Valor Z do vértice |
Padrão ou definido pelo usuário |
Vértice encaixado em um vértice vetorial 3D |
— |
Camada vetorial |
Vértice |
Vértice encaixado em um segmento vetorial 3D |
— |
Camada vetorial |
Interpolado ao longo do segmento vetorial |

Nota
The Vertex Z value widget is deactivated if the Advanced Digitizing Panel is enabled and no mesh element is selected. The latter’s z widget then rules the Z value assignment.
18.4.2.2. Modificando o valor Z de vértices existentes
Para modificar o valor Z dos vértices, a maneira mais direta é:
Selecione um ou vários vértices. O elemento Vértice valor Z exibirá a altura média da seleção.
Alterar o valor do elemento.
Pressione Enter. O valor inserido é atribuído aos vértices e se torna o valor padrão dos próximos vértices.
Outra maneira de alterar o valor Z de um vértice é movê-lo e encaixá-lo em uma característica de camada vetorial com a capacidade do valor Z. Se mais de um vértice for selecionado, o valor Z não pode ser alterado desta forma.
The Transform mesh vertices dialog also provides means to modify the Z value of a selection of vertices (along with their X or Y coordinates).
18.4.3. Selecionando elementos de malha
18.4.3.1. Usando Digitalização de elementos de malha
Activate the  Digitize Mesh Elements tool.
Hover over an element and it gets highlighted, allowing you to select it.
Digitize Mesh Elements tool.
Hover over an element and it gets highlighted, allowing you to select it.
Clique em um vértice e ele será selecionado.
Clique no pequeno quadrado no centro de uma face ou borda, e ele é selecionado. Os vértices conectados também são selecionados. Por outro lado, selecionando todos os vértices de uma borda ou de uma face também seleciona esse elemento.
Arraste um retângulo para selecionar elementos sobrepostos (uma face selecionada vem com todos os seus vértices). Pressione Alt se você quiser selecionar apenas elementos completamente contidos.
Para adicionar elementos a uma seleção, pressione Shift enquanto os seleciona.
Para remover um elemento da seleção, pressione Ctrl e selecione-o novamente. Uma face desmarcada também desmarcará todos os seus vértices.
18.4.3.2. Usando Selecionar elementos de malha por polígono
Ativar a ferramenta  Selecione Elementos de Malha por Polígono e:
Desenhe um polígono (clique esquerdo para adicionar vértice, Backspace para desfazer o último vértice, Esc para abortar o polígono e clique direito para validá-lo) sobre as geometrias da malha. Quaisquer vértices e faces parcialmente sobrepostos serão selecionados. Pressione Alt enquanto desenha, se você quiser selecionar apenas elementos completamente contidos.
Clique com o botão direito do mouse sobre a geometria de uma camada vetorial, selecione-a na lista que aparece e quaisquer vértices e faces parcialmente sobrepostas da camada de malha serão selecionados. Utilize Alt enquanto desenha para selecionar apenas os elementos completamente contidos.
Para adicionar elementos a uma seleção, pressione Shift enquanto os seleciona.
Para remover um elemento da seleção, pressione Ctrl enquanto desenha sobre o polígono de seleção.
18.4.3.3. Usando Selecione Elementos de Malha por Expressão
Another tool for mesh elements selection is  Select Mesh Elements by Expression. When pressed, the tool opens the mesh
expression selector dialog from which you can:
Select Mesh Elements by Expression. When pressed, the tool opens the mesh
expression selector dialog from which you can:
Selecione o método de seleção:
Selecionar por vértices: aplica a expressão entrada aos vértices, e retorna os correspondentes e suas eventuais bordas/face associadas
guilabel:Selecionar por faces: aplica a expressão entrada às faces, e retorna as que correspondem e suas bordas/vértices associados
Write the expression of selection. Depending on the selected method, available functions in the Meshes group will be filtered accordingly.
Execute a consulta definindo como a seleção deve se comportar e pressione:
 Selecionar: substitui qualquer seleção existente na camada
 Adicionar à seleção atual
 Remover da seleção atual
18.4.4. Modificando elementos de malha
18.4.4.1. Adicionando vértices
Para adicionar vértices a uma camada de malha:
Pressione o
:sup: Botão Digitalizar elementos da malhaA Vertex Z value widget appears on the top right corner of the map canvas. Set this value to the Z coordinate you would like to assign to the subsequent vertices
Em seguida, clique duas vezes:
fora de uma face: adiciona um “vértice livre”, que é um vértice não vinculado a nenhuma face. Este vértice é representado por um ponto vermelho quando a camada está em modo de edição.
on the edge of existing face(s): adds a vertex on the edge, splits the touching face(s) into triangles connected to the new vertex.
dentro de uma face: divide a face em triângulos cujas arestas conectam os vértices circundantes ao novo vértice.
18.4.4.2. Adicionando faces
Para adicionar faces a uma camada de malha:
Pressione o
:sup: Botão Digitalizar elementos da malhaA Vertex Z value widget appears on the top right corner of the map canvas. Set this value to the Z coordinate you would like to assign to the subsequent vertices.
Hover over a vertex and click the small triangle that appears next it.
Move the cursor to the next vertex position; you can snap to existing vertex or left-click to add a new one.
Proceda como acima para adicionar quantos vértices você desejar para a face. Pressione Backspace botão para desfazer o último vértice.
While moving the mouse, a rubberband showing the shape of the face is displayed. If it is shown in green, then the expected face is valid and you can right-click to add it to the mesh. If it is red, the face is not valid (e.g. because it self-intersects, overlaps an existing face or vertex, creates a hole, …) and can’t be added. You’d need to undo some vertices and fix the geometry.
Pressione Esc para abortar a digitalização da face.
Clique com o botão direito do mouse para validar a face.
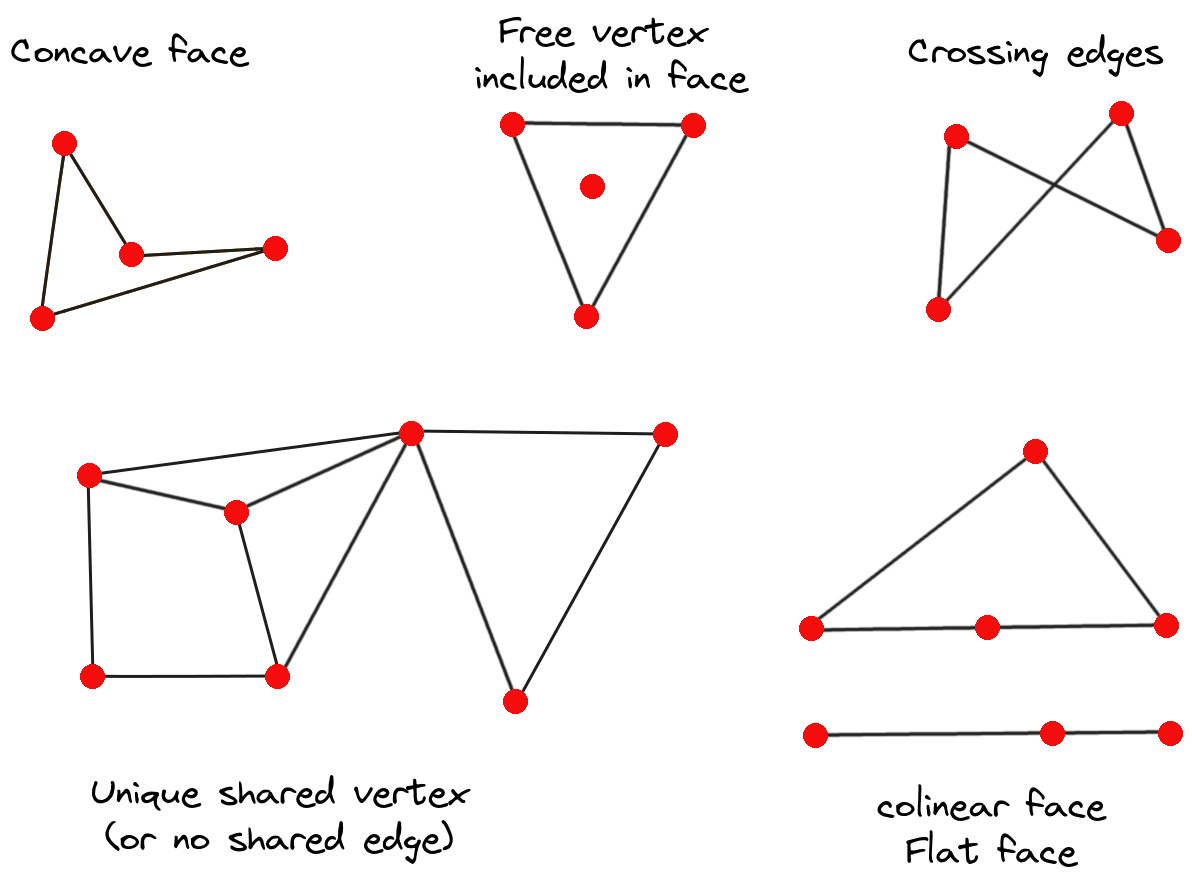
Fig. 18.14 Examples of invalid mesh
18.4.4.3. Removendo elementos de malha
ref:Selecionar os Elementos Alvo <select_mesh_elements>
Habilitar a
:sup: Ferramenta Digitalizar elementos da malhaClique com o botão direito do mouse e selecione:
Remover os vértices selecionados e preencher o(s) buraco(s) ou pressione :kbd:`Ctrl+Del: remove os vértices e as faces ligadas e preenche o(s) buraco(s) triangular(es) a partir dos vértices vizinhos
guilabel:Remover Vértices Selecionados Sem Furo(s) de Preenchimento(s) ou pressione :kbd:`Ctrl+Shift+Del: remove os vértices e as faces ligadas e não preenche o(s) furo(s)
guilabel:Remover a(s) face(s)selecionada(s) ou pressione Shift+Del: remove as faces mas mantém os vértices
Essas opções também estão acessíveis no menu contextual ao passar o mouse sobre um único item sem selecionar.
18.4.4.4. Movendo elementos de malha
Para mover vértices e faces de uma camada de malha:
ref:Selecionar os Elementos Alvo <select_mesh_elements>
Habilitar a
:sup: Ferramenta Digitalizar elementos da malhaPara começar a mover o elemento, clique em um vértice ou no centroide de uma face/aresta
Mova o cursor para o local de destino (é suportado a adesão para características vetoriais).
If the new location does not generate an invalid mesh, the moved elements appear in green. Click again to release them at this location. Faces whose vertices are all selected are translated, their neighbors are reshaped accordingly.
18.4.4.5. Transformando vértices de malha
A ferramenta  Transformar Coordenadas de Vértices oferece uma maneira mais avançada de mover vértices, editando suas coordenadas X, Y e/ou Z graças a expressões.
Selecione os vértices que deseja editar as coordenadas
Press
Transform Vertices Coordinates.
A dialog opens with a mention of the number of selected vertices.
You can still add or remove vertices from the selection.Dependendo das propriedades que você deseja modificar, você precisa verificar a coordenada X, :guilabel:` coordenada Y` e/ou valor Z.
Em seguida, digite a posição alvo na caixa, seja como um valor numérico ou uma expressão (utilizando a |expressão| diálogo de expressão)
Com o item
 Importar coordenadas do vértice selecionado pressionada, as caixas X, Y e Z são automaticamente preenchidas com suas coordenadas sempre que um único vértice é selecionado. Uma maneira conveniente e rápida de ajustar os vértices individualmente.
Pressione Pré-visualização da transformação para simular a nova localização dos vértices e pré-visualizar a malha com transformação.
Se a pré-visualização estiver verde, a malha transformada é válida e você pode aplicar a transformação.
Se a pré-visualização estiver vermelha, a malha transformada é inválida e você não poderá aplicar a transformação até que ela seja corrigida.
Pressione Aplicar Transformação para modificar as coordenadas selecionadas para o conjunto de vértices.
18.4.4.6. Remodelando a geometria da malha
O menu contextual
Habilitar o
Digitalizar elementos da malhaSelecione o(s) item(ns) de malha, ou não
Passe o mouse sobre um elemento de malha, ele fica destacado.
Clique com o botão direito do mouse e você pode:
ref:remove o(s) item(ns) <remove_mesh_items>
Dividir face(s) selecionada(s) (:guilabel:`Dividir Face Atual’): divide a face que você está pairando sobre ou cada face de malha quadrangular selecionada em dois triângulos
:guilabel:`Triangulação Delaunay com vértices selecionados’: constrói faces triangulares utilizando vértices livres selecionados.
guilabel:Refinar a(s) face(s) selecionada(s) (:guilabel:`Refinar a face atual’): divide a face em quatro faces, com base nos vértices adicionados no meio de cada borda (um triângulo resulta em triângulos, um quad em quads). Também triangula as faces adjacentes ligadas aos novos vértices.
Os marcadores de borda
Quando o Digitar elementos de malha está ativo e você paira sobre uma borda, a borda é destacada e é possível interagir com ela. Dependendo do contexto, os seguintes marcadores podem estar disponíveis:
um quadrado, no centro da aresta: clique nele para selecionar os vértices das extremidades.
uma cruz se as duas faces de cada lado puderem ser fundidas: clique sobre ela para apagar a borda e fundir as faces.
um círculo se a borda estiver entre dois triângulos: Clique sobre ele para inverter a borda, ou seja, conecte-o aos dois outros vértices “livres” das faces
A ferramenta :guilabel:`Força por Geometrias Selecionadas’
A ferramenta  Forcar por geometrias selecionadas fornece formas avançadas de aplicar linhas de quebra utilizando a geometria de linhas. Uma linha de quebra forçará a malha a ter bordas ao longo da linha. Note que a linha de quebra não será considerada persistente uma vez terminada a operação; as bordas resultantes não atuarão mais como restrições e podem ser modificadas como qualquer outra borda. Isto pode ser usado, por exemplo, para modificar localmente uma camada de malha com linhas precisas, como margens de rios ou margens de aterros de estradas.
Habilitar a ferramenta
:sup:`Força por Geometrias Selecionadas’Indicar a geometria a ser usada como “linha de força”; ela pode ser:
escolhida a partir de uma linha ou polígono na tela do mapa: clique com o botão direito sobre o vetor e selecione-o na lista do menu contextual.
a virtual line drawn over the mesh frame: left-click to add vertices, right-click for validation. Vertices Z value is set through the Vertex Z value widget or the z widget if the Advanced Digitizing Panel is on. If the line is snapped to a mesh vertex or a 3D vector feature’s vertex or segment, the new vertex takes the snapped element Z value.
Mesh faces that overlap the line geometry or the polygon’s boundary will be
affected in a way that depends on options you can set from
the Force by Selected
Geometries tool drop-down menu:
- :guilabel:`Adicionar um novo vértice nas bordas de interseção’: com esta opção, um novo vértice é adicionado cada vez que a linha forçadora intercepta uma borda. Esta opção leva à divisão ao longo da linha de cada face encontrada.
Sem esta opção, as faces encontradas são removidas e substituídas por faces provenientes de uma triangulação com apenas os vértices existentes mais os vértices das linhas de forçagem (novos vértices também são adicionados na borda da fronteira que intercepta as linhas de forçagem).
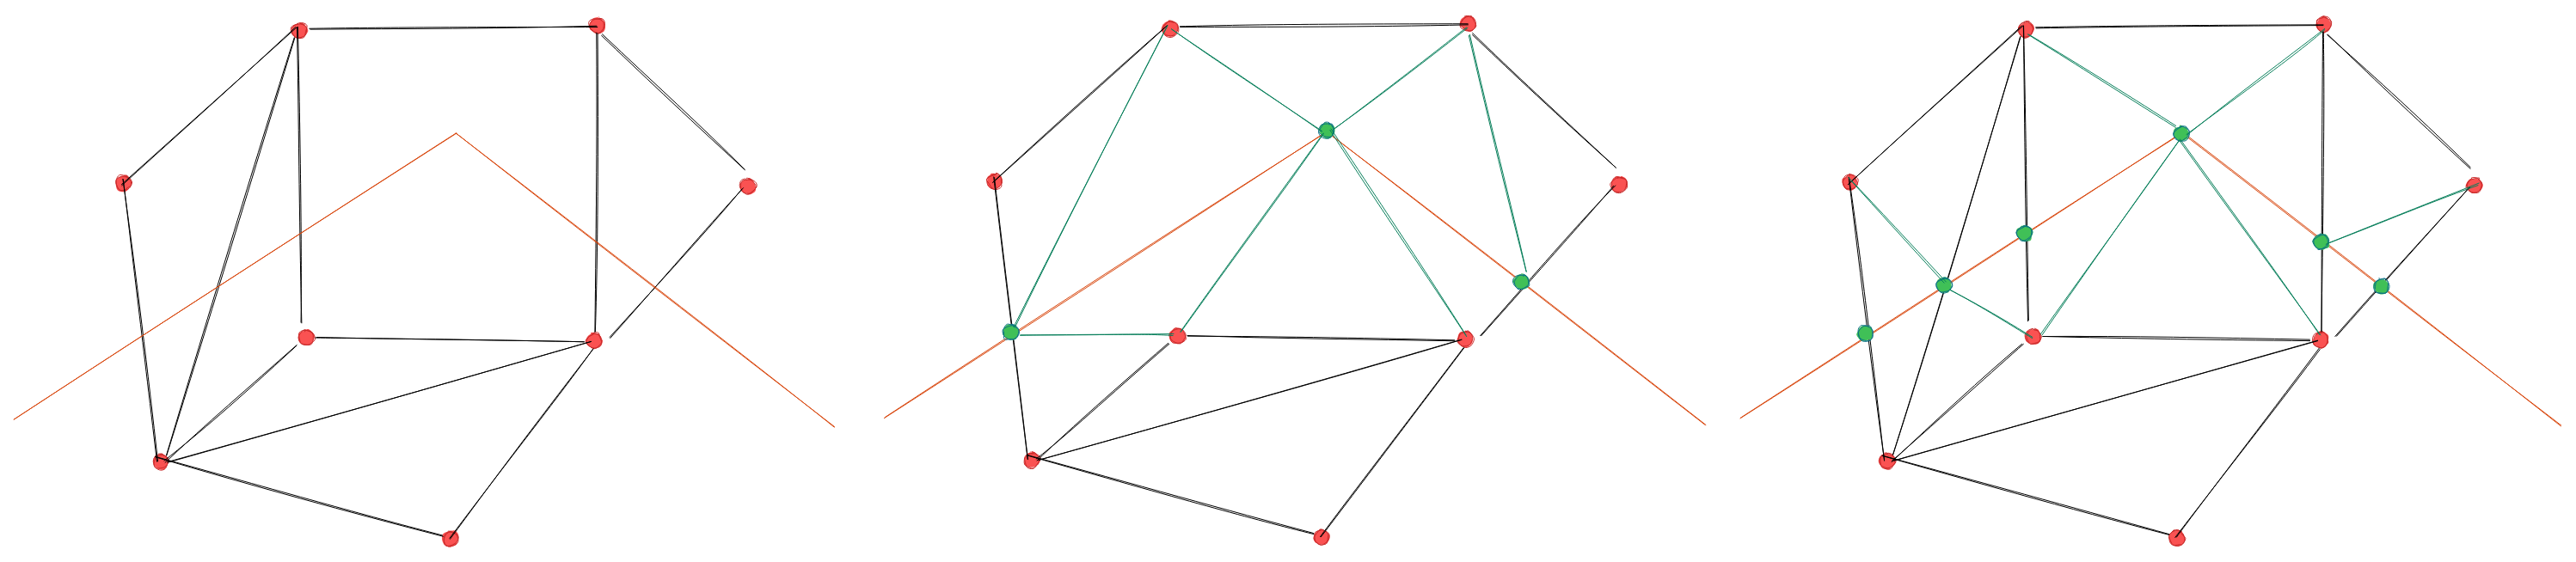
Fig. 18.15 Forçar a malha usando uma geometria de linha - Resultados sem (meio) e com (direita) novo vértice na interseção das bordas
guilabel:`Interpolar o valor Z de’: definir como é calculado o novo valor Z dos vértices. Pode ser de:
the Mesh itself: the new vertices Z value is interpolated from vertices of the face they fall within
ou a Linha forçada: se a linha é definida por uma característica vetorial 3D ou uma linha desenhada, então o novo valor dos vértices Z é derivado de sua geometria. No caso da característica de linha 2D, o novo valor Z dos vértices é o valor Valor do vértice Z.
Tolerância: quando um vértice de malha existente estiver mais próximo da linha do que o valor de tolerância, não crie um novo vértice na linha, mas utilize o vértice existente em seu lugar. O valor pode ser definido em Medidores em Escala ou em Unidades do mapa (mais detalhes em Seletor de Unidade).
18.4.5. Reindexação de malhas
During edit, and in order to allow quick undo/redo operations, QGIS keeps empty
places for deleted elements, which may lead to growing memory use and
inefficient mesh structuring.
The  tool is designed to remove these holes and renumber the indices of
faces and vertices so that they are continuous and somewhat reasonably ordered.
This optimizes relation between faces and vertices and increases the efficiency
of calculation.
tool is designed to remove these holes and renumber the indices of
faces and vertices so that they are continuous and somewhat reasonably ordered.
This optimizes relation between faces and vertices and increases the efficiency
of calculation.
Nota
A ferramenta :guilabel:`Reindexar Faces e Vértices’ salva a camada e limpa as pilhas de desfazer/redo, desabilitando qualquer rollback.
18.5. Calculadora de Malha
The Mesh Calculator tool from the top menu allows you to perform arithmetic and logical calculations on existing dataset groups to generate a new dataset group (see Fig. 18.16).
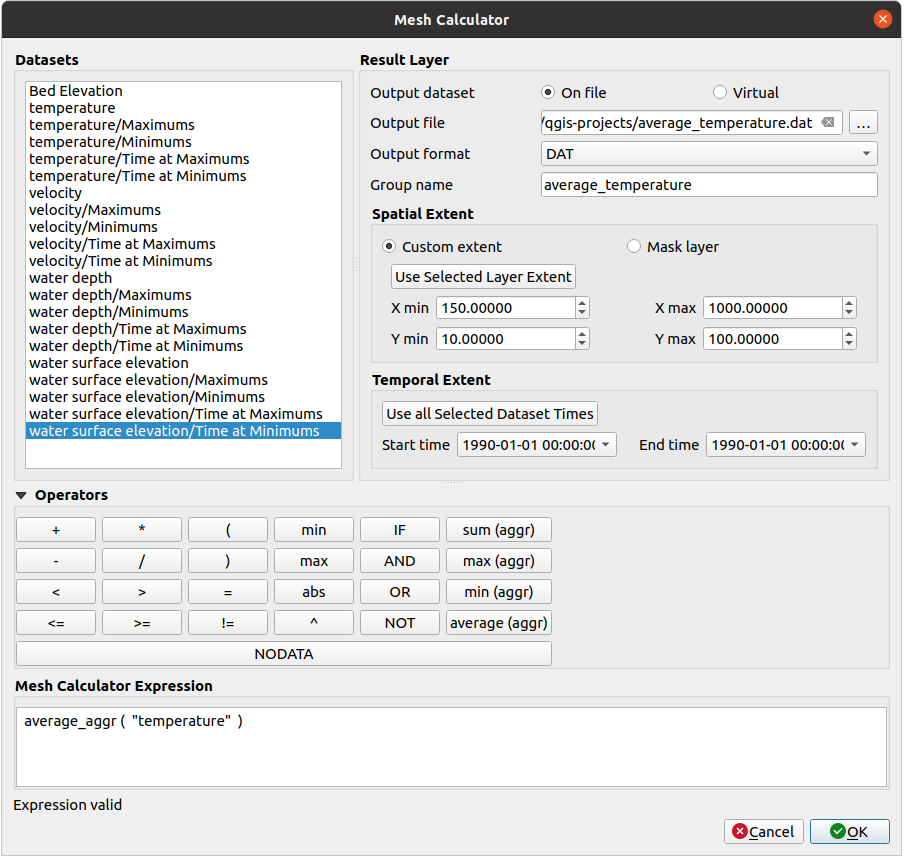
Fig. 18.16 Calculadora de Malha
The Datasets list contains all dataset groups in the active mesh layer. To use a dataset group in an expression, double click its name in the list and it will be added to the Mesh calculator expression field. You can then use the operators to construct calculation expressions, or you can just type them into the box.
The Result Layer helps you configure properties of the output layer:
- Create on-the-fly dataset group instead of writing layer
to disk:
If unchecked, the output is stored on disk as a new plain file. An Output File path and an Output Format are required.
If checked, a new dataset group will be added to the mesh layer. Values of the dataset group are not stored in memory but each dataset is calculated when needed with the formula entered in the mesh calculator. That virtual dataset group is saved with the project, and if needed, it can be removed or made persistent in file from the layer Source properties tab.
In either case, you should provide a Group Name for the output dataset group.
The Spatial extent to consider for calculation can be:
a Custom extent, manually filled with the X min, X max, Y min and Y max coordinate, or extracted from an existing dataset group (select it in the list and press Use selected layer extent to fill the abovementioned coordinate fields)
defined by a polygon layer (Mask layer) of the project: the polygon features geometry are used to clip the mesh layer datasets
The Temporal extent to take into account for datasets can be set with the Start time and End time options, selected from the existing dataset groups timesteps. They can also be filled using the Use all selected dataset times button to take the whole range.
The Operators section contains all available operators. To add an operator
to the mesh calculator expression box, click the appropriate button. Mathematical
calculations (+, -, *, … ) and statistical functions (min,
max, sum (aggr), average (aggr), … ) are available.
Conditional expressions (=, !=, <, >=, IF, AND, NOT, … )
return either 0 for false and 1 for true, and therefore can be used with other operators
and functions. The NODATA value can also be used in the expressions.
The Mesh Calculator Expression widget shows and lets you edit the expression to execute.