25.1.13. 基于栅格的地形分析
25.1.13.1. 坡向
在数字地形模型中计算坡向,最终的坡向栅格图层包含了从0到360的数值去代表斜坡的倾向。坡向以正北为0°,顺时针方向递增

图 25.21 坡向数值
下图展示了用色带重分类的坡向图层
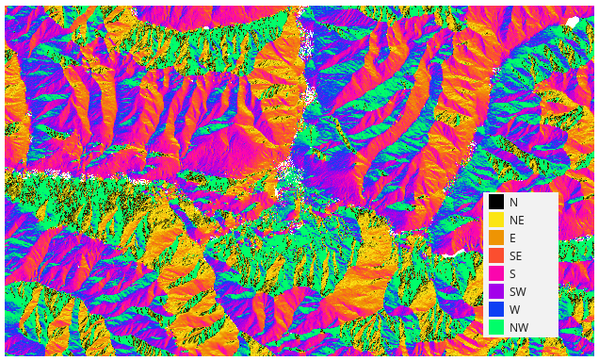
图 25.22 重分类后的坡向图层
参数
标注 |
名称 |
类型 |
描述 |
|---|---|---|---|
高程图层 |
输入 |
[栅格] |
数字地形模型的栅格图层 |
Z 因子 |
Z 因子 |
[数字] 默认值:1.0 |
纵向拉伸。当z单位与x,y单位不同时,例如米与英尺,该参数十分有用。你可以通过这个参数去进行调整。该参数默认值为1(没有拉伸)。 |
坡向 |
|
[栅格] |
请指定输出的坡向栅格图层。其中一个为:
文件编码也可以在此更改。 |
输出
标注 |
名称 |
类型 |
描述 |
|---|---|---|---|
坡向 |
|
[栅格] |
输出的坡向栅格图层 |
Python代码
算法 ID: qgis:坡向
import processing
processing.run("algorithm_id", {parameter_dictionary})
当你在数据处理工具箱某个算法前悬停时,算法 id 将会展现。*参数字*将会提供参数的名称与数值。参考详见`数据处理_控制台`以获取如何从Python控制台中运行数据处理算法。
25.1.13.2. 山体阴影
基于输入的数字地形模型计算山体阴影的栅格图层
图层的晕渲是根据太阳位置进行计算的:你可以选择更改太阳投射的水平角度(方位角)和垂直角度(太阳高度)。
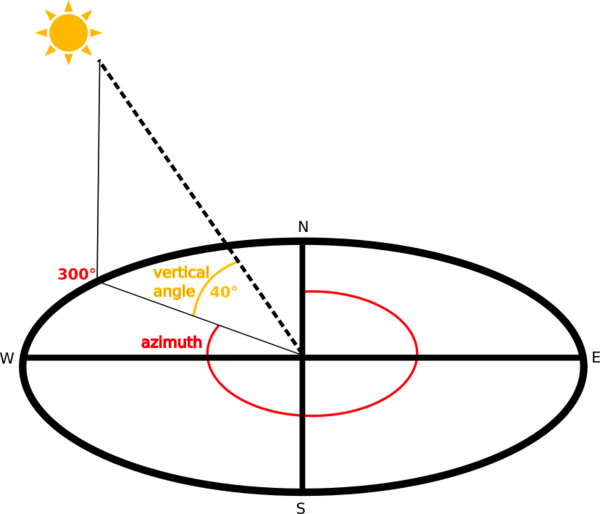
图 25.23 方位角与垂向角度
山体阴影图层的数值范围覆盖从0(完全遮蔽)到255(完全暴露)。山体阴影通常用于更好地理解区域中的地势。
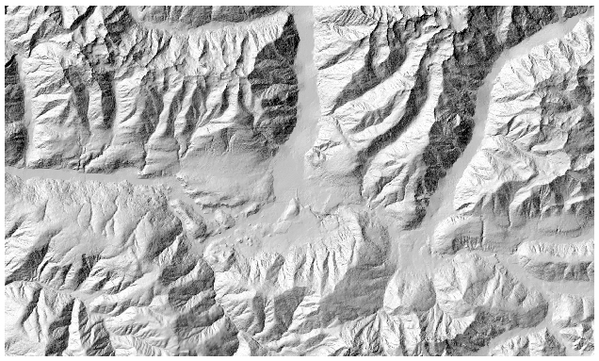
图 25.24 山体阴影图层一般设定为300°的方位角以及45°的垂向角度。
值得注意的是可以将山体阴影图层设定某个透明度值后重叠在高程栅格之上。
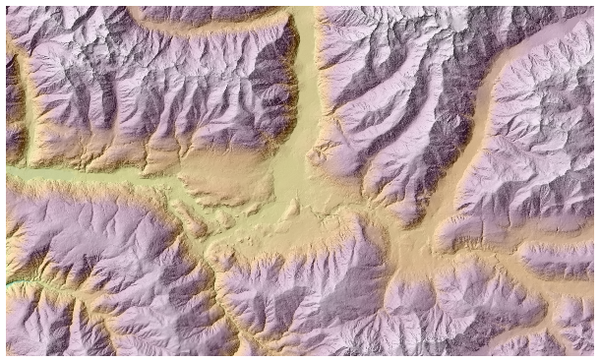
图 25.25 重叠是山体阴影叠上高程图层
参数
标注 |
名称 |
类型 |
描述 |
|---|---|---|---|
高程图层 |
输入 |
[栅格] |
数字地形模型的栅格图层 |
Z 因子 |
Z 因子 |
[数字] 默认值:1.0 |
纵向拉伸。当z单位与x,y单位不同时,例如米与英尺,该参数十分有用。你可以通过这个参数去进行调整。随着该参数数值的增加,最终的结果会更加夸张(更加“山体化”)。该参数默认值为1(没有拉伸) |
方位角(水平角度) |
|
[数字] 默认值:300.0 |
Set the horizontal angle (in degrees) of the sun (clockwise direction). Range: 0 to 360. 0 is north. |
Vertical angle |
|
[数字] Default: 40.0 |
Set the vertical angle (in degrees) of the sun, that is the height of the sun. Values can go from 0 (minimum elevation) to 90 (maximum elevation). |
Hillshade |
|
[栅格] |
Specify the output hillshade raster layer. One of:
文件编码也可以在此更改。 |
输出
标注 |
名称 |
类型 |
描述 |
|---|---|---|---|
Hillshade |
|
[栅格] |
The output hillshade raster layer |
Python代码
Algorithm ID: qgis:hillshade
import processing
processing.run("algorithm_id", {parameter_dictionary})
当你在数据处理工具箱某个算法前悬停时,算法 id 将会展现。*参数字*将会提供参数的名称与数值。参考详见`数据处理_控制台`以获取如何从Python控制台中运行数据处理算法。
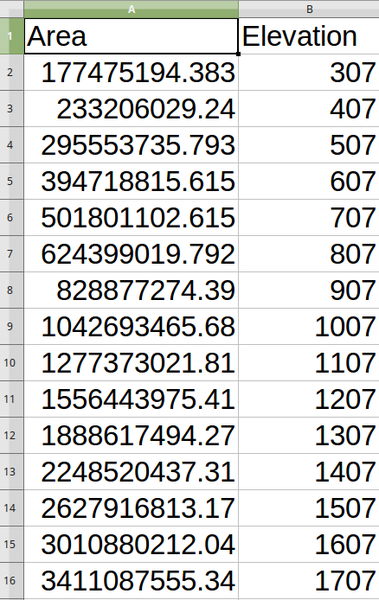
25.1.13.3. Hypsometric curves
Calculates hypsometric curves for an input Digital Elevation Model. Curves are produced as CSV files in an output folder specified by the user.
A hypsometric curve is a cumulative histogram of elevation values in a geographical area.
You can use hypsometric curves to detect differences in the landscape due to the geomorphology of the territory.
参数
标注 |
名称 |
类型 |
描述 |
|---|---|---|---|
DEM to analyze |
|
[栅格] |
Digital Terrain Model raster layer to use for calculating altitudes |
Boundary layer |
|
[vector: polygon] |
Polygon vector layer with boundaries of areas used to calculate hypsometric curves |
Step |
|
[数字] Default: 100.0 |
Vertical distance between curves |
Use % of area instead of absolute value |
|
[boolean] Default: False |
Write area percentage to “Area” field of the CSV file instead of the absolute area |
Hypsometric curves |
|
[folder] |
Specify the output folder for the hypsometric curves. One of:
文件编码也可以在此更改。 |
输出
标注 |
名称 |
类型 |
描述 |
|---|---|---|---|
Hypsometric curves |
|
[folder] |
Directory containing the files with the hypsometric curves. For each feature from the input vector layer, a CSV file with area and altitude values will be created. The file names start with |
Python代码
Algorithm ID: qgis:hypsometriccurves
import processing
processing.run("algorithm_id", {parameter_dictionary})
当你在数据处理工具箱某个算法前悬停时,算法 id 将会展现。*参数字*将会提供参数的名称与数值。参考详见`数据处理_控制台`以获取如何从Python控制台中运行数据处理算法。
25.1.13.4. Relief
Creates a shaded relief layer from digital elevation data. You can specify the relief color manually, or you can let the algorithm choose automatically all the relief classes.
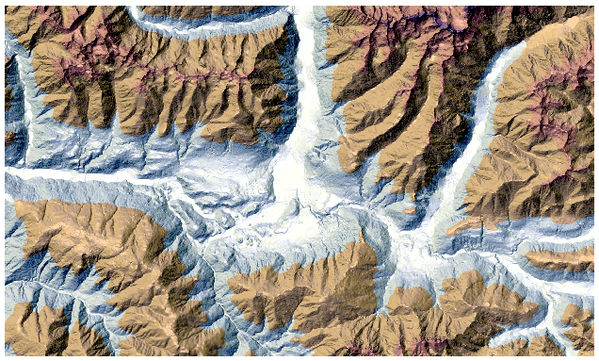
图 25.26 Relief layer
参数
标注 |
名称 |
类型 |
描述 |
|---|---|---|---|
高程图层 |
输入 |
[栅格] |
数字地形模型的栅格图层 |
Z 因子 |
Z 因子 |
[数字] 默认值:1.0 |
纵向拉伸。当z单位与x,y单位不同时,例如米与英尺,该参数十分有用。你可以通过这个参数去进行调整。随着该参数数值的增加,最终的结果会更加夸张(更加“山体化”)。该参数默认值为1(没有拉伸) |
Generate relief classes automatically |
|
[boolean] Default: False |
If you check this option the algorithm will create all the relief color classes automatically |
Relief colors Optional |
|
[table widget] |
Use the table widget if you want to choose the relief colors manually. You can add as many color classes as you want: for each class you can choose the lower and upper bound and finally by clicking on the color row you can choose the color thanks to the color widget. 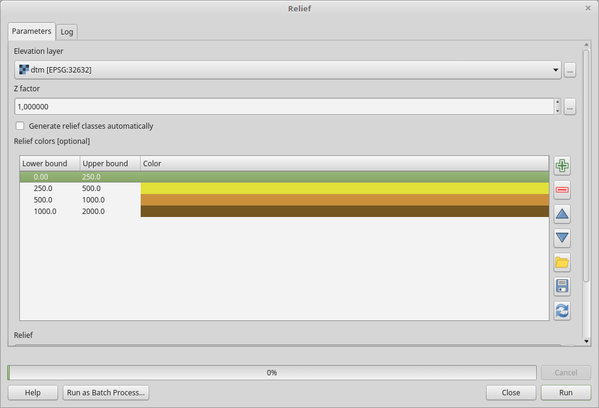
图 25.27 Manually setting of relief color classes The buttons in the right side panel give you the chance to: add or remove color classes, change the order of the color classes already defined, open an existing file with color classes and save the current classes as file. |
Relief |
|
[栅格] Default: |
Specify the output relief raster layer. One of:
文件编码也可以在此更改。 |
Frequency distribution |
|
[table] Default: |
Specify the CSV table for the output frequency distribution. One of:
文件编码也可以在此更改。 |
输出
标注 |
名称 |
类型 |
描述 |
|---|---|---|---|
Relief |
|
[栅格] |
The output relief raster layer |
Frequency distribution |
|
[table] |
The output frequency distribution |
Python代码
Algorithm ID: qgis:relief
import processing
processing.run("algorithm_id", {parameter_dictionary})
当你在数据处理工具箱某个算法前悬停时,算法 id 将会展现。*参数字*将会提供参数的名称与数值。参考详见`数据处理_控制台`以获取如何从Python控制台中运行数据处理算法。
25.1.13.5. Ruggedness index
Calculates the quantitative measurement of terrain heterogeneity described by Riley et al. (1999). It is calculated for every location, by summarizing the change in elevation within the 3x3 pixel grid.
Each pixel contains the difference in elevation from a center cell and the 8 cells surrounding it.
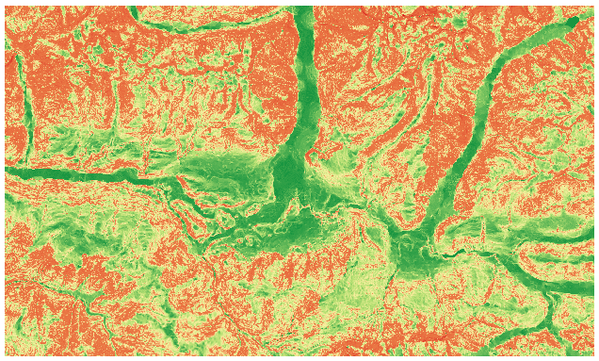
图 25.28 Ruggedness layer from low (red) to high values (green)
参数
标注 |
名称 |
类型 |
描述 |
|---|---|---|---|
高程图层 |
输入 |
[栅格] |
数字地形模型的栅格图层 |
Z 因子 |
Z 因子 |
[数字] 默认值:1.0 |
Vertical exaggeration. This parameter is useful when the Z units differ from the X and Y units, for example feet and meters. You can use this parameter to adjust for this. Increasing the value of this parameter will exaggerate the final result (making it look more rugged). The default is 1 (no exaggeration). |
Ruggedness |
|
[栅格] Default: |
Specify the output ruggedness raster layer. One of:
文件编码也可以在此更改。 |
输出
标注 |
名称 |
类型 |
描述 |
|---|---|---|---|
Ruggedness |
|
[栅格] |
The output ruggedness raster layer |
Python代码
Algorithm ID: qgis:ruggednessindex
import processing
processing.run("algorithm_id", {parameter_dictionary})
当你在数据处理工具箱某个算法前悬停时,算法 id 将会展现。*参数字*将会提供参数的名称与数值。参考详见`数据处理_控制台`以获取如何从Python控制台中运行数据处理算法。
25.1.13.6. Slope
Calculates the slope from an input raster layer. The slope is the angle of inclination of the terrain and is expressed in degrees.
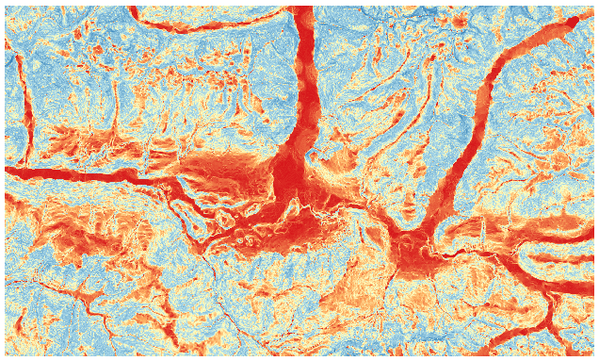
图 25.29 Flat areas in red, steep areas in blue
参数
标注 |
名称 |
类型 |
描述 |
|---|---|---|---|
高程图层 |
输入 |
[栅格] |
数字地形模型的栅格图层 |
Z 因子 |
Z 因子 |
[数字] 默认值:1.0 |
Vertical exaggeration. This parameter is useful when the Z units differ from the X and Y units, for example feet and meters. You can use this parameter to adjust for this. Increasing the value of this parameter will exaggerate the final result (making it steeper). The default is 1 (no exaggeration). |
Slope |
|
[栅格] Default: |
Specify the output slope raster layer. One of:
文件编码也可以在此更改。 |
输出
标注 |
名称 |
类型 |
描述 |
|---|---|---|---|
Slope |
|
[栅格] |
The output slope raster layer |
Python代码
Algorithm ID: qgis:slope
import processing
processing.run("algorithm_id", {parameter_dictionary})
当你在数据处理工具箱某个算法前悬停时,算法 id 将会展现。*参数字*将会提供参数的名称与数值。参考详见`数据处理_控制台`以获取如何从Python控制台中运行数据处理算法。