17.18. Modelos más complejos
Nota
En esta lección vamos a trabajar con un modelo más complejo en el modelador gráfico.
The first model that we created in the previous chapter was a very simple one, with just one input and three algorithms. More complex models can be created, with different types of inputs and containing more steps. For this chapter we will work with a model that creates a vector layer with watersheds, based on a DEM and a threshold value. That will be very useful for calculating several vector layers corresponding to different thresholds, without having to repeat each single step each time.
This lesson does not contain instructions about how to create your model. You already know the necessary steps (we saw them in a previous lesson) and you have already seen the basic ideas about the modeler, so you should try it yourself. Spend a few minutes trying to create your model, and don’t worry about making mistakes. Remember: first add the inputs and then add the algorithms that use them to create the workflow.
Nota
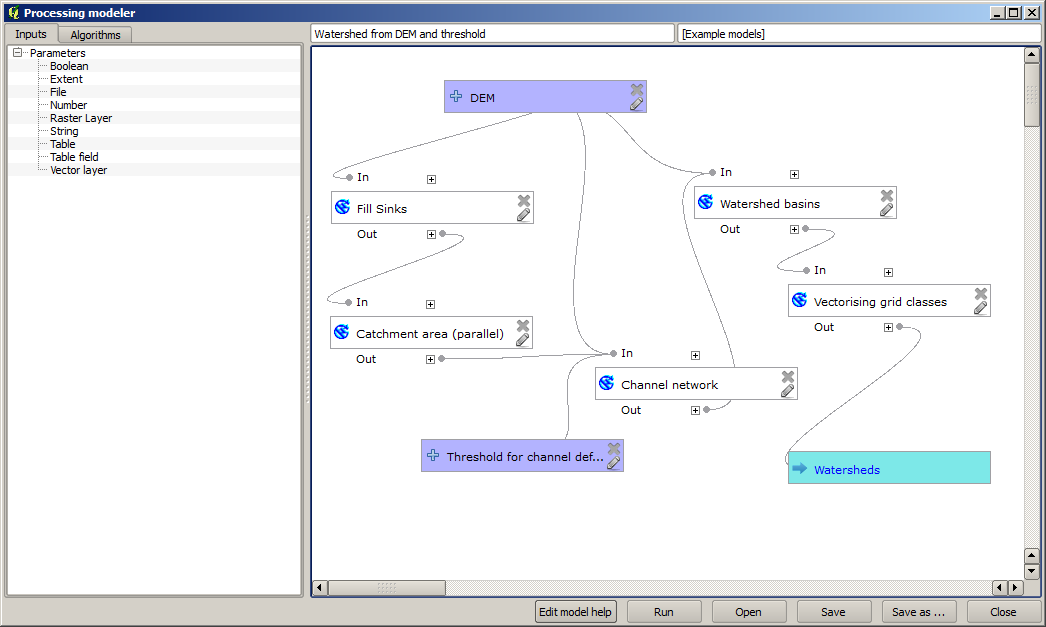
En caso de que no pudiera crear el modelo completo usted mismo y necesitará un poco de ayuda extra, la carpeta de datos correspondiente a esta lección contiene una versión ‘casi’ terminada de la misma. Abra el modelador y a continuación abra el archivo del modelo que encontrará en la carpeta de datos. Debería ver algo como esto.
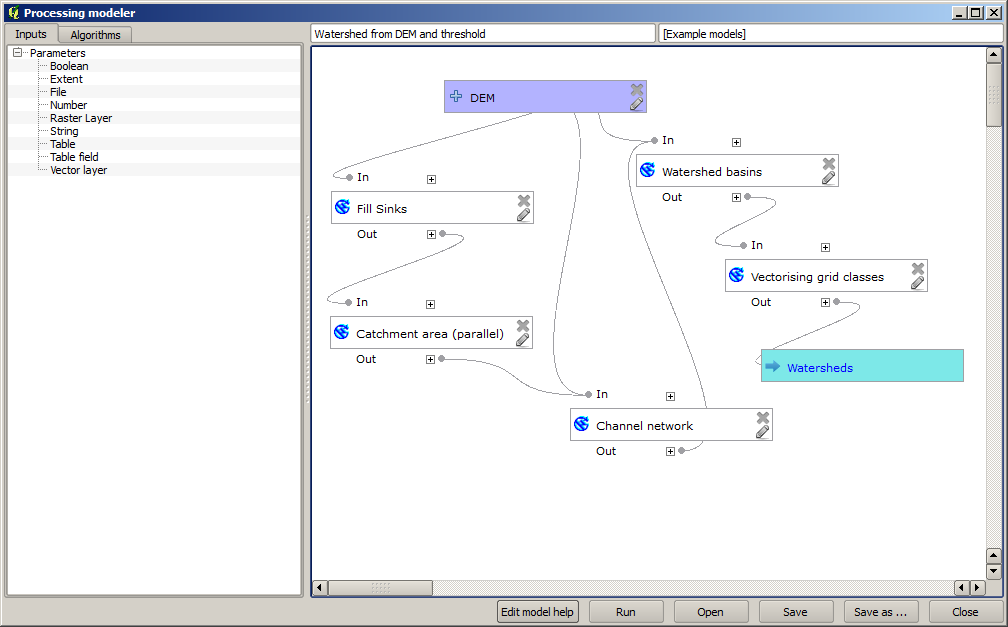
This model contains all the steps needed to complete the calculation, but it just has one input: the DEM. That means that the threshold for channel definition uses a fixed value, which makes the model not as useful as it could be. That is not a problem, since we can edit the model, and that is exactly what we will do.
First, let’s add a numerical input. That will ask the user for a numerical input that we can use when such a value is needed in any of the algorithms included in our model.
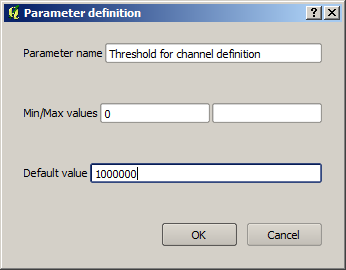
Click on the Number entry in the Inputs tree, and you will see the corresponding dialog.
Fill it with the following values.
Parameter name:
Threshold for channel definitionDefault value:
1,000,000
Ahora su modelo debería tener este aspecto.
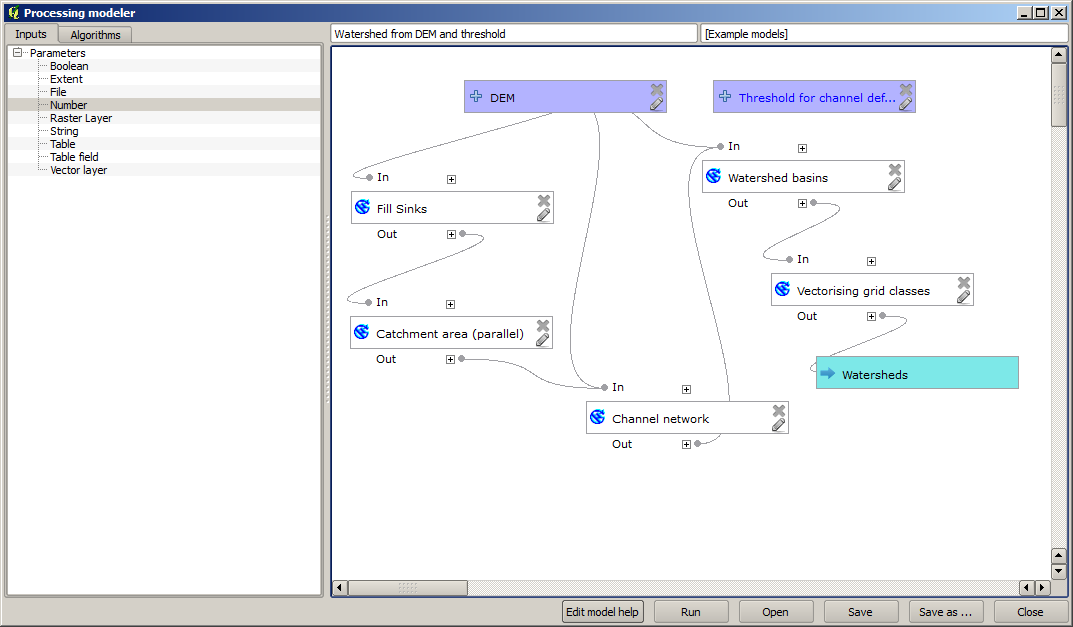
The input that we have just added is not used, so the model hasn’t actually changed. We have to link that input to the algorithm that uses it, in this case the Channel network one. To edit an algorithm that already exists in the modeler, just click on the pen icon on the corresponding box in the canvas.
Click on the Channel network algorithm and you will see something like this.
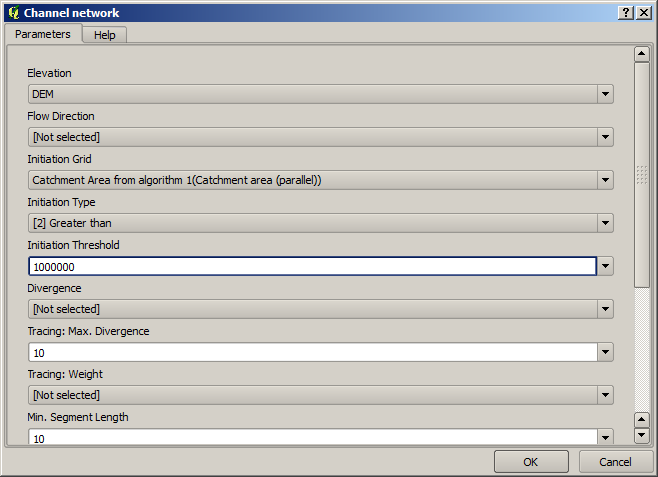
The dialog is filled with the current values used by the algorithm. You can see that the Initiation threshold parameter has a fixed value of 1,000,000 (this is also the default value of the algorithm, but any other value could be put in there). However, you might notice that the parameter is not entered in a common text box, but in a drop-down menu.
Unfold the threshold parameter menu and you will see something like this.
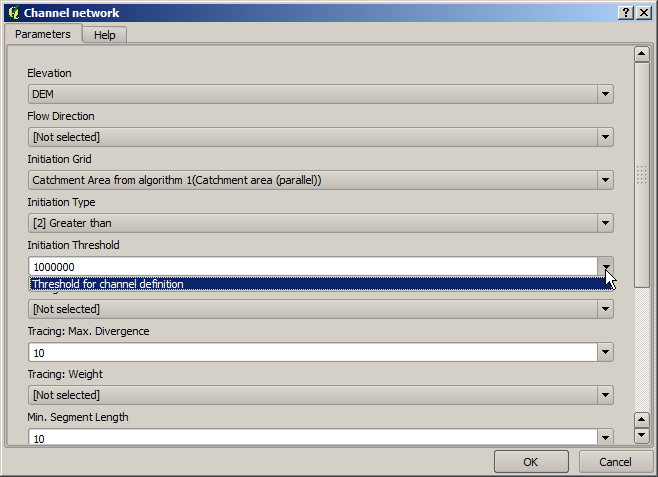
La entrada que hemos añadido esta allí y podemos seleccionarlo. Cada vez que un algoritmo en un modelo requiere un valor numérico, que puede codificar y directamente escribirla, o puede usar cualquiera de las entradas disponibles y los valores (recuerde que algunos algoritmos generan valores numéricos sencillos.Veremos más sobre esto pronto). En el caso de un parámetro de texto, también se verá entradas de texto y se podrá seleccionar una de ellos o escribir el valor fijo deseado.
Select the
Threshold for channel definitioninput in the Initiation threshold parameter.Click on OK to apply the changes to your model. Now the design of the model should look like this.
The model is now complete. Run it using the DEM that we have used in previous lessons, and with different threshold values.
Below you have a sample of the result obtained for different values. You can compare with the result for the default value, which is the one we obtained in the hydrological analysis lesson.
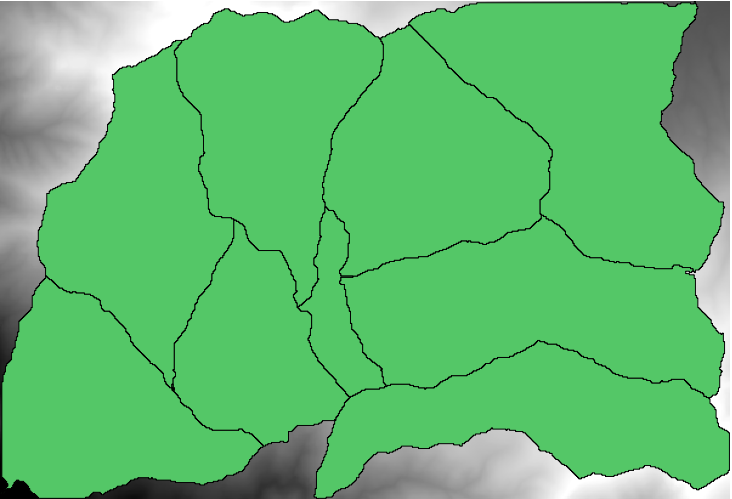
Fig. 17.2 Umbral = 100,000
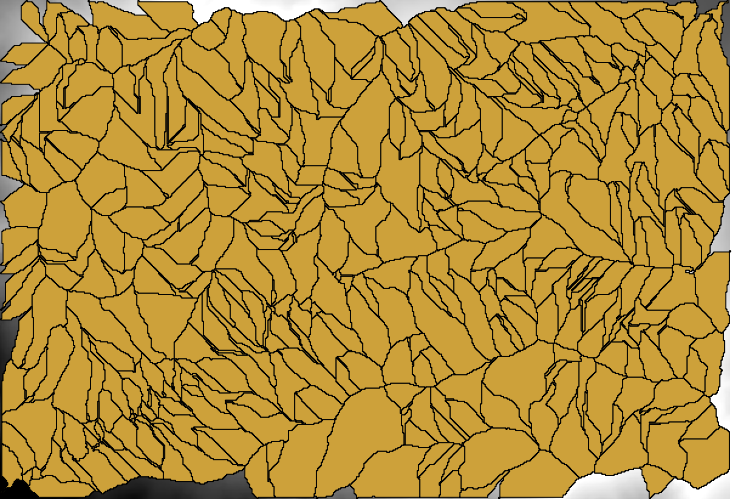
Fig. 17.3 Umbral = 1,0000,000