17.18. 더 복잡한 모델
참고
이 강의에서는, 그래프 모델 작성자에서 좀 더 복잡한 모델로 작업할 것입니다.
The first model that we created in the previous chapter was a very simple one, with just one input and three algorithms. More complex models can be created, with different types of inputs and containing more steps. For this chapter we will work with a model that creates a vector layer with watersheds, based on a DEM and a threshold value. That will be very useful for calculating several vector layers corresponding to different thresholds, without having to repeat each single step each time.
This lesson does not contain instructions about how to create your model. You already know the necessary steps (we saw them in a previous lesson) and you have already seen the basic ideas about the modeler, so you should try it yourself. Spend a few minutes trying to create your model, and don’t worry about making mistakes. Remember: first add the inputs and then add the algorithms that use them to create the workflow.
참고
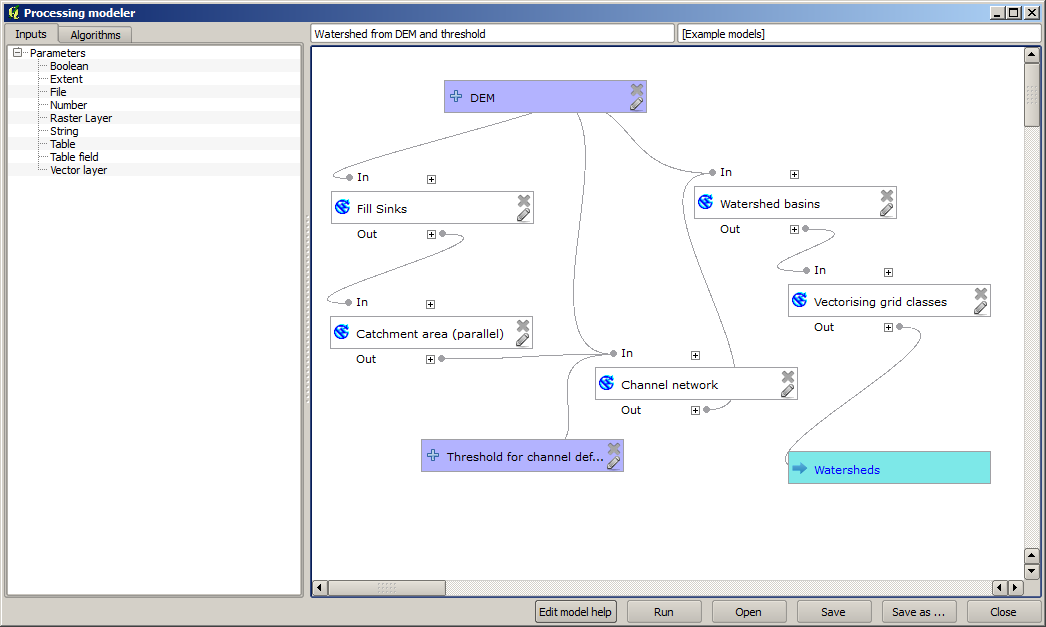
여러분이 전체 모델을 생성할 수 없어 도움이 필요할 경우, 이 강의에 해당하는 데이터 폴더는 ‘거의’ 완성된 버전의 모델을 담고 있습니다. 모델 작성자를 실행해서 해당 데이터 폴더에 있는 모델 파일을 열어보십시오. 다음과 같은 모델을 보게 될 것입니다.
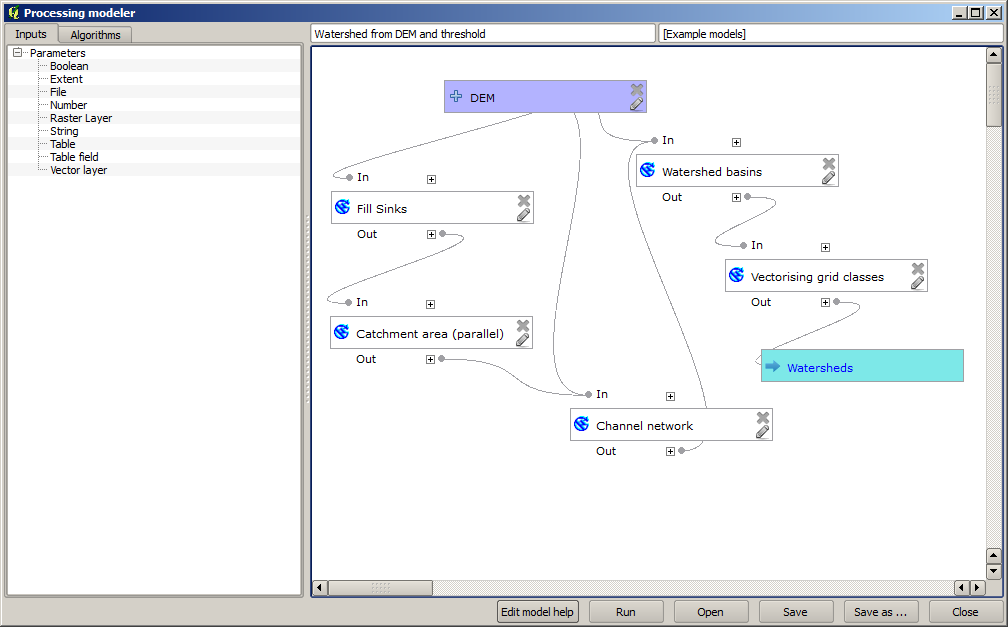
This model contains all the steps needed to complete the calculation, but it just has one input: the DEM. That means that the threshold for channel definition uses a fixed value, which makes the model not as useful as it could be. That is not a problem, since we can edit the model, and that is exactly what we will do.
First, let’s add a numerical input. That will ask the user for a numerical input that we can use when such a value is needed in any of the algorithms included in our model.
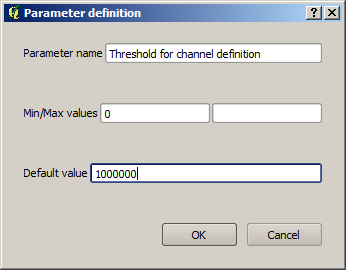
Click on the Number entry in the Inputs tree, and you will see the corresponding dialog.
Fill it with the following values.
Parameter name:
Threshold for channel definitionDefault value:
1,000,000
이제 모델이 다음과 같이 보일 것입니다.
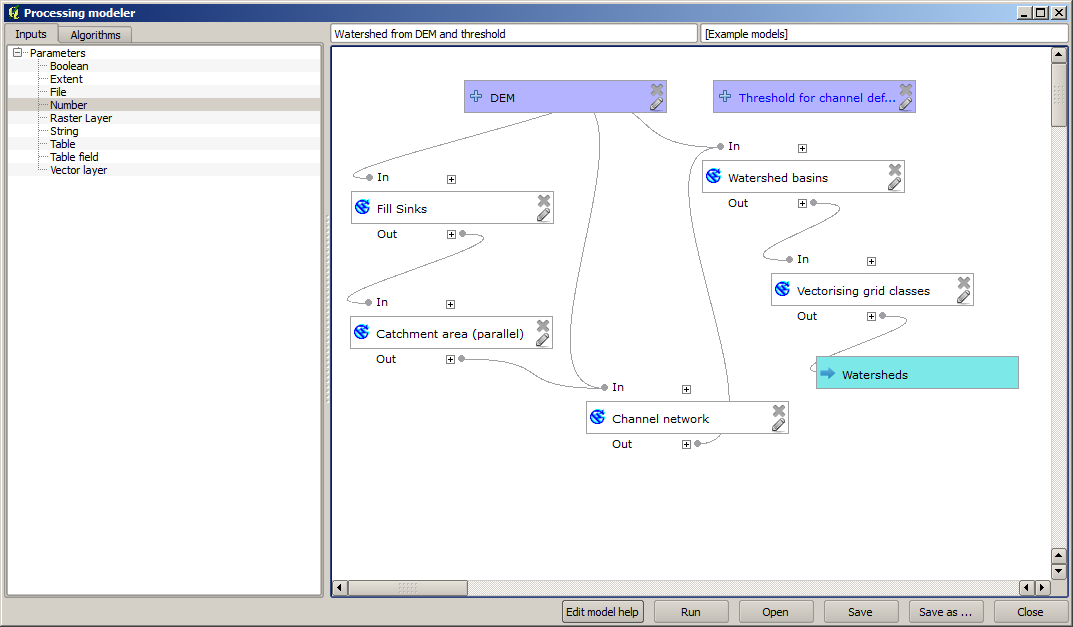
The input that we have just added is not used, so the model hasn’t actually changed. We have to link that input to the algorithm that uses it, in this case the Channel network one. To edit an algorithm that already exists in the modeler, just click on the pen icon on the corresponding box in the canvas.
Click on the Channel network algorithm and you will see something like this.
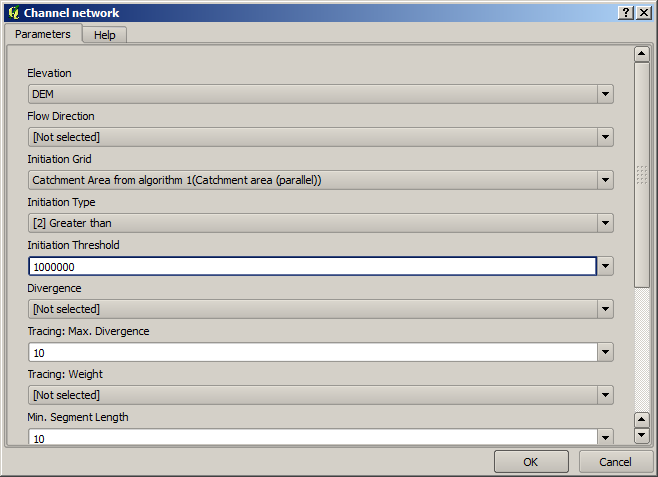
The dialog is filled with the current values used by the algorithm. You can see that the Initiation threshold parameter has a fixed value of 1,000,000 (this is also the default value of the algorithm, but any other value could be put in there). However, you might notice that the parameter is not entered in a common text box, but in a drop-down menu.
Unfold the threshold parameter menu and you will see something like this.
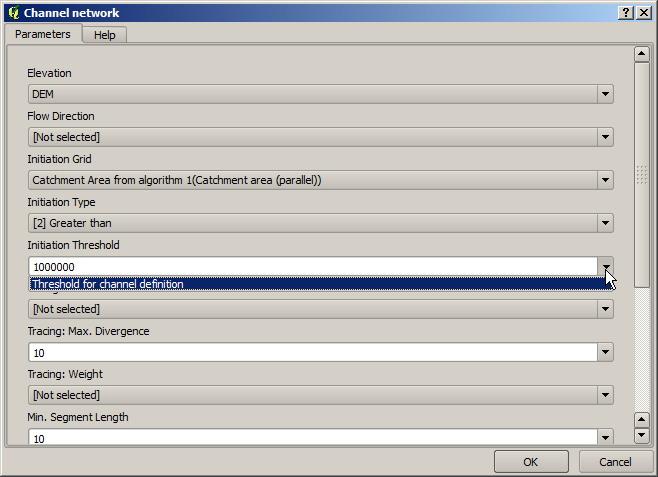
방금 추가했던 입력이 목록에 있어서 이를 선택할 수 있습니다. 모델 내부의 알고리듬이 숫자 값을 필요로 할 때마다, 데이터를 쉽게 변경할 수 없도록 직접 입력할 수도 있고, 또는 사용 가능한 어떤 입력이나 값들을 사용할 수도 있습니다. (일부 알고리듬은 단일 숫자 값을 생성한다는 사실을 기억하십시오. 이에 대해서는 곧 배우게 될 것입니다.) 문자열 파라미터의 경우에도, 사용자가 선택할 수 있는 문자열 입력을 추가하거나, 또는 원하는 고정 값을 입력할 수도 있습니다.
Select the
Threshold for channel definitioninput in the Initiation threshold parameter.Click on OK to apply the changes to your model. Now the design of the model should look like this.
The model is now complete. Run it using the DEM that we have used in previous lessons, and with different threshold values.
Below you have a sample of the result obtained for different values. You can compare with the result for the default value, which is the one we obtained in the hydrological analysis lesson.
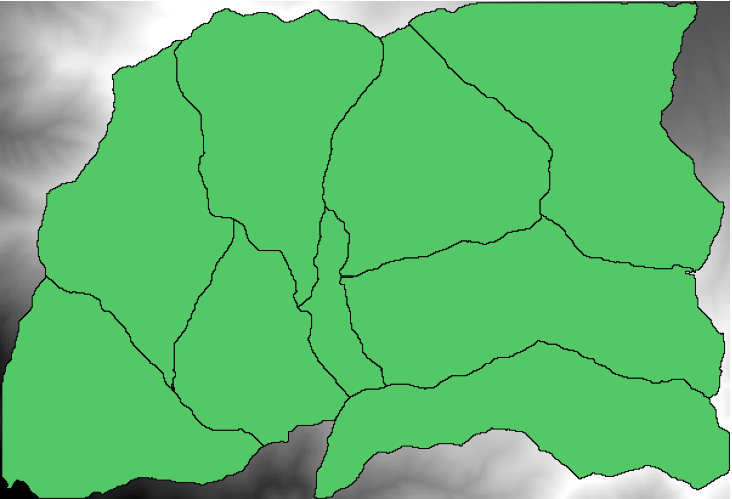
그림 17.2 임계값 = 100,000
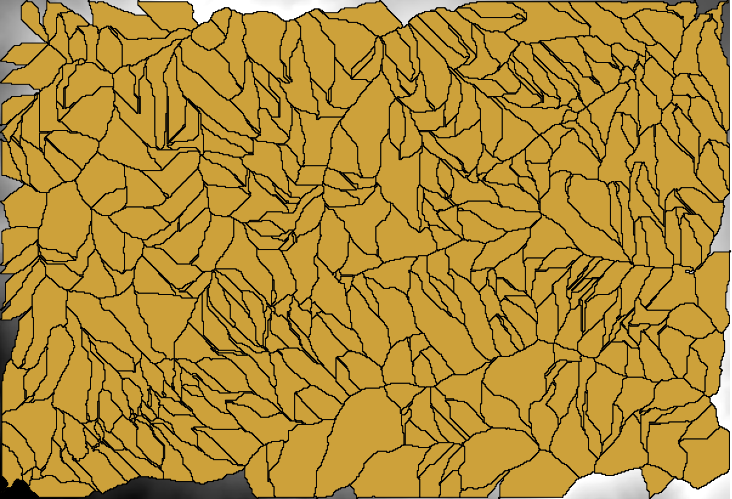
그림 17.3 임계값 = 10,000,000