` `
Gegevens openen
- Het paneel Browser
- De DB Manager
- Provider-gebaseerde gereedschappen voor laden
- QGIS aangepaste indelingen
- Verbinden met webservices
Als deel van een Open Source Software ecosysteem is QGIS gebouwd met verschillende bibliotheken die, gecombineerd met zijn eigen providers, mogelijkheden bieden tot het lezen en vaak ook schrijven in veel indelingen:
- Vector data formats include ESRI formats (shapefiles, geodatabases...), MapInfo and MicroStation file formats, AutoCAD DWG/DXF, GeoPackage, GeoJSON, GRASS, GPX, KML, Comma Separated Values, and many more... Read the complete list of OGR vector supported formats;
- Raster data formats include ArcInfo Binary Grid, ArcInfo ASCII Grid, JPEG, GeoTIFF, ERDAS IMAGINE, MBTiles, R or Idrisi rasters, ASCII Gridded XYZ, GDAL Virtual, SRTM, Sentinel Data, and many more... Read the complete list of raster supported formats;
- Database formats include PostgreSQL/PostGIS, SQLite/SpatiaLite, Oracle, DB2 or MSSQL Spatial, MySQL...;
- Support of web data services (WM(T)S, WFS, WCS, CSW, ArcGIS Servers...) is also handled by QGIS providers (see QGIS als cliënt voor OGC-gegevens);
U kunt ook ondersteunde bestanden inlezen vanuit gearchiveerde mappen en eigen indelingen van QGIS gebruiken, zoals virtuele en geheugenlagen.
As of the date of this document, more than 80 vector and 140 raster formats are supported by the GDAL/OGR and QGIS native providers.
Notitie
Niet alle genoemde indelingen zullen zomaar werken in QGIS om verschillende redenen. Sommige vereisen externe commerciële funktiebibliotheken, of de GDAL/OGR-installatie op uw besturingssysteem is niet gebouwd om ondersteuning te bieden voor de indeling die u wilt gebruiken. Voer de opdracht voor de opdrachtregel ogrinfo --formats (voor vector) uit of selecteer het menu Extra ‣ Opties ‣ GDAL (voor raster) in QGIS om een lijst te zien met beschikbare indelingen.
Het paneel Browser
QGIS Browser is one of the main panels of QGIS that lets you quickly and easily add your data to projects. It helps you navigate in your filesystem and manage geodata, regardless the type of layer (raster, vector, table), or the datasource format (plain or compressed files, database, web services).
To add a layer into a project:
- right-click on QGIS toolbar and check
 Browser Panel
to activate it or select it from the menu View ‣ Panels
(or
Browser Panel
to activate it or select it from the menu View ‣ Panels
(or  Settings ‣ Panels);
 - a browser tree with your filesystem, databases and web services is displayed;
- find the layer in the list;
- right-click on its name and select Add selected layer(s). Your layer is now added to the Layers Panel and can be viewed in the map canvas.
Notitie
You can also add a layer or open a QGIS project directly from the Browser panel by double-clicking its name or by drag-and-drop into the map canvas.
Eenmaal geladen kunt u de laag bestuderen met de functies voor kaartnavigatie. Open, om de stijl van een laag te wijzigen, het scherm Laageigenschappen door te dubbelklikken op de naam van de laag in de legenda, of door met de rechts te klikken op de naam in de legenda en te kiezen voor Eigenschappen in het contextmenu. Zie het gedeelte Style Properties voor meer informatie over het instellen van symbologie aan vectorlagen.
Aan de bovenkant van het paneel Browser vindt u enkele pictogrammen die u helpen om:
 Geselecteerde lagen toevoegen: u kunt ook gegevens aan het kaartvenster toevoegen door Geselecteerde lagen toevoegen te selecteren in het contextmenu van de laag;
 Bijwerken van de boom van de browser;
 Filter browser om te zoeken naar specifieke gegevens. Voer een woord in om naar te zoeken of een jokerteken en de browser zal de boom filteren om alleen paden naar overeenkomende tabellen, bestandsnamen of mappen van databases weer te geven – andere gegevens of mappen zullen niet worden weergegeven. Bekijk het voorbeeld voor Paneel Browser(2) in de figure_browser_panels. De vergelijking mag hoofdlettergevoelig zijn of niet. Hij kan ook worden ingesteld op:
normaal: geeft elk item terug dat de zoektekst bevat;
Jokerteken(s) gebruiken: stem de zoekactie fijn af door tekens ? en/of * te gebruiken om de positie van de zoektekst te specificeren;
een reguliere expressie gebruiken.
 Alles inklappen de gehele boom;
 Enable/disable properties widget: when toggled on,
a new widget is added at the bottom of the panel showing, if applicable,
metadatas of the selected item.
Enable/disable properties widget: when toggled on,
a new widget is added at the bottom of the panel showing, if applicable,
metadatas of the selected item.
Klikken met rechts op een item in de boom van de browser helpt u om:
in het geval van een bestand of een tabel, de metadata ervan weer te geven of om het te openen in uw project. Tabellen kunnen zelfs worden hernoemd, verwijderd of afgekort;
in het geval van een map, als Favoriete plaats op te nemen in uw favorieten, het te verbergen voor de boom van de browser. Verborgen mappen kunnen worden beheerd vanaf de tab Extra ‣ Opties ‣ Databronnen;
verbindingen te maken naar databases of webservers;
schema’s vernieuwen, hernoemen of verwijderen.
U kunt ook bestanden in databases importeren of tabellen kopiëren van het ene schema/database naar een ander door eenvoudigweg te slepen en neer te zetten. Er is een tweede paneel Browser beschikbaar om lang scrollen bij het slepen te vermijden. Selecteer eenvoudigweg het bestand en verplaats het naar het andere paneel met slepen en neerzetten.
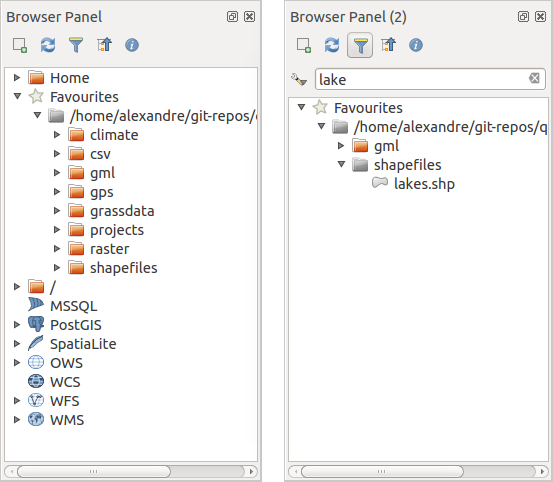
Panelen QGIS Browser naast elkaar
Tip
Lagen aan QGIS toevoegen door ze eenvoudigweg te slepen en neer te zetten vanuit de bestandsbrowser van uw besturingssysteem
U kunt ook bestand(en) toevoegen aan het project door ze te slepen en neer te zetten vanuit de bestandsbrowser van uw besturingssysteem naar het paneel Lagen of het kaartvenster.
De DB Manager
De plug-in DB Manager is een van de andere belangrijkste en eigen gereedschappen om indelingen van ruimtelijke databases die worden ondersteund door QGIS (PostGIS, SpatiaLite, GeoPackage, Oracle Spatial, MSSQL, DB2, Virtuele lagen) in één gebruikersinterface te integreren en te beheren. Het kan worden geactiveerd vanuit het menu Plug-ins ‣ Plug-ins beheren en installeren....
De plug-in  DB Manager verschaft verscheidene mogelijkheden:
verbinden met databases en de structuur en inhoud ervan weergeven;
tabellen van databases bekijken;
lagen toevoegen aan het kaartvenster, ofwel door te dubbelklikken of door te slepen en neer te zetten;
lagen toevoegen aan een database vanuit de QGIS Browser of vanuit een andere database;
SQL-query’s maken en de uitvoer daarvan toevoegen aan het kaartvenster;
virtuele lagen maken.
Meer informatie over de mogelijkheden van DB Manager worden uitgelegd in Plug-in DB Manager.
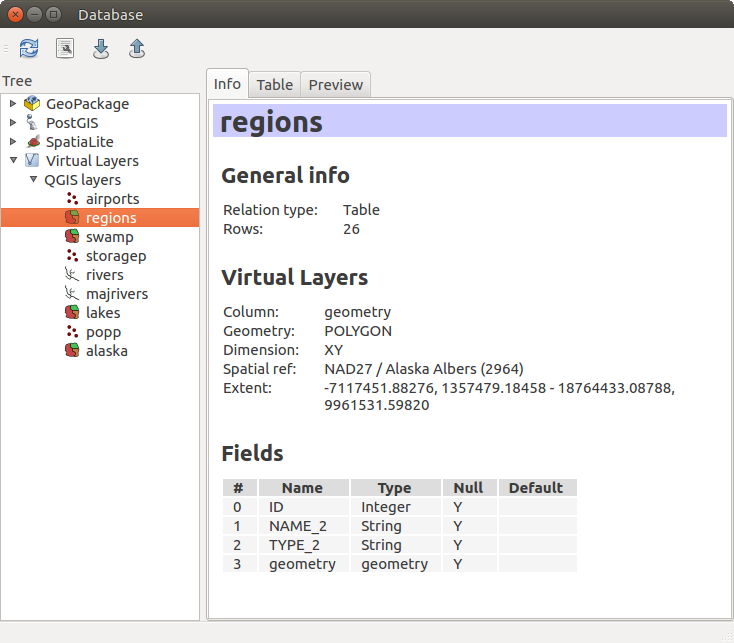
Dialoogvenster DB Manager
Provider-gebaseerde gereedschappen voor laden
Naast het paneel Browser en DB Manager, de belangrijkste gereedschappen die door QGIS worden verschaft om lagen toe te voegen ongeacht hun indeling, vindt u ook gereedschappen die specifiek zijn voor gegevensproviders.
Notitie
Enkele externe plug-ins verschaffen ook gereedschappen om bestanden in specifieke indelingen te openen in QGIS.
Een laag uit een bestand laden
U kunt, om een laag uit een bestand te laden:
for vector data (like Shapefile, Mapinfo or dxf layer), click on
 Add Vector Layer toolbar button, select the
Layer ‣ Add Layer ‣ Add Vector
Layer menu option or press Ctrl+Shift+V.
This will bring up a new window (see figure_vector_add) from which you can
check
Add Vector Layer toolbar button, select the
Layer ‣ Add Layer ‣ Add Vector
Layer menu option or press Ctrl+Shift+V.
This will bring up a new window (see figure_vector_add) from which you can
check  File and click on [Browse]. You can
also specify the encoding for the file if desired.
File and click on [Browse]. You can
also specify the encoding for the file if desired.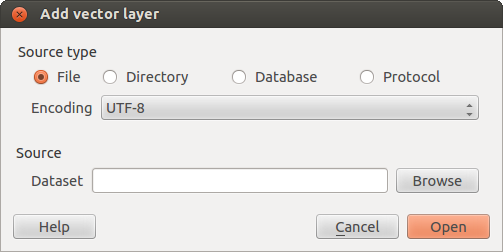
Dialoogvenster Vectorlaag toevoegen
voor rasterlagen, klik op het pictogram
 Rasterlaag toevoegen, selecteer de menuoptie Kaartlagen ‣ Laag toevoegen ‣ Rasterlaag toevoegen of typ Ctrl+Shift+R.
Dat zal een standaard bestandsdialoogvenster openen (zie figure_vector_open), wat u in staat stelt te navigeren door het bestandssysteem en een shapefile, een GeoTIFF of andere ondersteunde gegevensbron laden. Het selectievak Filter  stelt u in staat enkele ondersteunde bestandsindelingen te selecteren. Alleen de indelingen die naar voldoening zijn getest zullen in de lijst verschijnen. Andere, niet geteste, indelingen kunnen worden geselecteerd met Alle bestanden (*.*).
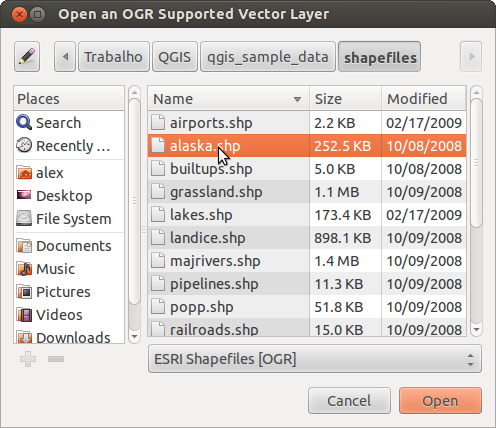
Dialoogvenster Open een OGR ondersteunde vectorlaag
Selecting a file from the list and clicking [Open] loads it into QGIS. More than one layer can be loaded at the same time by holding down the Ctrl or Shift key and clicking on multiple items in the dialog. Figure_vector_loaded shows QGIS after loading the alaska.shp file.
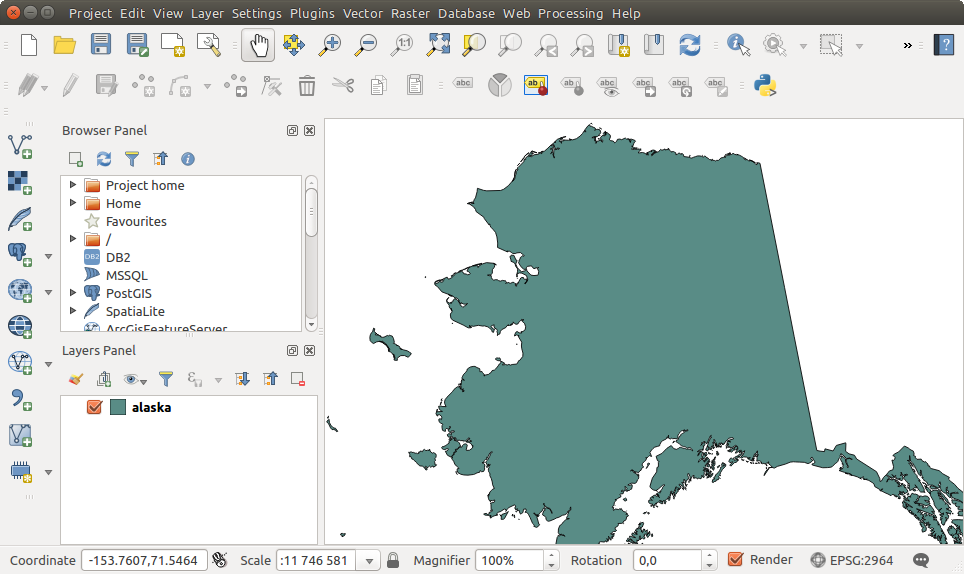
QGIS met het geladen shapefile van Alaska
Notitie
Omdat sommige indelingen, zoals MapInfo (bijv. .tab) of Autocad (.dxf), toestaan dat verschillende typen geometrie worden gemixt in één bestand, opent het laden van een dergelijke indeling in QGIS een dialoogvenster om te gebruiken geometrieën te selecteren om één geometrie per laag te krijgen.
Using the Add Vector Layer tool:
You can also load specific formats like ArcInfo Binary Coverage, UK. National Transfer Format, as well as the raw TIGER format of the US Census Bureau or OpenfileGDB. To do that, you’d need to select
Directory as Source type. In this case
a directory can be selected in the dialog after pressing [Browse].With the
Database source type you can select an
existing database connection or create one to the selected database type.
Available database types are ODBC, OGDI Vectors, Esri Personal
Geodatabase, MySQL as well as PostgreSQL or MSSQL.Pressing the [New] button opens the Create a New OGR Database Connection dialog whose parameters are among the ones you can find in Een opgeslagen verbinding maken. Pressing [Open] you can select from the available tables for example of the PostGIS enabled database.
The last source type,
Protocol, enables to open
data from the web using for example GeoJSON or CouchDB format. After
selecting the type you have to fill URI of the source.
Tip
Het laden van lagen en projecten vanaf externe drives onder MacOS
On macOS, portable drives that are mounted beside the primary hard drive do not show up as expected under File ‣ Open Project. We are working on a more macOS-native open/save dialog to fix this. As a workaround, you can type /Volumes in the File name box and press Enter. Then you can navigate to external drives and network mounts.
Een tekstgescheiden bestand importeren
Delimited text file (e.g. .csv, .txt) can be loaded in QGIS
using the tools described above. However, loaded this way, it’ll show up like a
simple table data. Sometimes, delimited text files can contain geometric data
you’d want to visualize; this is what the  Add
Delimited Text Layer is designed for.
Add
Delimited Text Layer is designed for.
Click the toolbar icon Add Delimited Text Layer in the
Manage layers toolbar to open the Create a Layer from a
Delimited Text File dialog, as shown in figure_delimited_text.
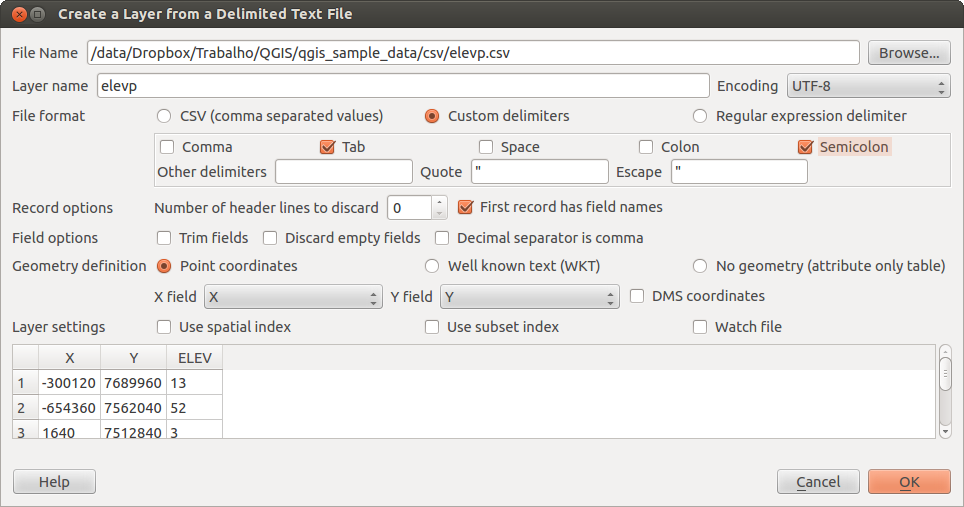
Dialoogvenster Maak een laag uit een tekstgescheiden bestand
First, select the file to import (e.g., qgis_sample_data/csv/elevp.csv) by clicking on the [Browse] button. Once the file is selected, QGIS attempts to parse the file with the most recently used delimiter. To enable QGIS to properly parse the file, it is important to select the correct delimiter. You can specify a delimiter by activating:
- CSV (comma separated values);
 Zelfgekozen tekstscheiders, kiezen uit een aantal vooraf gedefinieerde scheidingstekens, zoals komma, spatie, tab, puntkomma...;
of
Reguliere expressie tekstscheider en tekst in te voeren in het veld Expressie. gebruik bijvoorbeeld,, om het scheidingsteken te wijzigen naar tab, \t (dit is een reguliere expressie voor het teken tab).
Once the file is parsed, set Geometry definition to
Point coordinates and choose the X and Y
fields from the dropdown lists. If the coordinates are defined as
degrees/minutes/seconds, activate the DMS coordinates
checkbox.
Finally, enter a layer name (e.g., elevp), as shown in figure_delimited_text. To add the layer to the map, click [OK]. The delimited text file now behaves as any other map layer in QGIS.
There is also a helper option that allows you to trim leading and trailing
spaces from fields — Trim fields. Also, it is possible
to Discard empty fields. If necessary, you can force a
comma to be the decimal separator by activating Decimal
separator is comma.
If spatial information is represented by WKT, activate the
Well Known Text option and select the field with the WKT definition
for point, line or polygon objects. If the file contains non-spatial data,
activate No geometry (attribute only table) and it
will be loaded as an ordinal table.
Aanvullend kunt u inschakelen:
- Use spatial index to improve the performance of
displaying and spatially selecting features;
- Use subset index;
- Watch file to watch for changes to the file by other
applications while QGIS is running.
Een DXF- of DWG-bestand importeren
DXF and DWG files can be added to QGIS by simple drag-and-drop from the common Browser Panel. You’ll be prompted to select the sublayers you’d like to add to the project. Layers are added with random style properties.
Notitie
DXF-bestanden bevatten verscheiden typen geometrie (punt, lijn en/of polygoon), de naam van de laag zal worden samengesteld uit <filename.dxf> entiteiten <geometry type>.
To keep the dxf/dwg structure and its symbology in QGIS, you may want to use the dedicated Project ‣ DWG/DXF Import... tool. Indeed, the DWG/DXF Import dialog allows you to import into GeoPackage database any element of the drawing file.
In the dialog, you have to:
- Input a location for a GeoPackage file, that will be created to store the DWG/DXF content to;
- Specify which coordinate system the data in the DWG data is in;
- Then use the [Import] button to select the DWG/DXF file to use (one per geopackage). The GeoPackage database will be automatically populated with the drawing file content. Depending on the size of the *CAD file, this could take some time;
- The Expand block references will transform the existing
blocks into normal elements;
- the Use curves promotes the output layers geometry type
to a curved one.
After the .dwg or .dxf data is imported into the GeoPackage database the frame in the lower half of the dialog is populated with the list of layers from the imported file. There you can select which layers to add to the QGIS project:
- At the top, set a Group name to group the drawing files in the project;
- Check layers to show: Each selected layer is added to an ad hoc group which contains vector layers for the point, line, label and area features of the drawing layer. The style of each layer is setup so that it resembles the look it originally had in *CAD;
- Check whether layer should be visible at opening;
- Alternatively using the Merge layers option places all
layers in a single group;
- Press [OK] to open the layers in QGIS.
OpenStreetMap vectors Importeren
In recente jaren heeft het project OpenStreetMap enorm aan populariteit gewonnen omdat in vele landen geen gratis geo-gegevens zoals digitale wegenkaarten beschikbaar zijn. Het doel van het project OSM is om een gratis bewerkbare kaart van de wereld te maken vanuit GPS-gegevens, lucht-/satellietfotografie of lokale kennis. QGIS verschaft ondersteuning voor gegevens van OSM om dat doel te ondersteunen.
Met behulp van het paneel Browser kunt u een .osm-bestand laden in het kaartvenster, in welk geval u een dialoogvenster krijgt om sublagen te selecteren, gebaseerd op het type geometrie. De geladen lagen zullen alle gegevens voor dat type geometrie in het bestand bevatten en de gegevensstructuur van het osm-bestand behouden.
To avoid working with a such complex data structure, and be able to select only features you need based on their tags, QGIS provides a core and fully integrated OpenStreetMap import tool:
- To connect to the OSM server and download data, open the menu Vector ‣ OpenStreetMap ‣ Download data.... You can skip this step if you already obtained an .osm XML file using JOSM, Overpass API or any other source;
- The menu Vector ‣ OpenStreetMap ‣ Import Topology from XML... will convert your .osm file into a SpatiaLite database and create a corresponding database connection;
- The menu Vector ‣ OpenStreetMap ‣ Export Topology to
SpatiaLite... then allows you to open the database connection, select the
type of data you want (points, lines, or polygons) and choose tags to import.
This creates a SpatiaLite geometry layer that you can add to your
project by clicking on the
 Add SpatiaLite Layer toolbar button or by selecting the
Add SpatiaLite Layer... option
from the Layer menu (see section SpatiaLite-lagen).
Add SpatiaLite Layer toolbar button or by selecting the
Add SpatiaLite Layer... option
from the Layer menu (see section SpatiaLite-lagen).
GPS
Laden van GPS-gegevens in QGIS kan worden gedaan met behulp van de bronplug-in: GPS Tools. Instructies worden beschreven in het gedeelte Plug-in GPS-gereedschap.
GRASS
Het werken met vectorgegevens voor GRASS is beschreven in Integratie van GRASS GIS.
SpatiaLite-lagen
De eerste keer dat u gegevens laadt vanuit een database van SpatiaLite begint met:
klikken op de knop op de werkbalk
SpatiaLite-laag toevoegen;selecteren van de optie
SpatiaLite-laag toevoegen... uit het menu Kaartlagen ‣ Laag toevoegen;of door te typen Ctrl+Shift+L.
This will bring up a window that will allow you either to connect to a SpatiaLite database already known to QGIS, which you can choose from the drop-down menu, or to define a new connection to a new database. To define a new connection, click on [New] and use the file browser to point to your SpatiaLite database, which is a file with a .sqlite extension.
QGIS ondersteunt ook het bewerken van gegevens via te bewerken Views in SpatiaLite.
Database gerelateerde gereedschappen
Een opgeslagen verbinding maken
In order to read and write tables from the many database formats QGIS supports you’ll need to create a connection to that database. While QGIS Browser Panel is the simplest and recommanded way to connect and use databases within, QGIS provides specific tools you can use to connect to each of them and load their tables:
 Add PostGIS Layer... or by typing
Ctrl+Shift+D
Add PostGIS Layer... or by typing
Ctrl+Shift+D Add MSSQL Spatial Layer or by typing
Ctrl+Shift+M
Add MSSQL Spatial Layer or by typing
Ctrl+Shift+M Add Oracle Spatial Layer... or typing
Ctrl+Shift+O
Add Oracle Spatial Layer... or typing
Ctrl+Shift+O Add DB2 Spatial Layer... or typing
Ctrl+Shift+2
Add DB2 Spatial Layer... or typing
Ctrl+Shift+2
Deze gereedschappen zijn toegankelijk ofwel vanuit de Werkbalk Lagen beheren of het menu Kaartlagen ‣ Laag toevoegen ‣. Verbinden met een database van SpatiaLite database wordt beschreven in SpatiaLite-lagen.
Tip
Verbinding naar database maken vanuit het QGIS paneel Browser
Selecteer de overeenkomende indeling voor de database in de boom van de Browser, klik met rechts en kiezen van Verbinden zal het dialoogvenster voor de verbinding met de database openen.
Most of the connection dialogs follow a common basis that will be described below using the PostGreSQL database tool as example.
The first time you use a PostGIS data source, you must create a connection to a database that contains the data. Begin by clicking the appropriate button as exposed above, opening an Add PostGIS Table(s) dialog (see figure_add_postgis_tables). To access the connection manager, click on the [New] button to display the Create a New PostGIS Connection dialog.
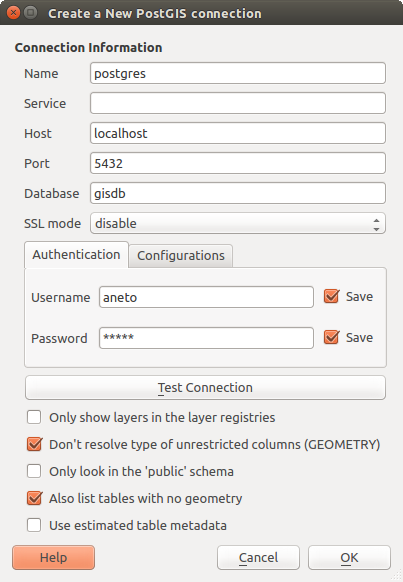
Dialoogvenster Nieuwe PostGIS-verbinding maken
De voor een PostGIS-verbinding vereiste parameters worden hieronder weergegeven. Voor de andere typen database, bekijk hun verschillen in Bijzondere vereisten voor verbindingen.
Naam: Een naam voor deze verbinding. Die mag hetzelfde zijn als Database.
Service: Service-parameter die gebruikt kan worden als alternatief voor Host/Poort (en eventueel ook Database). Dit kan gedefinieerd worden in pg_service.conf. Bekijk het gedeelte PostgreSQL service verbindingsbestand voor meer details.
Host: Naam van de host van de database. Dit moet een terug te vinden naam zijn zoals die gebruikt wordt voor een TCP/IP-verbinding of hoe de host kunt pingen. Wanneer de database op dezelfde computer staat als QGIS, gebruik hier dan localhost.
Poort: Poortnummer waar de server van de database van PostgreSQL naar luistert. De standaardpoort voor PostGIS is 5432.
Database: Naam van de database.
SSL mode: Hoe de SSL-verbinding zal onderhandelen met de server. Onthoud dat enorm versnellen van het renderen van een laag van PostGIS kan worden bereikt door het uitschakelen van SSL in de bewerker van de verbinding. De volgende opties zijn beschikbaar:
Uitschakelen: alleen verbinden zonder SSL-versleuteling
Toestaan: Probeer een verbinding zonder SSL-versleuteling, als dat mislukt probeer dan een verbinding met SSL.
Voorkeur (de standaard): Probeer een verbinding met SSL-versleuteling. Als dat mislukt probeer dan een verbinding zonder SSL.
Vereist: Alleen verbinden met SSL-versleuteling.
Gebruikersnaam: Gebruikersnaam om toegang te krijgen tot de database.
Wachtwoord: Wachtwoord dat hoort bij Gebruikersnaam om toegang te krijgen tot de database.
You can save any or both of the username and password parameters, in which case they will be used by default each time you need to connect to this database. If not saved, you’ll be prompted to fill the missing credentials to connect to the database in next QGIS sessions; meanwhile the connection parameters you entered are stored in a temporary internal cache and returned whenever a username/password for the same database is requested, until you close the current QGIS process.
Waarschuwing
QGIS Gebruikersinstellingen en beveiliging
Op de tab Authenticatie zal het opslaan van gebruikersnaam en wachtwoord niet beveiligde inloggegevens behouden in de configuratie van de verbinding. Deze inloggegevens zullen zichtbaar zijn als u, bijvoorbeeld, het projectbestand deelt met iemand. Daarom wordt geadviseerd om uw inloggegevens in plaats daarvan op te slaan in een configuratie voor Authenticatie (tab Configuraties). Bekijk ref:authentication_index voor meer details) of in een service verbindingsbestand (zie PostgreSQL service verbindingsbestand bijvoorbeeld).
Optioneel, afhankelijk van het type database, kunnen de volgende keuzevakken worden geactiveerd:
- Toon alleen lagen in de kaartlagen registers
- Niet het type geometrie bepalen voor onbeperkte kolommen (GEOMETRY)
- Alleen in het ‘publieke’-schema kijken
- Ook tabellen zonder geometrie tonen
- Gebruik ’estimated table statistics’
Tip
Geschatte metadata voor tabel gebruiken om bewerkingen te versnellen
Bij het initialiseren van lagen zouden verscheidene query’s nodig kunnen zijn om de karakteristieken vast te stellen van de geometrieën die zijn opgeslagen in de tabel van de database. Wanneer de optie Gebruik ‘estimated table metadata’ is geselecteerd, onderzoeken deze query’s slechts een monster van de rijen en gebruiken de tabelstatistieken, in plaats van de gehele tabel. Dit kan de verwerking van bewerkingen op grote gegevenssets enorm versnellen, maar zou kunnen resulteren in onjuiste karakterisering van lagen (bijv. de telling van het aantal objecten van gefilterde lagen zou niet nauwkeurig genoeg bepaald kunnen zijn) en zou zelfs vreemd gedrag kunnen veroorzaken in het geval dat kolommen, die geacht worden uniek te zijn, dat in feite niet zijn.
Once all parameters and options are set, you can test the connection by clicking on the [Test connection] button or apply it hitting [OK]. From the Add PostGIS Table(s), click now on [Connect] and the dialog is filled with tables from the selected database (as shown in figure_add_postgis_tables).
Bijzondere vereisten voor verbindingen
Vanwege de bijzonderheden van de typen databases zijn alle gegeven opties hetzelfde voor alle databases. Hieronder worden specifieke eisen voor verbindingen weergegeven.
PostgreSQL service verbindingsbestand
Het service verbindingsbestand maakt het mogelijk dat in PostgreSQL parameters voor een verbinding worden geassocieerd met één enkele naam van een service. Die naam van een service kan dan worden gespecificeerd door een cliënt en de geassocieerde instellingen zullen worden gebruikt.
Het is genaamd .pg_service.conf op systemen van *nix (GNU/Linux, MacOS etc.) en pg_service.conf op Windows.
Het servicebestand ziet er uit als:
[water_service]
host=192.168.0.45
port=5433
dbname=gisdb
user=paul
password=paulspass

[wastewater_service]
host=dbserver.com
dbname=water
user=waterpass
Notitie
Er staan twee services in het voorbeeld hierboven: water_service en wastewater_service. U kunt deze gebruiken om te verbinden vanuit QGIS, pgAdmin etc. door alleen de naam te specificeren van de service waarmee u wilt verbinden (zonder de omsluitende haakjes). Indien u de service wilt gebruiken met psql dient u iets te doen als export PGSERVICE=water_service vóórdat u uw opdrachten voor psql opgeeft.
Notitie
U vindt alle parameters hier
Notitie
Indien u de wachtwoorden niet wilt opslaan in het servicebestand, kunt u de optie .pg_pass gebruiken.
Op besturingssystemen van *nix (GNU/Linux, MacOS etc.) kunt u het bestand .pg_service.conf opslaan in de thuismap van de gebruiker en de cliënten van PostgreSQL zullen zich er automatisch bewust van zijn. Als, bijvoorbeeld de gebruiker web is, zou het bestand .pg_service.conf moeten zijn opgeslagen in de map /home/web/ om direct te kunnen werken (zonder enige andere omgevingsvariabelen te moeten opgeven).
U kunt de locatie van het servicebestand specificeren door een omgevingsvariabele PGSERVICEFILE te maken (bijv. voer de opdracht export PGSERVICEFILE=/home/web/.pg_service.conf uit onder uw *nix besturingssysteem om de variabele PGSERVICEFILE tijdelijk in te stellen)
U kunt het servicebestand ook systeembreed (alle gebruikers) beschikbaar maken, ofwel door het bestand pg_service.conf` te plaatsen in .pg_config --sysconfdir` of door de omgevingsvariabele ``PGSYSCONFDIR toe te voegen om de map te specificeren die het servicebestand bevat. Als servicedefinities met dezelfde naam bestaan in het gebruikers- en het systeembestand, heeft het gebruikersbestand voorrang boven het systeembestand.
Waarschuwing
Er zijn enkele valkuilen onder Windows:
Het servicebestand zou moeten worden opgeslagen als pg_service.conf en niet als .pg_service.conf.
Het servicebestand zou moeten worden opgeslagen in de indeling voor Unix om te kunnen werken. Eén manier om dat te doen is door het te openen in Notepad++ en dan Bewerken -> Formaat -> UNIX-indeling -> Bestand opslaan.
U kunt omgevingsvariabelen op verscheidene manieren toevoegen; een geteste, die betrouwbaar werkt, is Configuratiescherm ‣ Systeem ‣ Geavanceerde systeeminstellingen ‣ Omgevingsvariabelen toevoegen PGSERVICEFILE en het pad als type C:\Users\John\pg_service.conf
Na het toevoegen van een omgevingsvariabele zou u mogelijk uw computer opnieuw moeten opstarten.
Verbinden met Oracle Spatial
De ruimtelijke objecten in Oracle Spatial helpen gebruikers bij het beheren van geografische en locatie-gegevens in een eigen type binnen een database van Oracle. In aanvulling op enkele opties in Een opgeslagen verbinding maken, stelt het dialoogvenster voor:
Database SID of SERVICE_NAME van de Oracle instantie;
Poort: Poortnummer waar de server van de database van Oracle naar luistert. De standaard poort is 1521;
Werkruimte: De werkruimte waarnaar moet worden geschakeld.
Optioneel kunt u de volgende keuzevakken activeren:
- Only look in metadata table: restricts the displayed
tables to those that are in the all_sdo_geom_metadata view. This can
speed up the initial display of spatial tables;
- Only look for user’s tables: when searching for spatial
tables, restrict the search to tables that are owned by the user;
- Also list tables with no geometry: indicates that
tables without geometry should also be listed by default;
- Use estimated table statistics for the layer metadata:
when the layer is set up, various metadata are required for the Oracle table.
This includes information such as the table row count, geometry type and
spatial extents of the data in the geometry column. If the table contains a
large number of rows, determining this metadata can be time-consuming. By
activating this option, the following fast table metadata operations are
done: Row count is determined from all_tables.num_rows. Table extents
are always determined with the SDO_TUNE.EXTENTS_OF function, even if a layer
filter is applied. Table geometry is determined from the first 100
non-null geometry rows in the table;
- Only existing geometry types: only list the existing
geometry types and don’t offer to add others;
- Aanvullende attributen geometrie opnemen
Tip
Oracle Spatial-lagen
Normaal gesproken wordt een ruimtelijke laag in ORACLE gedefinieerd door een item in de tabel USER_SDO_METADATA.
Verbinden met DB2 Spatial
In aanvulling op enkele van de beschreven opties in Een opgeslagen verbinding maken, kan de verbinding naar een database van DB2 database (zie DB2 Spatial-lagen voor meer informatie) worden gespecificeerd ofwel met behulp van een naar ODBC gedefinieerde Service/DSN-naam of met behulp van informatie voor stuurprogramma, host en poort.
Een ODBC Service/DSN-verbinding vereist dat de naam van de service wordt gedefinieerd naar ODBC.
Een stuurprogramma/host/poort-verbinding vereist:
Stuurbestand (driver): Naam van het stuurprogramma voor DB2. Gewoonlijk zou dit het stuurprogramma IBM DB2 ODBC DRIVER zijn.
Host: Naam van de host van de database. Dit moet een terug te vinden naam zijn zoals die gebruikt wordt voor een TCP/IP-verbinding of hoe de host kunt pingen. Wanneer de database op dezelfde computer staat als QGIS, gebruik hier dan localhost.
Poort: Poortnummer waar de server van de database van DB2 naar luistert. De standaard DB2 LUW-poort is 50000. De standaard DB2 z/OS-poort is 446.
Tip
DB2 Spatial-lagen
Een DB2 Spatial-laag wordt gedefinieerd door een rij in de weergave DB2GSE.ST_GEOMETRY_COLUMNS.
Notitie
Het is belangrijk, om effectief te kunnen werken met DB2 ruimtelijke tabellen in QGIS, dat tabellen een kolom INTEGER of BIGINT hebben gedefinieerd als PRIMARY KEY en indien nieuwe objecten zullen worden toegevoegd, zou deze kolom ook een karakteristiek GENERATED moeten hebben.
Het is ook nuttig als de ruimtelijke kolom is geregistreerd met een specifieke ruimtelijke referentie-ID (meestal 4326 voor coördinaten in WGS84). Een ruimtelijke kolom kan worden geregistreerd door de opgeslagen procedure ST_Register_Spatial_Column aan te roepen.
Verbinden met MSSQL Spatial
In aanvulling op enkele opties in Een opgeslagen verbinding maken, stelt het dialoogvenster voor het maken van een nieuwe verbinding voor MSSQL u voor om een Provider/DSN-naam in te vullen. U kunt ook aanwezige databases weergeven.
Het laden van laag uit een database
Wanneer u eenmaal één of meer verbindingen hebt gedefinieerd naar een database (zie het gedeelte Een opgeslagen verbinding maken), kunt u er lagen uit laden. Natuurlijk vereist dit dat er gegevens beschikbaar zijn. Bekijk bijvoorbeeld het gedeelte Importeren van gegevens in PostgreSQL voor een bespreking over het importeren van gegevens in een database van PostGIS.
U kunt de volgende stappen uitvoeren om een laag te laden uit een database:
- Open the “Add <database> table(s)” dialog (see Een opgeslagen verbinding maken),
- Choose the connection from the drop-down list and click [Connect].
Selecteer of deselecteer het keuzevak
Ook tabellen zonder geometrie tonen- Optionally, use some Search Options to reduce the
list of tables to those matching your search. You can also set this option
before you hit the [Connect] button, speeding this way the database
fetching.
Zoek naar de laag/lagen die u wilt toevoegen in de lijst van beschikbare lagen.
Selecteer deze door er op te klikken. U kunt meerdere lagen selecteren door de Shift-toets in te drukken tijdens het klikken.
- If applicable, use the [Set Filter] button (or double-click the layer) to start the Query builder dialog (See section Querybouwer) and define which features to load from the selected layer. The filter expression appears in the sql column. This restriction can be removed or edited in the Layer Properties ‣ General ‣ Provider Feature Filter frame.
- The checkbox in the Select at id column that is activated by default gets the features ids without the attributes and speed in most cases the data loading.
- Click on the [Add] button to add the layer to the map.
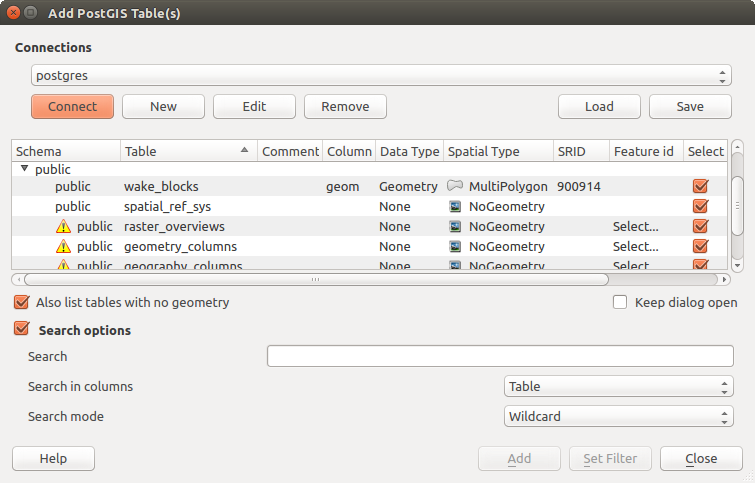
Dialoogvenster PostGIS-tabel(len) toevoegen
Tip
Load database table(s) from the Browser Panel
Like simple files, connected database are also listed in the Browser Panel. Hence, you can load tables from databases using the Browser:
- Find the layer to use with the Filter Browser tool at
the top the browser panel (see Het paneel Browser for the search options);
- select and drag-and-drop it in the map canvas.
QGIS aangepaste indelingen
QGIS stelt twee aangepaste indelingen voor die u in de toepassing kunt laden met behulp van hun eigen gereedschap voor het laden:
Tijdelijke tekenlaag: een geheugenlaag die is gebonden aan het project waarin hij is geopend (zie Een nieuwe tijdelijke tekenlaag maken voor meer informatie)
Virtuele lagen: een laag die resulteert vanuit een query op andere laag/lagen (zie Creating virtual layers voor meer informatie)
Verbinden met webservices
Met QGIS kunt u toegang krijgen tot verschillende typen webservices van OGC (WM(T)S, WFS(-T), CSW ...). Dankzij QGIS Server kunt u deze services ook publiceren. Beschrijving van deze mogelijkheden en how-to worden verschaft in het hoofdstuk Werken met gegevens van OGC.