重要
翻訳は あなたが参加できる コミュニティの取り組みです。このページは現在 100.00% 翻訳されています。
3. QGISのユーザインタフェース
QGISのグラフィカルユーザインタフェース(GUI) を以下に図で示します。黄色い丸の 1 から 5 の番号はQGIS GUIの重要な構成要素を表しています。それらについて以下で説明します。
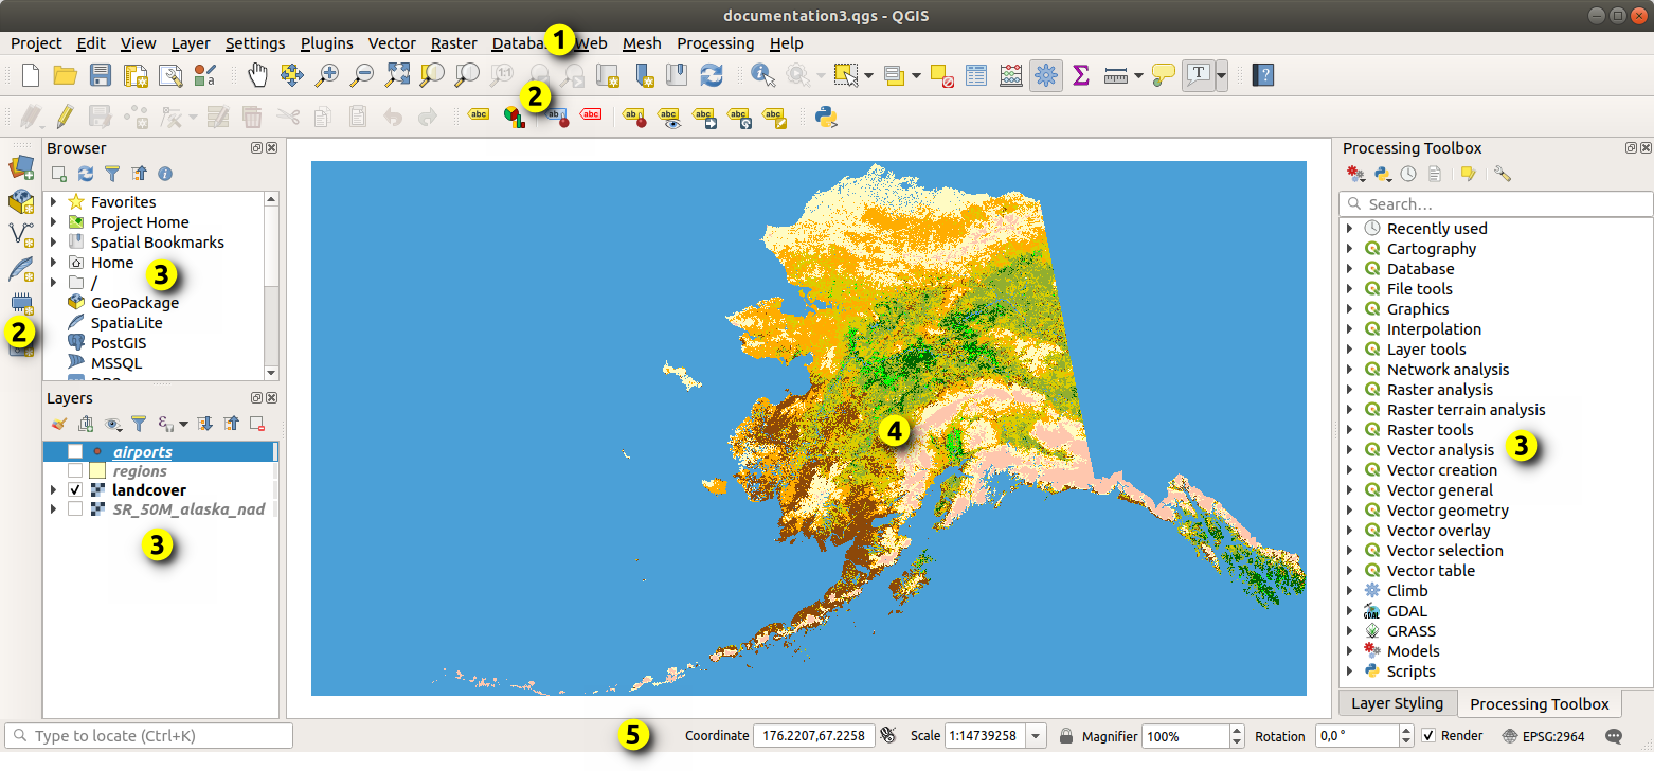
図 3.1 Alaskaサンプルデータを開いたQGIS GUI
注釈
ウィンドウの装飾(タイトルバー等)は、利用しているオペレーティングシステムやウィンドウマネージャによって表示が異なることがあります。
QGISのメインGUI( 図 3.1 ) は5つのコンポーネントで構成されています。コンポーネントのタイプは以下のとおりです:
下にスクロールすると、これらの詳細な説明があります。
3.1. メニューバー
メニューバーでは、標準的な階層型メニューを使用してQGISの機能にアクセスすることができます。メニュー、メニューのオプション、関連するアイコン、およびキーボードショートカットについて以下で説明します。キーボード ショートカットは再設定することができます( )。
ほとんどのメニューオプションには対応するツールがあり、その逆も同様です。ただし、メニューはツールバーとまったく同じように構成されてはいません。ツールバーのメニューオプションの場所を以下の表に示します。プラグインはメニューに新しいオプションを追加する場合があります。ツールとツールバーの詳細については、ツールバー を 参照してください。
注釈
QGISはクロスプラットフォームのアプリケーションです。ツールは通常はすべてのプラットフォームで使用できますが、オペレーティングシステムによっては異なるメニュー位置に配置される場合があります。以下のリストは、既知のバリエーションを含む、最も一般的な場所を示しています。
3.1.1. プロジェクト
メニューには、 プロジェクトファイル へのアクセスポイントと終了ポイントがあります。以下のツールを提供します:
新規 プロジェクトファイルを最初から作成するか、別のプロジェクトファイルをテンプレートとして使用します(テンプレートの設定については、 プロジェクトファイルのオプション を参照してください)。
開く... は、プロジェクトをファイル若しくはGeoPackage, PostgreSQLまたはOracleデータベースから開きます
閉じる プロジェクトを閉じるか、最後に保存した状態に戻します。
保存 は、プロジェクトを
.qgsまたは.qgzファイル形式で、ファイル若しくはGeoPackage、PostgreSQLまたはOracle データベースに保存しますマップキャンバスを異なるファイル形式でエクスポートしたり、 印刷レイアウト を使用してより複雑な出力を行います。
プロジェクトのプロパティやジオメトリ編集のスナップオプションを設定します。
メニューオプション |
ショートカット |
ツールバー |
参照 |
|---|---|---|---|
|
Ctrl+N |
プロジェクト |
|
|
Ctrl+O |
プロジェクト |
|
Alt+J + R |
|||
閉じる |
|||
|
Ctrl+S |
プロジェクト |
|
|
Ctrl+Shift+S |
プロジェクト |
|
元に戻す... |
|||
|
Ctrl+Shift+P |
||
スナップオプション... |
|||
|
|||
|
|||
|
Ctrl+P |
プロジェクト |
|
|
|||
|
プロジェクト |
||
|
Ctrl+Q |


 macOSでは、 QGISを終了 コマンドは ( Cmd+Q ) に対応します。
3.1.2. 編集
メニューには、レイヤの属性やジオメトリを編集するために必要なネイティブツールのほとんどが用意されています。 メニューのオプションを有効にするには、  編集モード切り替え をクリックして編集モードに切り替える必要があります(詳細は 編集 を参照してください)。
メニューオプション |
ショートカット |
ツールバー |
参照 |
|---|---|---|---|
|
Ctrl+Z |
デジタイジング |
|
|
Ctrl+Shift+Z |
デジタイジング |
|
|
Ctrl+X |
デジタイジング |
|
|
Ctrl+C |
デジタイジング |
|
|
Ctrl+V |
デジタイジング |
|
Ctrl+Alt+V |
|||
|
デジタイジング |
||
|
選択 |
||
|
選択 |
||
|
選択 |
||
|
選択 |
||
|
F3 |
選択 |
|
|
Ctrl+F3 |
選択 |
|
|
Ctrl+Alt+A |
選択 |
|
|
Ctrl+Shift+A |
選択 |
|
|
Ctrl+A |
選択 |
|
|
選択 |
||
|
Ctrl+. |
デジタイジング |
|
|
Ctrl+. |
デジタイジング |
|
|
Ctrl+. |
デジタイジング |
|
|
Ctrl+. |
デジタイジング |
|
|
注記 |
||
|
注記 |
||
|
デジタイジング |
||
|
高度なデジタイズ |
||
|
高度なデジタイズ |
||
|
高度なデジタイズ |
||
|
高度なデジタイズ |
||
|
高度なデジタイズ |
||
|
高度なデジタイズ |
||
|
高度なデジタイズ |
||
|
高度なデジタイズ |
||
|
高度なデジタイズ |
||
|
高度なデジタイズ |
||
|
高度なデジタイズ |
||
|
高度なデジタイズ |
||
|
高度なデジタイズ |
||
|
高度なデジタイズ |
||
|
高度なデジタイズ |
||
|
高度なデジタイズ |
||
|
デジタイジング |
||
|
デジタイジング |
||
|
高度なデジタイズ |
||
|
高度なデジタイズ |
||
|
高度なデジタイズ |
||
|
高度なデジタイズ |


選択されたレイヤのジオメトリタイプ(ポイント、ポリライン、ポリゴンなど)に依存するツールは、タイプに応じて有効化されます。
メニューオプション |
ポイント |
ポリライン |
ポリゴン |
|---|---|---|---|
地物を移動 |
|
|
|
地物をコピー/移動 |
|
|
|


3.1.3. ビュー
地図はマップビューにレンダリングされます。これらのビューは、 ツールを使用して操作することができます。例えば、次のことができます:
メインマップキャンバスの隣に新しい2Dまたは3Dマップビューを作成する
任意の場所に ズームまたはパン する
表示された地物の属性やジオメトリをクエリする
プレビューモードや注釈、装飾を使用して、マップビューを充実させる
パネルまたはツールバーにアクセスする
このメニューでは、次のようなアクションを使用してQGISのインターフェイス自体を再編成することもできます。
フルスクリーン切り替え: タイトルバーを非表示にして全画面表示にします
パネル表示切り替え: 有効な パネル の表示/非表示を切り替えます。地物をデジタイズするとき(キャンバスを最大限に表示するため)や、QGISのメインキャンバスを使ったプレゼンテーション(投影/録画)に便利です
地図のみ表示切り替え: パネル、ツールバー、メニュー、ステータスバーを非表示にし、マップキャンバスのみを表示します。全画面オプションと組み合わせると、画面に地図のみが表示されます
メニューオプション |
ショートカット |
ツールバー |
参照 |
|---|---|---|---|
|
Ctrl+M |
ナビゲーション |
|
|
Ctrl+Alt+M |
ナビゲーション |
|
|
ナビゲーション |
||
|
ナビゲーション |
||
|
Ctrl+Alt++ |
ナビゲーション |
|
|
Ctrl+Alt+- |
ナビゲーション |
|
|
ナビゲーション |
||
|
|||
|
Ctrl+Shift+I |
属性 |
|
属性 |
|||
|
Ctrl+Shift+M |
属性 |
|
|
Ctrl+Shift+J |
属性 |
|
|
属性 |
||
|
属性 |
||
|
属性 |
||
|
|||
|
Ctrl+Shift+F |
ナビゲーション |
|
|
Ctrl+J |
ナビゲーション |
|
|
ナビゲーション |
||
|
ナビゲーション |
||
|
ナビゲーション |
||
|
ナビゲーション |
||
Alt+V + D |
|||
|
|||
|
|||
|
|||
|
|||
|
|||
|
|||
|
|||
|
属性 |
||
|
Ctrl+B |
ナビゲーション |
|
|
Ctrl+Shift+B |
ナビゲーション |
|
|
|||
|
F5 |
ナビゲーション |
|
|
Ctrl+Shift+U |
||
|
Ctrl+Shift+H |
||
|
|||
|
|||
|
|||
選択レイヤを個別切り替え |
|||
|
|||
フルスクリーン切り替え |
F11 |
||
パネル表示切り替え |
Ctrl+Tab |
||
地図のみ切り替え |
Ctrl+Shift+Tab |


 Linux KDE では、、 および フルスクリーン切り替え は、 メニュー内にあります。
3.1.4. レイヤ
メニューには、新しいデータソースを 作成 したり、プロジェクトに 追加 したり、変更を保存 したりするための多数のツールが用意されています。同じデータソースを使って、以下のこともできます:
レイヤを複製 レイヤを複製してコピーを作成し、名前やスタイル(シンボロジ、ラベル、... )、テーブル結合などを変更することができます。コピーはオリジナルと同じデータソースを使います。
コピー と 貼り付け あるプロジェクトのレイヤまたはグループを別のところへ新たなインスタンスとして貼り付けます。プロパティは元のものとは独立して変更することができます。 複製 に関しては、レイヤは同じデータソースに基づいたままです。
レイヤとグループを埋め込む... 他のプロジェクトから、変更することができない読み取り専用のコピーとしてレイヤあるいはグループを読み込みます( 外部プロジェクトからのレイヤの埋め込み を参照してください)
メニューには、レイヤのプロパティ(スタイル、スケール、CRS...)を設定したり、コピー、貼り付けするツールも含まれています。
メニューオプション |
ショートカット |
ツールバー |
参照 |
|---|---|---|---|
|
Ctrl+L |
データソースマネージャ |
|
|
Ctrl+Shift+N |
データソースマネージャ |
|
|
データソースマネージャ |
||
|
データソースマネージャ |
||
|
データソースマネージャ |
||
|
データソースマネージャ |
||
|
データソースマネージャ |
||
|
データソースマネージャ |
||
|
Ctrl+Shift+V |
レイヤ管理 |
|
|
Ctrl+Shift+R |
レイヤ管理 |
|
|
レイヤ管理 |
||
|
Ctrl+Shift+T |
レイヤ管理 |
|
|
Ctrl+Shift+D |
レイヤ管理 |
|
|
Ctrl+Shift+L |
レイヤ管理 |
|
|
レイヤ管理 |
||
|
レイヤ管理 |
||
|
レイヤ管理 |
||
|
レイヤ管理 |
||
|
Ctrl+Shift+W |
レイヤ管理 |
|
|
|||
|
レイヤ管理 |
||
|
レイヤ管理 |
||
|
レイヤ管理 |
||
|
|||
|
|||
|
|||
レイヤとグループを埋め込む... |
|||
レイヤ定義ファイルから追加... |
|||
|
|||
|
|||
|
|||
|
|||
|
|||
|
F6 |
属性 |
|
|
Shift+F6 |
属性 |
|
|
Ctrl+F6 |
属性 |
|
|
属性 |
||
|
デジタイジング |
||
|
デジタイジング |
||
|
デジタイジング |
||
デジタイジング |
|||
デジタイジング |
|||
デジタイジング |
|||
デジタイジング |
|||
デジタイジング |
|||
デジタイジング |
|||
名前を付けて保存... |
|||
レイヤ定義ファイルとして保存... |
|||
|
Ctrl+D |
||
|
|||
レイヤを表示するスケールを設定 |
|||
レイヤのCRSを設定 |
Ctrl+Shift+C |
||
レイヤのCRSをプロジェクトに設定 |
|||
レイヤのプロパティ... |
|||
フィルタ... |
Ctrl+F |
||
|
|||
|
|||
|
|||
|


3.1.5. 設定
メニューオプション |
参照 |
|---|---|
|
|
|
|
|
|
|
|
|


Linux KDE では、 メニュー内に や 、 フルスクリーン切り替え といったツールがあります。
3.1.6. プラグイン
メニューオプション |
ショートカット |
ツールバー |
参照 |
|---|---|---|---|
|
|||
|
Ctrl+Alt+P |
プラグイン |


初めてQGISを起動したときには、すべてのコアプラグインがロードされるわけではありません。
3.1.7. ベクタ
ベクタ メニューには、ベクタデータセットの分析、管理、および操作を行うためのツールが用意されています。デフォルトでは、サブメニューでグループ化された、一連の定義済み プロセシング アルゴリズムが登録されています。これによってコアプロバイダのたくさんの一般的なベクタ型のGISタスクを、ショートカットから実行できます。これらのサブメニューが全て利用できない場合は、 で Processing プラグインを有効にしてください。
注釈
ツールの一覧とそのメニューは、任意のプロセシングアルゴリズム( プロセシングフレームワークを設定する を参照)や、サードパーティの プラグイン を用いて変更や拡張が可能です。
以下は全てのコアプラグインが有効になっている場合の ベクタ メニューです。
メニューオプション |
ショートカット |
ツールバー |
参照 |
|---|---|---|---|
|
|||
|
ベクタ |
||
Alt+O + G |
|||
|
|||
|
|||
|
|||
|
|||
|
|||
|
|||
|
|||
|
|||
|
|||
Alt+O + E |
|||
|
|||
|
|||
|
|||
|
|||
|
|||
|
|||
|
|||
|
|||
|
|||
|
|||
|
|||
|
|||
Alt+O + A |
|||
|
|||
|
|||
|
|||
|
|||
|
|||
|
|||
|
|||
|
|||
Alt+O + D |
|||
|
|||
|
|||
|
|||
|
|||
|
|||
Alt+O + R |
|||
|
|||
|
|||
|
|||
|
|||
|
|||
|
|||
|
|||
|
|||
|
|||
|
|||
|
|||
|


3.1.8. ラスタ
ラスタ メニューには、ラスタデータセットの分析、管理、および操作を行うためのツールが用意されています。デフォルトでは、サブメニューでグループ化された一連の事前定義済み プロセシング アルゴリズムが登録されています。これによってコアプロバイダのたくさんの一般的なラスタ型のGISタスクを、ショートカットから実行できます。これらのサブメニューが全て利用できない場合は、 で Processing プラグインを有効にしてください。
注釈
ツールの一覧とそのメニューは、任意のプロセシングアルゴリズム( プロセシングフレームワークを設定する を参照)や、サードパーティの プラグイン を用いて変更や拡張が可能です。
以下は全てのコアプラグインが有効になっている場合の ラスタ メニューです。
メニューオプション |
ショートカット |
ツールバー |
参照 |
|---|---|---|---|
|
|||
ラスタを揃える... |
|||
|
|||
|
|||
|
|||
|
|||
|
|||
|
|||
|
|||
|
|||
|
|||
|
|||
|
|||
|
|||
|
|||
|
|||
|
|||
|
|||
|
|||
|
|||
|
|||
|
|||
|
|||
|
|||
|
|||
|
|||
|
|||
|
|||
|
|||
|
|||
|
|||
|


3.1.9. データベース
メニューには、データベースを操作するためのツールが用意されています。データベース関連のプラグインが有効になっていない場合、データベース メニューは表示されません。以下は全てのコアプラグインが有効になっている場合の メニューです。
メニューオプション |
ショートカット |
ツールバー |
参照 |
|---|---|---|---|
オフライン編集... |
Alt+D + O |
||
|
Database |
||
|
Database |
||
|
Database |
||
|
Database |


初めてQGISを起動したときには、すべてのコアプラグインがロードされるわけではありません。
3.1.10. Web
以下はすべてのコアプラグインが有効になっている場合の Web メニューです。Webに関連したプラグインが有効化されていない場合には、Web メニューには何もありません。
メニューオプション |
ショートカット |
ツールバー |
参照 |
|---|---|---|---|
Alt+W + M |
|||
|
Web |
||

初めてQGISを起動したときには、すべてのコアプラグインがロードされるわけではありません。
3.1.11. メッシュ
メニューは、 メッシュレイヤ を操作するために必要なツールを提供します。サードパーティプラグインはこのメニューに項目を追加することができます。
メニューオプション |
ショートカット |
ツールバー |
参照 |
|---|---|---|---|
|
|||
|


3.1.12. プロセシング
メニューオプション |
ショートカット |
ツールバー |
参照 |
|---|---|---|---|
|
Ctrl+Alt+T |
||
|
Ctrl+Alt+G |
||
|
Ctrl+Alt+H |
||
|
Ctrl+Alt+R |
||
|


初めてQGISを起動したときには、すべてのコアプラグインがロードされるわけではありません。
3.1.13. ヘルプ
メニューオプション |
ショートカット |
ツールバー |
参照 |
|---|---|---|---|
|
F1 |
ヘルプ |
|
APIドキュメント |
|||
問題を報告 |
|||
有償サポートが必要ですか? |
|||
|
Ctrl+H |
||
|
|||
|
|||
|


3.1.14. QGIS
このメニューは、 Mac OS でのみ使用可能で、OSに関連するコマンドが含まれています。
メニューオプション |
ショートカット |
参照 |
|---|---|---|
QGISについて |
||
Preferences |
Cmd+, |
|
QGISを隠す |
Cmd+H |
|
すべてを表示 |
||
他を非表示 |
Shift+Cmd+H |
|
QGISを終了 |
Cmd+Q |
他のプラットフォームでは Preferences は 、 About QGIS は 、 Quit QGIS は に対応します。
3.2. パネルとツールバー
メニュー( は )でQGISのパネル() やツールバー()の オン・オフを切り替えられます。これらのいずれかを有効化(あるいは無効化)するには、メニューバーやツールバーを右クリックし、必要な項目を選択します。パネルやツールバーは、QGISインターフェース の好きな場所に移動して配置できます。このリストは、コアプラグインまたは外部プラグイン の有効化で拡張することもできます。
3.2.1. ツールバー
ツールバーはメニュー内の機能の大半にアクセスできるだけでなく、さらにマップを操作するためのツールにもアクセスできます。ツールバーの各アイテムにはポップアップヘルプがあります。アイテムの上にマウスを置くと、ツールの目的に関する簡単な説明が表示されます。
利用可能なツールバーは以下のとおりです:
ツールバーの名称 |
ツールの主な参照先 |
|---|---|
高度なデジタイズ |
|
注記 |
|
属性 |
|
データソースマネージャ |
|
Database |
|
デジタイジング |
|
GPS |
|
GRASS |
|
ヘルプ |
|
ラベル |
|
レイヤ管理 |
|
ナビゲーション |
|
メッシュデジタイジング |
|
プラグイン |
|
プロジェクト |
|
プロセシングツールボックスパネル |
|
ラスタ |
|
選択 |
|
シェープデジタイジングツールバー |
|
スナップツールバー |
|
ベクタ |
|
Web |
注釈
サードパーティーのプラグインは、デフォルトのツールバーを独自のツールで拡張したり、独自のツールバーを提供することがあります。
Tip
ツールバーの復元
誤ってツールバーを非表示にしてしまった場合には、 ( の場合は )を使ってもとに戻すことができます。何らかの要因でツールバー(またはその他のパネル)が完全に消えてしまった場合には、 GUIの初期状態の復元 に元に戻すためのヒントがあります。
3.2.2. パネル
QGISにはさまざまなパネルがあります。パネルとは、より複雑な作業(オプションの選択、ボックスのチェック、値の入力など)を実行するための特別なウィジェットです。
以下はQGISが提供するデフォルトのパネルの一覧です。
パネルの名称 |
ショートカット |
参照 |
|---|---|---|
高度なデジタイズ |
Ctrl+4 |
|
ブラウザ |
Ctrl+2 |
|
ブラウザ(2) |
||
デバッグ開発ツール |
F12 |
|
標高断面図 |
||
ジオメトリ検証 |
||
GPS情報 |
Ctrl+0 |
|
GRASSツール |
||
レイヤ順序 |
Ctrl+9 |
|
レイヤスタイル |
Ctrl+3 |
|
レイヤ |
Ctrl+1 |
|
ログメッセージ |
||
全体図 |
Ctrl+8 |
|
プロセシングツールボックス |
||
結果ビューア |
||
スナップとデジタイジングオプション |
||
空間ブックマークマネージャ |
Ctrl+7 |
|
統計量の出力 |
Ctrl+6 |
|
時系列コントローラ |
||
タイルスケール |
||
元に戻す/やり直す |
Ctrl+5 |
|
頂点エディタ |
3.3. ステータスバー
ステータスバーにはマップビューと処理済みアクションまたは使用可能なアクションに関する一般的な情報が表示され、マップビューを管理するためのツールが提供されています。
3.3.1. ロケータバー
ステータスバーの左には、クイック検索ウィジェットであるロケータバーがあり、QGISの任意の機能やオプションを検索し実行できます:
ロケータ検索バーをアクティブにするには、テキストウィジェット内をクリックするか、 Ctrl+K を押します。
探しているアイテムに関連したテキストを入力します(名前、タグ、キーワード等)。デフォルトでは、有効になっているロケータフィルタに対して検索結果が返されますが、 ロケータフィルタ の接頭辞をテキストの前に付けることで、検索を特定のスコープに限定することもできます。例えば、
l cadと入力すると、名前にcadを含むレイヤのみが返されます。このフィルタは、ロケータウィジェットにアクセスした際にメニュー内に表示されるものをダブルクリックすることでも選択できます。
検索結果をクリックすると、アイテムのタイプに応じて対応するアクションを実行します。
Tip
検索をアクティブレイヤの特定のフィールドに限定する
デフォルトでは、「アクティブレイヤの地物」フィルタ( f )による検索は、レイヤの属性テーブル全体にわたって行われます。この検索は、 @ 接頭辞を使用することで特定のフィールドに限定することができます。例えば、 f @name sal あるいは @name sal は、 "name" 属性に 'sal' という文字列を持つ地物のみを返します。テキストを書く際の自動補完が有効となり、候補は Tab キーを使用して適用することができます。
検索フィールドに関するより高度な制御は、レイヤの 属性 タブ内で行うことができます。詳細については フィールドプロパティ を参照してください。
検索はスレッドを使用して処理されるため、たとえ低速の検索フィルタがインストールされていても、常に可能な限り早く結果が得られるようになっています。また、フィルタによって検索結果が見つかると、すぐに表示されるようになっています。例えば、ファイル検索フィルタがファイルツリーをスキャンすると、結果が一つ見つかるごとに表示されます。これにより、非常に遅い検索フィルタ(オンラインサービスを使用するものなど)が存在する場合でも、UIは常に応答できるようになっています。
注釈
Nominatim ロケータツールは、OpenStreetMap Nominatim の usage policy に関連して、上記とは異なる動作をします(自動補完検索ができない、結果の取得が遅れる等)。
Tip
ロケータの設定へのクイックアクセス
ステータスバーのロケータウィジェット内の  アイコンをクリックし、使用可能なフィルタのリストを表示したら、 設定... エントリをクリックすると、 メニューの ロケータ タブが開きます。
3.3.2. アクションの報告
ロケータバーの隣には、必要に応じて実行した操作の概要(レイヤ内の地物を選択する、レイヤを削除する、パンの距離と方向)や、マウスカーソルを上に載せているツールの長い説明(すべてのツールで利用できるわけではない)が表示されます。
ラスタレイヤの統計情報の収集、プロセシングアルゴリズムの実行、マップビューでの複数レイヤのレンダリングなど時間がかかるの操作の場合には、ステータスバーにプログレスバーが表示されます。
3.3.3. マップキャンバスのコントロール
![]() 座標 オプションは、マップビューをマウスが移動している間、マウスの現在位置を追跡して表示します。座標の単位(および精度)は、 タブで設定できます。テキストボックスの左にある小さなボタンをクリックすると、座標オプションと
座標 オプションは、マップビューをマウスが移動している間、マウスの現在位置を追跡して表示します。座標の単位(および精度)は、 タブで設定できます。テキストボックスの左にある小さなボタンをクリックすると、座標オプションと  範囲 オプションが切り替わります。範囲オプションでは、現在のマップビューの左下隅と右上隅座標がマップの単位で表示されます。
座標表示の隣には 縮尺 表示があります。これはマップビューの縮尺を表します。縮尺セレクタがあり、 定義済み縮尺とカスタム縮尺 を選択できます。
縮尺表示の右側で、  ボタンを押して縮尺をロックすると、拡大レベルを使って拡大・縮小することができます。拡大レベルを使うと、地図の縮尺を変えずに地図を拡大できるので、ラベルや記号の位置を正確に微調整しやすくなります。拡大率はパーセントで表示されます。もし 拡大レベル の値が100%であれば、現在の地図は拡大されず、モニターの解像度(DPI)に対して正確な縮尺で描画されます。デフォルトの拡大率は で定義することができ、高解像度のスクリーンで小さなシンボルを拡大する際にとても便利です。さらに、 の設定は、QGISが各モニタの物理DPIを尊重するか、システム全体の論理DPIを使用するかを制御します。
拡大ツールの右側では、地図ビューの現在の時計回りの回転を度で定義できます。
ステータスバーの右側にある  レンダ チェックボックスを使うと、マップビューのレンダリングを一時的に停止することができます(セクション 地図のレンダリングの制御 を参照)。
レンダ 機能の右側には、現在のプロジェクトCRSを示す  EPSG:code ボタンがあります。これをクリックすると プロジェクトのプロパティ ダイアログが開き、マップビューの再投影やその他のプロジェクトのプロパティを調整することができます。
Tip
地図キャンバスにおける正しい縮尺を計算する
QGIS を起動した際のデフォルトの CRS は WGS 84 (EPSG 4326) で、単位は度です。これは、QGISはレイヤ内のあらゆる座標が度単位で指定されているものと解釈することを意味します。正しい縮尺値を得るには、 の 一般 タブで単位の設定を手動で変更する(例:メートル)か、上で述べた EPSG:code アイコンを使います。後者の場合、単位はプロジェクトの投影法で指定されたものに設定されます(例: +units=us-ft )
なお、起動時のCRSの選択は で設定することができます。
3.3.4. メッセージ
その横にある  メッセージ ボタンをクリックすると、 ログメッセージパネル が開きます。ここには基本的なプロセス(QGISの起動、プラグインのロード、プロセシングツールなど)に関する情報があります。