23.3. The Toolbox
The Processing Toolbox is the main element of the processing GUI, and the one that you are more likely to use in your daily work. It shows the list of all available algorithms grouped in different blocks called Providers, and custom models and scripts you can add to extend the set of tools. Hence the toolbox is the access point to run them, whether as a single process or as a batch process involving several executions of the same algorithm on different sets of inputs.
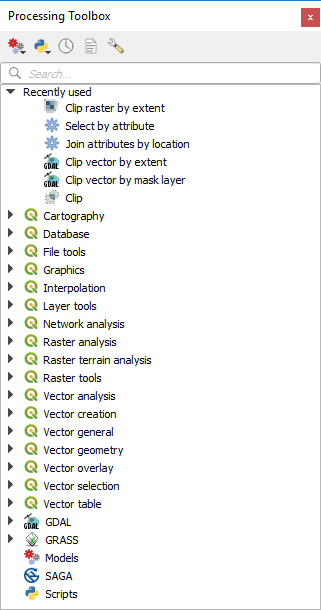
Abb. 23.6 Verarbeitungswerkzeuge
Providers can be (de)activated in the Processing settings dialog. By default, only providers that do not rely on third-party applications (that is, those that only require QGIS elements to be run) are active. Algorithms requiring external applications might need additional configuration. Configuring providers is explained in a later chapter in this manual.
In the upper part of the toolbox dialog, you will find a set of tools to:
work with
 Models: Create New Model…,
Open Existing Model… and Add Model to Toolbox…;
Models: Create New Model…,
Open Existing Model… and Add Model to Toolbox…;work with
 Scripts: Create New Script…,
Create New Script from Template…, Open Existing
Script… and Add Script to Toolbox…;
Scripts: Create New Script…,
Create New Script from Template…, Open Existing
Script… and Add Script to Toolbox…;open the
 History panel;
open the
 Results Viewer panel;
toggle the toolbox to the in-place modification mode using the
 Edit Features In-Place button: only
the algorithms that are suitable to be executed on the active layer without
outputting a new layer are displayed;
Edit Features In-Place button: only
the algorithms that are suitable to be executed on the active layer without
outputting a new layer are displayed;open the
 Options dialog.
Below this toolbar is a  Search… box to help you easily find
the tools you need.
You can enter any word or phrase on the text box. Notice that, as you type, the
number of algorithms, models or scripts in the toolbox is reduced to just those
that contain the text you have entered in their names or keywords.
Search… box to help you easily find
the tools you need.
You can enter any word or phrase on the text box. Notice that, as you type, the
number of algorithms, models or scripts in the toolbox is reduced to just those
that contain the text you have entered in their names or keywords.
Bemerkung
At the top of the list of algorithms are displayed the most recent used tools; handy if you want to reexecute any.
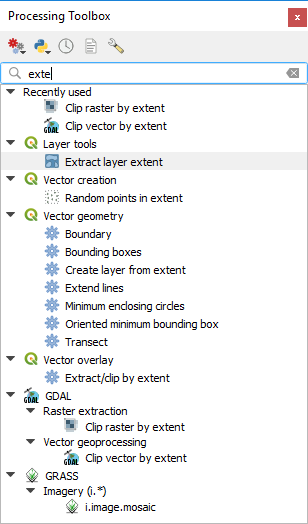
Abb. 23.7 Die Verarbeitungswerkzeuge zeigen Suchergebnisse
To execute a tool, just double-click on its name in the toolbox.
23.3.1. Der Algorithmus Dialog
Once you double-click on the name of the algorithm that you want to execute, a
dialog similar to that in the Abb. 23.8 below is shown
(in this case, the dialog corresponds to the Centroids algorithm).
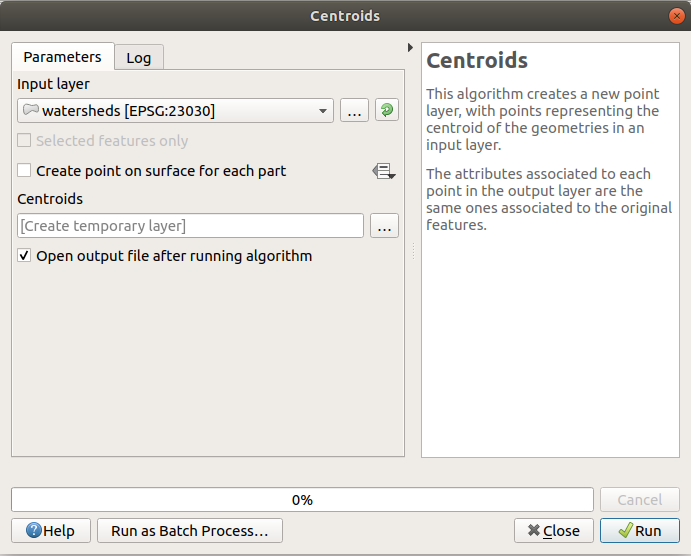
Abb. 23.8 Algorithm Dialog - Parameters
The dialog shows two tabs (Parameters and Log) on the left part, the algorithm description on the right, and a set of buttons at the bottom.
The Parameters tab is used to set the input values that the algorithm needs to be executed. It shows a list of input values and configuration parameters to be set. It of course has a different content, depending on the requirements of the algorithm to be executed, and is created automatically based on those requirements.
Obwohl die Anzahl und Art der Parameter von den Eigenschaften des Algorithmus abhängt, ist die Struktur für alle ähnlich. Die Parameter die Sie in der Tabelle finden können können folgende Typen sein.
A raster layer, to select from a list of all such layers available (currently opened) in QGIS. The selector contains as well a button on its right-hand side, to let you select filenames that represent layers currently not loaded in QGIS.
A vector layer, to select from a list of all vector layers available in QGIS. Layers not loaded in QGIS can be selected as well, as in the case of raster layers, but only if the algorithm does not require a table field selected from the attributes table of the layer. In that case, only opened layers can be selected, since they need to be open so as to retrieve the list of field names available.
You will see an iterator button by each vector layer selector, as shown in the figure below.

Abb. 23.9 Vektor Interator Knopf
Wenn der Algorithmus mehrere davon enthält können Sie auch nur einen von Ihnen umschalten. Wenn der zu einer Vektoreingabe gehörende Knopf umgeschaltet ist wird der Algorithmus iterativ mit jedem seiner Objekte ausgeführt anstatt nur einmal für den ganzen Layer und erstellt so viele Ausgaben wie der Algorithmus ausgeführt wurde. Dies ermöglicht es den Ablauf zu automatisieren wenn alle Objekte in einem Layer separat verarbeitet werden müssen.
Bemerkung
By default, the parameters dialog will show a description of the CRS of each layer along with its name. If you do not want to see this additional information, you can disable this functionality in the Processing Settings dialog, unchecking the option.
A table, to select from a list of all available in QGIS. Non-spatial tables are loaded into QGIS like vector layers, and in fact they are treated as such by the program. Currently, the list of available tables that you will see when executing an algorithm that needs one of them is restricted to tables coming from files in dBase (
.dbf) or Comma-Separated Values (.csv) formats.An option, to choose from a selection list of possible options.
A numerical value, to be introduced in a spin box. In some contexts (when the parameter applies at the feature level and not at the layer’s), you will find a
 Data-defined override button by its side, allowing
you to open the expression builder and enter a
mathematical expression to generate variable values for the parameter. Some useful
variables related to data loaded into QGIS can be added to your expression, so
you can select a value derived from any of these variables, such as the cell size
of a layer or the northernmost coordinate of another one.
Data-defined override button by its side, allowing
you to open the expression builder and enter a
mathematical expression to generate variable values for the parameter. Some useful
variables related to data loaded into QGIS can be added to your expression, so
you can select a value derived from any of these variables, such as the cell size
of a layer or the northernmost coordinate of another one.
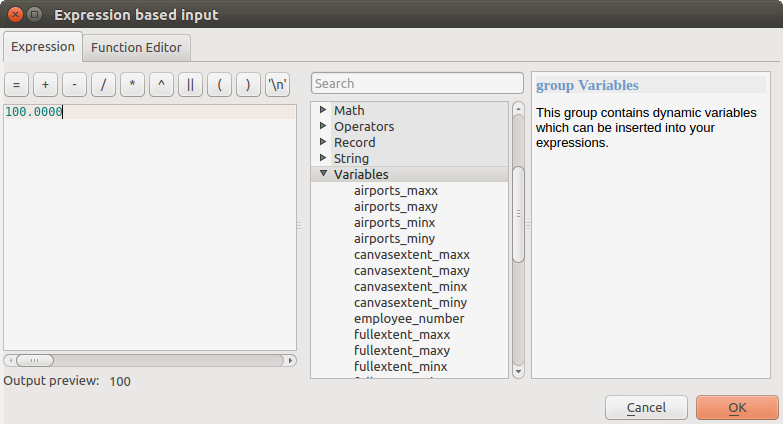
Abb. 23.10 Expression based input
A range, with min and max values to be introduced in two text boxes.
A text string, to be introduced in a text box.
A field, to choose from the attributes table of a vector layer or a single table selected in another parameter.
A coordinate reference system. You can select it among the recently used ones from the drop-down list or from the CRS selection dialog that appears when you click on the button on the right-hand side.
An extent, a text box defining a rectangle through its corners coordinate in the format
xmin, xmax, ymin, ymax. Clicking on the button on the right-hand side of the value selector, a pop-up menu will appear, giving you options to:Calculate from layer: fills the text box with the coordinates of the bounding box of a layer to select among the loaded ones
Use map canvas extent
Draw on canvas: the parameters window will hide itself, so you can click and drag onto the canvas. Once you have defined the extent rectangle, the dialog will reappear, containing the values in the extent text box.
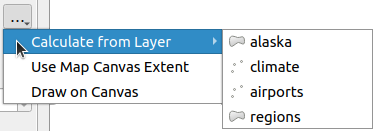
Abb. 23.11 Ausdehnung Auswahl
A list of elements (whether raster or vector layers, tables, fields) to select from. Click on the … button at the left of the option to see a dialog like the following one. Multiple selection is allowed and when the dialog is closed, number of selected items is displayed in the parameter text box widget.
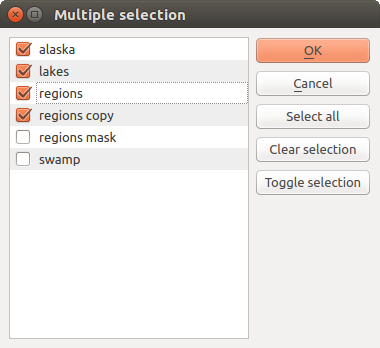
Abb. 23.12 Mehrfachauswahl
A small table to be edited by the user. These are used to define parameters like lookup tables or convolution kernels, among others.
Klicken Sie auf den Knopf auf der rechten Seite, um die Tabelle zu sehen und zu editieren.
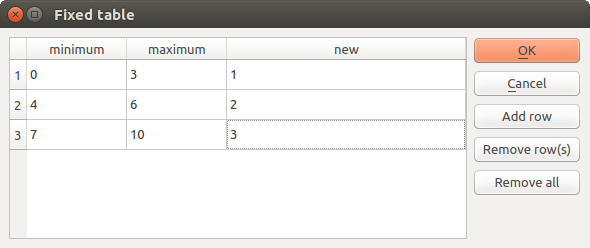
Abb. 23.13 Fixe Tabelle
In Abhängigkeit vom Algorithmus kann die Anzahl der Zeilen verändert werden oder auch nicht, indem Sie auf den Knopf rechts neben dem Fenster klicken.
Bemerkung
Some algorithms require many parameters to run, e.g. in the
Raster calculator you have to specify manually the cell size, the
extent and the CRS. You can avoid to choose all the parameters manually when
the algorithm has the Reference layers parameter. With this parameter you
can choose the reference layer and all its properties (cell size, extent, CRS)
will be used.
Along with the Parameters tab, there is another tab named Log (see Abb. 23.14 below). Information provided by the algorithm during its execution is written in this tab, and allow you to track the execution and be aware and have more details about the algorithm as it runs. Information on algorithm execution is also output in the .
Notice that not all algorithms write information to the Log tab, and many of them might run silently without producing any output other than the final files. Check the Log Messages Panel in that case.
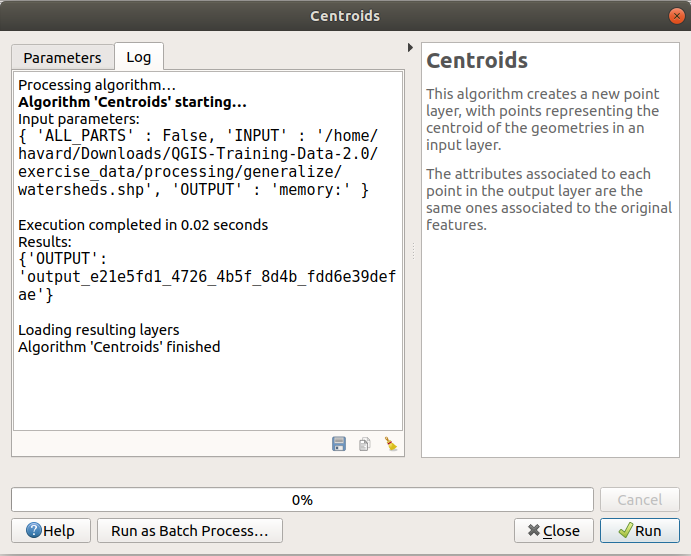
Abb. 23.14 Algorithm Dialog - Log
At the bottom of the Log tab you will find buttons to
 Save Log to File,
  Copy
Log to Clipboard and
Copy
Log to Clipboard and  Clear Log.
These are particularly handy when you have checked the
Keep dialog open after running algorithm in the
General part of the Processing options.
Clear Log.
These are particularly handy when you have checked the
Keep dialog open after running algorithm in the
General part of the Processing options.
On the right hand side of the dialog you will find a short description of the algorithm, which will help you understand its purpose and its basic ideas. If such a description is not available, the description panel will not be shown.
For a more detailed help file, which might include description of every parameter it uses, or examples, you will find a Help button at the bottom of the dialog bringing you to the Processing algorithms documentation or to the provider documentation (for some third-party providers).
The Run as batch process button triggers the batch processing mode allowing to configure and run multiple instances of the algorithm with a variety of parameters.
23.3.1.1. Bemerkung zum Thema Projektionen
Processing algorithm execution are always performed in the input layer coordinate reference system (CRS). Due to QGIS’s on-the-fly reprojecting capabilities, although two layers might seem to overlap and match, that might not be true if their original coordinates are used without reprojecting them onto a common coordinate system. Whenever you use more than one layer as input to a QGIS native algorithm, whether vector or raster, the layers will all be reprojected to match the coordinate reference system of the first input layer.
This is however less true for most of the external applications whose algorithms are exposed through the processing framework as they assume that all of the layers are already in a common coordinate system and ready to be analyzed.
By default, the parameters dialog will show a description of the CRS of each layer along with its name, making it easy to select layers that share the same CRS to be used as input layers. If you do not want to see this additional information, you can disable this functionality in the Processing settings dialog, unchecking the Show layer CRS definition in selection boxes option.
If you try to execute an algorithm using as input two or more layers with unmatching CRSs, a warning dialog will be shown. This occurs thanks to the Warn before executing if layer CRS’s do not match option.
Sie können den Algorithmus immer noch ausführen, seien Sie sich aber dessen bewusst dass dies in den meisten Fällen zu falschen Ergebnissen führt, so z.B. leere Layer aufgrunddessen dass Eingabelayer nicht überlappen.
Tipp
Use Processing algorithms to do intermediate reprojection
When an algorithm can not successfully perform on multiple input layers due to unmatching CRSs, use QGIS internal algorithm such as Reproject layer to perform layers‘ reprojection to the same CRS before executing the algorithm using these outputs.
23.3.2. Von Algorithmen erstellte Datenobjekte
Von Algorithmen erstellte Datenobjekte können jeder der folgenden Typen sein:
Rasterlayer
Vektorlayer
Tabelle
HTML-Datei (wird für Text und grafische Ausgabe verwendet)
These are all saved to disk, and the parameters table will contain a text box corresponding to each one of these outputs, where you can type the output channel to use for saving it. An output channel contains the information needed to save the resulting object somewhere. In the most usual case, you will save it to a file, but in the case of vector layers, and when they are generated by native algorithms (algorithms not using external applications) you can also save to a PostGIS, GeoPackage or SpatiaLite database, or a memory layer.
Um einen Ausgabekanal auszuwählen, klicken Sie einfach auf den Knopf auf der rechten Seite des Textfelds und Sie werden ein kleines Kontextmenü mit den verfügbaren Optionen sehen.
Im häufigsten Fall werden Sie Speichern in einer Datei auswählen. Wenn Sie diese Option auswählen, werden Sie in einem Datei speichern Dialog aufgefordert werden, den gewünschten Dateipfad auszuwählen. Unterstützte Dateierweiterungen werden in der Dateiformatauswahl des Dialogs gezeigt, abhängig von der Art der Ausgabe und des Algorithmus.
The format of the output is defined by the filename extension. The supported
formats depend on what is supported by the algorithm itself. To select a format,
just select the corresponding file extension (or add it, if you are directly typing
the file path instead). If the extension of the file path you entered does not
match any of the supported formats, a default extension will be
appended to the file path, and the file format corresponding to that extension will
be used to save the layer or table. Default extensions are .dbf for
tables, .tif for raster layers and .gpkg for vector layers. These
can be modified in the setting dialog, selecting any other of the formats supported
by QGIS.
If you do not enter any filename in the output text box (or select the corresponding option in the context menu), the result will be saved as a temporary file in the corresponding default file format, and it will be deleted once you exit QGIS (take care with that, in case you save your project and it contains temporary layers).
You can set a default folder for output data objects. Go to the settings
dialog (you can open it from the
menu), and in the
General group, you will find a parameter named Output folder.
This output folder is used as the default path in case you type just a filename
with no path (i.e., myfile.shp) when executing an algorithm.
Wenn Sie einen Algorithmus ausführen, der einen Vektorlayer im iterativen Modus verwendet, wird der eingegebene Dateipfad als Basispfad für alle erstellten Dateien, die mit Hilfe des Basisnamens benannt werden und an die eine Nummer, die den Index der Iteration darstellt, angehängt wird, verwendet. Die Dateierweiterung (und das Format) wird für alle so erstellten Dateien benutzt.
Apart from raster layers and tables, algorithms also generate graphics and text as HTML files. These results are shown at the end of the algorithm execution in a new dialog. This dialog will keep the results produced by any algorithm during the current session, and can be shown at any time by selecting from the QGIS main menu.
Einige externe Anwendungen können Dateien (ohne besondere Einschränkungen bei der Dateinamen-Erweiterung haben) als Ausgabe erzeugen, die nicht zu einer der oben genannten Kategorien gehören. Diese Ausgabedateien werden nicht von QGIS verarbeitet (weder geöffnet noch in das aktuelle QGIS-Projekt integriert), da diese meistens nicht von QGIS unterstützt werden. Dies ist beispielsweise der Fall beim LAS-Format für LIDAR-Daten. Die Dateien werden erstellt, aber Sie werden nicht in QGIS angezeigt.
Für alle anderen Arten von Ausgaben finden Sie ein Kontrollkästchen, mit dem sie festlegen können, ob die Datei in |qg| geladen werden soll oder nicht, wenn sie durch den Algorithmus erzeugt wurde. Standardmäßig werden alle Dateien angezeigt.
Optionale Ausgaben werden nicht unterstützt, alle Ausgaben werden erstellt, aber Sie können über das entsprechende Kontrollkästchen definieren, wenn Sie an einer bestimmten Ausgabe nicht interessiert sind, was es im Wesentlichen zu einer Optionale Ausgabe macht (Der Layer wird zwar erstellt, aber nur temporär im Hintergrund, wenn Sie das Textfeld leer lassen, und wieder gelöscht, sobald Sie QGIS verlassen).