` `
The toolbox
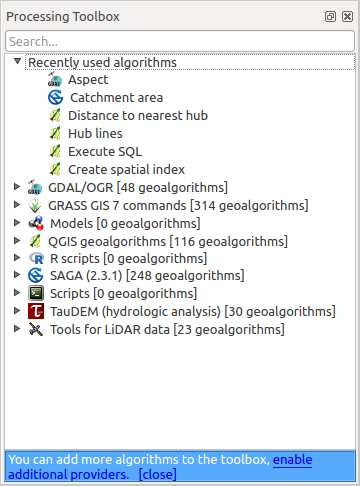
The Toolbox is the main element of the processing GUI, and the one that you are more likely to use in your daily work. It shows the list of all available algorithms grouped in different blocks, and it is the access point to run them, whether as a single process or as a batch process involving several executions of the same algorithm on different sets of inputs.
Verarbeitungswerkzeuge
The toolbox contains all the available algorithms, divided into so-called “Providers”.
Providers can be (de)activated in the settings dialog. A label in the bottom part of the toolbox will remind you of that whenever there are inactive providers. Use the link in the label to open the settings window and set up providers. We will discuss the settings dialog later in this manual.
By default, only providers that do not rely on third-party applications (that is, those that only require QGIS elements to be run) are active. Algorithms requiring external applications might need additional configuration. Configuring providers is explained in a later chapter in this manual.
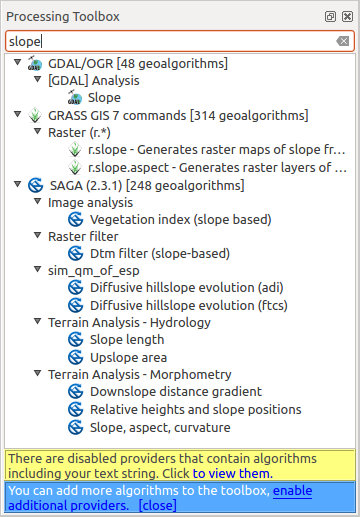
In the upper part of the toolbox, you will find a text box. To reduce the number of algorithms shown in the toolbox and make it easier to find the one you need, you can enter any word or phrase on the text box. Notice that, as you type, the number of algorithms in the toolbox is reduced to just those that contain the text you have entered in their names.
If there are algorithms that match your search but belong to a provider that is not active, an additional label will be shown in the lower part of the toolbox.
Die Verarbeitungswerkzeuge zeigen Suchergebnisse
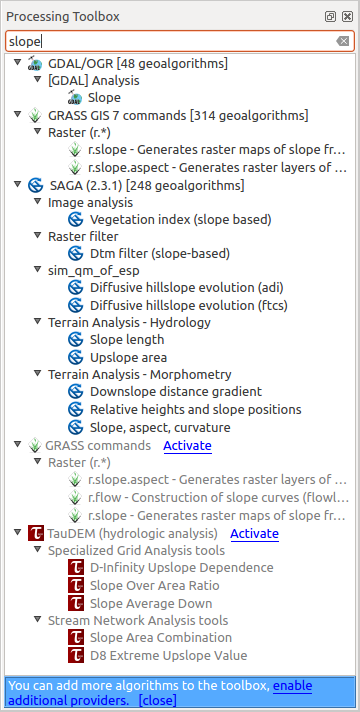
If you click on the link in that label, the list of algorithms will also include those from inactive providers, which will be shown in light gray. A link to active each inactive provider is also shown.
Die Verarbeitungswerkzeuge zeigen Suchergebnisse
To execute an algorithm, just double-click on its name in the toolbox.
Der Algorithmus Dialog
Once you double-click on the name of the algorithm that you want to execute, a dialog similar to that in the figure below is shown (in this case, the dialog corresponds to the ‘Polygon centroids’ algorithm).
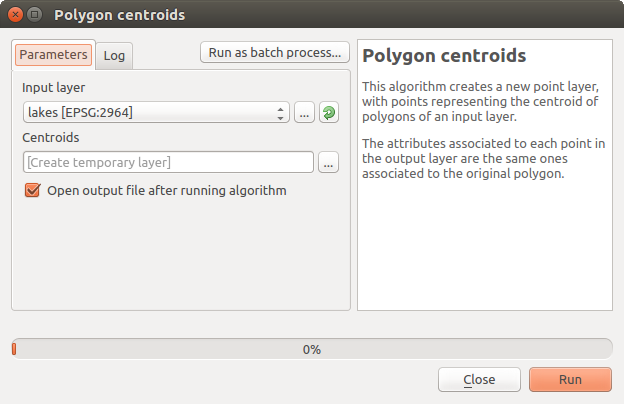
Dialog Parameter
Dieser Dialog wird verwendet, um die Eingangs-Werte anzugeben, damit der Algorithmus ausgeführt werden kann. Er zeigt eine Tabelle, in der Eingangswerte und Konfigurationsparameter zu setzen sind. Der Inhalt des Dialogs steht in Abhängigkeit vom Algorithmus, der ausgeführt werden soll, und wird automatisch auf Basis der Anforderungen erstellt.
Obwohl die Anzahl und Art der Parameter von den Eigenschaften des Algorithmus abhängt, ist die Struktur für alle ähnlich. Die Parameter die Sie in der Tabelle finden können können folgende Typen sein.
A raster layer, to select from a list of all such layers available (currently opened) in QGIS. The selector contains as well a button on its right-hand side, to let you select filenames that represent layers currently not loaded in QGIS.
A vector layer, to select from a list of all vector layers available in QGIS. Layers not loaded in QGIS can be selected as well, as in the case of raster layers, but only if the algorithm does not require a table field selected from the attributes table of the layer. In that case, only opened layers can be selected, since they need to be open so as to retrieve the list of field names available.
You will see an iterator button by each vector layer selector, as shown in the figure below.
Vektor Interator Knopf
Wenn der Algorithmus mehrere davon enthält können Sie auch nur einen von Ihnen umschalten. Wenn der zu einer Vektoreingabe gehörende Knopf umgeschaltet ist wird der Algorithmus iterativ mit jedem seiner Objekte ausgeführt anstatt nur einmal für den ganzen Layer und erstellt so viele Ausgaben wie der Algorithmus ausgeführt wurde. Dies ermöglicht es den Ablauf zu automatisieren wenn alle Objekte in einem Layer separat verarbeitet werden müssen.
A table, to select from a list of all available in QGIS. Non-spatial tables are loaded into QGIS like vector layers, and in fact they are treated as such by the program. Currently, the list of available tables that you will see when executing an algorithm that needs one of them is restricted to tables coming from files in dBase (.dbf) or Comma-Separated Values (.csv) formats.
An option, to choose from a selection list of possible options.
A numerical value, to be introduced in a spin box. You will find a button by its side. Clicking on it, you will open the expression builder that allows you to enter a mathematical expression, so you can use it as a handy calculator. Some useful variables related to data loaded into QGIS can be added to your expression, so you can select a value derived from any of these variables, such as the cell size of a layer or the northernmost coordinate of another one.
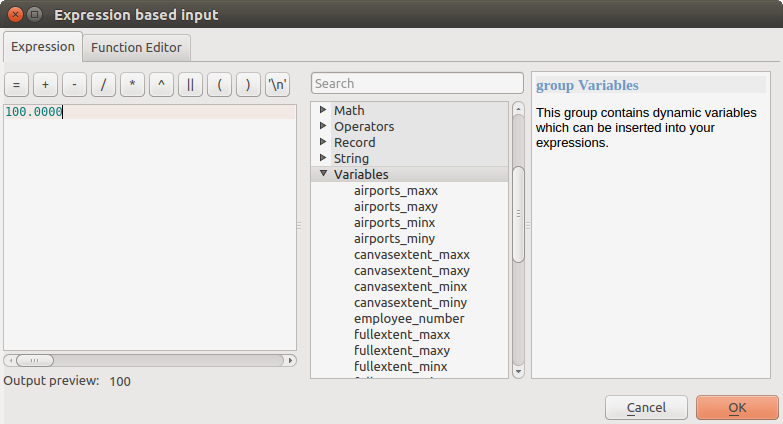
Expression based input
A range, with min and max values to be introduced in two text boxes.
A text string, to be introduced in a text box.
A field, to choose from the attributes table of a vector layer or a single table selected in another parameter.
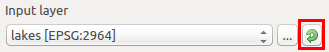
A coordinate reference system. You can type the EPSG code directly in the text box, or select it from the CRS selection dialog that appears when you click on the button on the right-hand side.
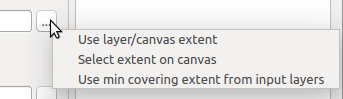
An extent, to be entered by four numbers representing its xmin, xmax, ymin, ymax limits. Clicking on the button on the right-hand side of the value selector, a pop-up menu will appear, giving you three options:
- to select the value from a layer or the current canvas extent,
- to define it by dragging directly onto the map canvas, or
- to use the minimum coverage from all input layers.
Ausdehnung Auswahl
Wenn Sie die erste Option wählen, sehen Sie einen Dialog wie den nächsten.
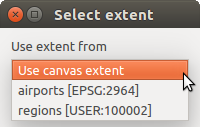
Ausdehnung Liste
Wenn Sie den zweiten wählen, wird das Parameter-Fenster verschwinden, damit Sie durch Klicken und Ziehen im Kartenfenster einen Bereich definieren können. Wenn das Rechteck definiert ist, wird der Dialog mit den Werten wieder auftauchen.
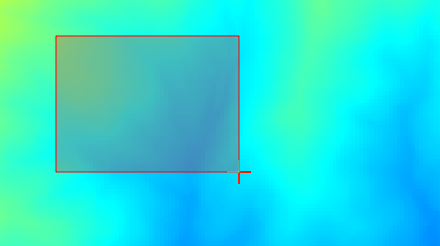
Ausdehnung aufziehen
A list of elements (whether raster layers, vector layers or tables), to select from the list of such layers available in QGIS. To make the selection, click on the small button on the left side of the corresponding row to see a dialog like the following one.
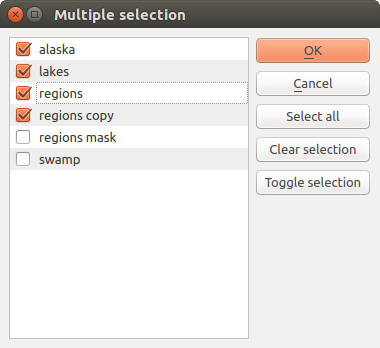
Mehrfachauswahl
A small table to be edited by the user. These are used to define parameters like lookup tables or convolution kernels, among others.
Klicken Sie auf den Knopf auf der rechten Seite, um die Tabelle zu sehen und zu editieren.
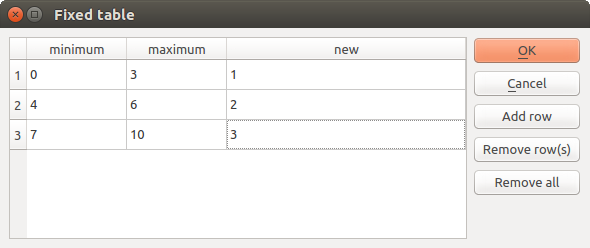
Fixe Tabelle
In Abhängigkeit vom Algorithmus kann die Anzahl der Zeilen verändert werden oder auch nicht, indem Sie auf den Knopf rechts neben dem Fenster klicken.
Along with the Parameters tab, you will find another tab named Log. Information provided by the algorithm during its execution is written in this tab, and allow you to track the execution and be aware and have more details about the algorithm as it runs. Notice that not all algorithms write information to this tab, and many of them might run silently without producing any output other than the final files.
Auf der rechten Seite des Dialogs finden Sie eine kurze Beschreibung des Algorithmus, welche Ihnen helfen den Zweck und die grundlegende Idee zu verstehen. Wenn eine solche Beschreibung nicht verfügbar ist, wird die Beschreibung nicht gezeigt werden.
Some algorithms might have a more detailed help file, which might include description of every parameter it uses, or examples. In that case, you will find a Help tab in the parameters dialog.
Bemerkung zum Thema Projektionen
Algorithms that are run from the processing framework — this is also true for most of the external applications whose algorithms are exposed through it — do not perform any reprojection on input layers and assume that all of them are already in a common coordinate system and ready to be analyzed. Whenever you use more than one layer as input to an algorithm, whether vector or raster, it is up to you to make sure that they are all in the same coordinate system.
Note that, due to QGIS’s on-the-fly reprojecting capabilities, although two layers might seem to overlap and match, that might not be true if their original coordinates are used without reprojecting them onto a common coordinate system. That reprojection should be done manually, and then the resulting files should be used as input to the algorithm. Also, note that the reprojection process can be performed with the algorithms that are available in the processing framework itself.
By default, the parameters dialog will show a description of the CRS of each layer along with its name, making it easy to select layers that share the same CRS to be used as input layers. If you do not want to see this additional information, you can disable this functionality in the Processing settings dialog, unchecking the Show CRS option.
If you try to execute an algorithm using as input two or more layers with unmatching CRSs, a warning dialog will be shown.
Sie können den Algorithmus immer noch ausführen, seien Sie sich aber dessen bewusst dass dies in den meisten Fällen zu falschen Ergebnissen führt, so z.B. leere Layer aufgrunddessen dass Eingabelayer nicht überlappen.
Von Algorithmen erstellte Datenobjekte
Von Algorithmen erstellte Datenobjekte können jeder der folgenden Typen sein:
Rasterlayer
Vektorlayer
Tabelle
HTML-Datei (wird für Text und grafische Ausgabe verwendet)
These are all saved to disk, and the parameters table will contain a text box corresponding to each one of these outputs, where you can type the output channel to use for saving it. An output channel contains the information needed to save the resulting object somewhere. In the most usual case, you will save it to a file, but in the case of vector layers, and when they are generated by native algorithms (algorithms not using external applications) you can also save to a PostGIS or Spatialite database, or a memory layer.
Um einen Ausgabekanal auszuwählen, klicken Sie einfach auf den Knopf auf der rechten Seite des Textfelds und Sie werden ein kleines Kontextmenü mit den verfügbaren Optionen sehen.
Im häufigsten Fall werden Sie Speichern in einer Datei auswählen. Wenn Sie diese Option auswählen, werden Sie in einem Datei speichern Dialog aufgefordert werden, den gewünschten Dateipfad auszuwählen. Unterstützte Dateierweiterungen werden in der Dateiformatauswahl des Dialogs gezeigt, abhängig von der Art der Ausgabe und des Algorithmus.
The format of the output is defined by the filename extension. The supported formats depend on what is supported by the algorithm itself. To select a format, just select the corresponding file extension (or add it, if you are directly typing the file path instead). If the extension of the file path you entered does not match any of the supported formats, a default extension will be appended to the file path, and the file format corresponding to that extension will be used to save the layer or table. Default extensions are .dbf for tables, .tif for raster layers and .shp for vector layers. These can be modified in the setting dialog, selecting any other of the formats supported by QGIS.
If you do not enter any filename in the output text box (or select the corresponding option in the context menu), the result will be saved as a temporary file in the corresponding default file format, and it will be deleted once you exit QGIS (take care with that, in case you save your project and it contains temporary layers).
You can set a default folder for output data objects. Go to the settings dialog (you can open it from the Processing menu), and in the General group, you will find a parameter named Output folder. This output folder is used as the default path in case you type just a filename with no path (i.e., myfile.shp) when executing an algorithm.
Wenn Sie einen Algorithmus ausführen, der einen Vektorlayer im iterativen Modus verwendet, wird der eingegebene Dateipfad als Basispfad für alle erstellten Dateien, die mit Hilfe des Basisnamens benannt werden und an die eine Nummer, die den Index der Iteration darstellt, angehängt wird, verwendet. Die Dateierweiterung (und das Format) wird für alle so erstellten Dateien benutzt.
Apart from raster layers and tables, algorithms also generate graphics and text as HTML files. These results are shown at the end of the algorithm execution in a new dialog. This dialog will keep the results produced by any algorithm during the current session, and can be shown at any time by selecting Processing ‣ Results viewer from the QGIS main menu.
Einige externe Anwendungen können Dateien (ohne besondere Einschränkungen bei der Dateinamen-Erweiterung haben) als Ausgabe erzeugen, die nicht zu einer der oben genannten Kategorien gehören. Diese Ausgabedateien werden nicht von QGIS verarbeitet (weder geöffnet noch in das aktuelle QGIS-Projekt integriert), da diese meistens nicht von QGIS unterstützt werden. Dies ist beispielsweise der Fall beim LAS-Format für LIDAR-Daten. Die Dateien werden erstellt, aber Sie werden nicht in QGIS angezeigt.
Für alle anderen Arten von Ausgaben finden Sie ein Kontrollkästchen, mit dem sie festlegen können, ob die Datei in QGIS geladen werden soll oder nicht, wenn sie durch den Algorithmus erzeugt wurde. Standardmäßig werden alle Dateien angezeigt.
Optionale Ausgaben werden nicht unterstützt, alle Ausgaben werden erstellt, aber Sie können über das entsprechende Kontrollkästchen definieren, wenn Sie an einer bestimmten Ausgabe nicht interessiert sind, was es im Wesentlichen zu einer Optionale Ausgabe macht (Der Layer wird zwar erstellt, aber nur temporär im Hintergrund, wenn Sie das Textfeld leer lassen, und wieder gelöscht, sobald Sie QGIS verlassen).
Configuring the processing framework
As has been mentioned, the configuration menu gives access to a new dialog where you can configure how algorithms work. Configuration parameters are structured in separate blocks that you can select on the left-hand side of the dialog.
Along with the aforementioned Output folder entry, the General block contains parameters for setting the default rendering style for output layers (that is, layers generated by using algorithms from any of the framework GUI components). Just create the style you want using QGIS, save it to a file, and then enter the path to that file in the settings so the algorithms can use it. Whenever a layer is loaded by Processing and added to the QGIS canvas, it will be rendered with that style.
Rendering styles can be configured individually for each algorithm and each one of its outputs. Just right-click on the name of the algorithm in the toolbox and select Edit rendering styles for outputs. You will see a dialog like the one shown next.
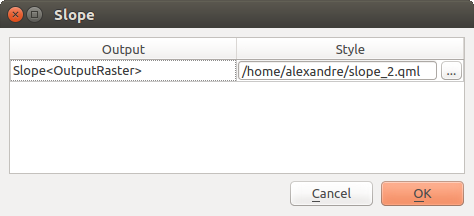
Rendering Styles
Select the style file (.qml) that you want for each output and press [OK].
Other configuration parameters in the General group are listed below:
- Use filename as layer name. The name of each resulting layer created by an algorithm is defined by the algorithm itself. In some cases, a fixed name might be used, meaning that the same output name will be used, no matter which input layer is used. In other cases, the name might depend on the name of the input layer or some of the parameters used to run the algorithm. If this checkbox is checked, the name will be taken from the output filename instead. Notice that, if the output is saved to a temporary file, the filename of this temporary file is usually a long and meaningless one intended to avoid collision with other already existing filenames.
- Keep dialog open after running algorithm. Once an algorithm has finished execution and its output layers are loaded into the QGIS project, the algorithm dialog is closed. If you want to keep it open (to run the algorithm again with different parameters, or to better check the output that is written to the log tab), check this option
- Use only selected features. If this option is selected, whenever a vector layer is used as input for an algorithm, only its selected features will be used. If the layer has no selected features, all features will be used.
- Pre-execution script file and Post-execution script file. These parameters refer to scripts written using the processing scripting functionality, and are explained in the section covering scripting and the console.
Apart from the General block in the settings dialog, you will also find a block for algorithm providers. Each entry in this block contains an Activate item that you can use to make algorithms appear or not in the toolbox. Also, some algorithm providers have their own configuration items, which we will explain later when covering particular algorithm providers.