2. Introducing GIS
|
Objectives: |
Understanding what GIS is and what it can be used for. |
Keywords: |
GIS, Computer, Maps, Data, Information System, Spatial, Analysis |
2.1. Overview
Just as we use a word processor to write documents and deal with words on a computer, we can use a GIS application to deal with spatial information on a computer. GIS stands for ‘Geographical Information System’.
A GIS consists of:
Digital Data — the geographical information that you will view and analyse using computer hardware and software.
Computer Hardware — computers used for storing data, displaying graphics and processing data.
Computer Software — computer programs that run on the computer hardware and allow you to work with digital data. A software program that forms part of the GIS is called a GIS Application.
With a GIS application you can open digital maps on your computer, create new spatial information to add to a map, create printed maps customised to your needs and perform spatial analysis.
Let’s look at a little example of how GIS can be useful. Imagine you are a health worker and you make a note of the date and place of residence of every patient you treat.
Longitude |
Latitude |
Disease |
Date |
|---|---|---|---|
26.870436 |
-31.909519 |
Mumps |
13/12/2008 |
26.868682 |
-31.909259 |
Mumps |
24/12/2008 |
26.867707 |
-31.910494 |
Mumps |
22/01/2009 |
26.854908 |
-31.920759 |
Measles |
11/01/2009 |
26.855817 |
-31.921929 |
Measles |
26/01/2009 |
26.852764 |
-31.921929 |
Measles |
10/02/2009 |
26.854778 |
-31.925112 |
Measles |
22/02/2009 |
26.869072 |
-31.911988 |
Mumps |
02/02/2009 |
26.863354 |
-31.916406 |
Chicken Pox |
26/02/2009 |
If you look at the table above you will quickly see that there were a lot of measles cases in January and February. Our health worker recorded the location of each patient’s house by noting its latitude and longitude in the table. Using this data in a GIS Application, we can quickly understand a lot more about the patterns of illness:
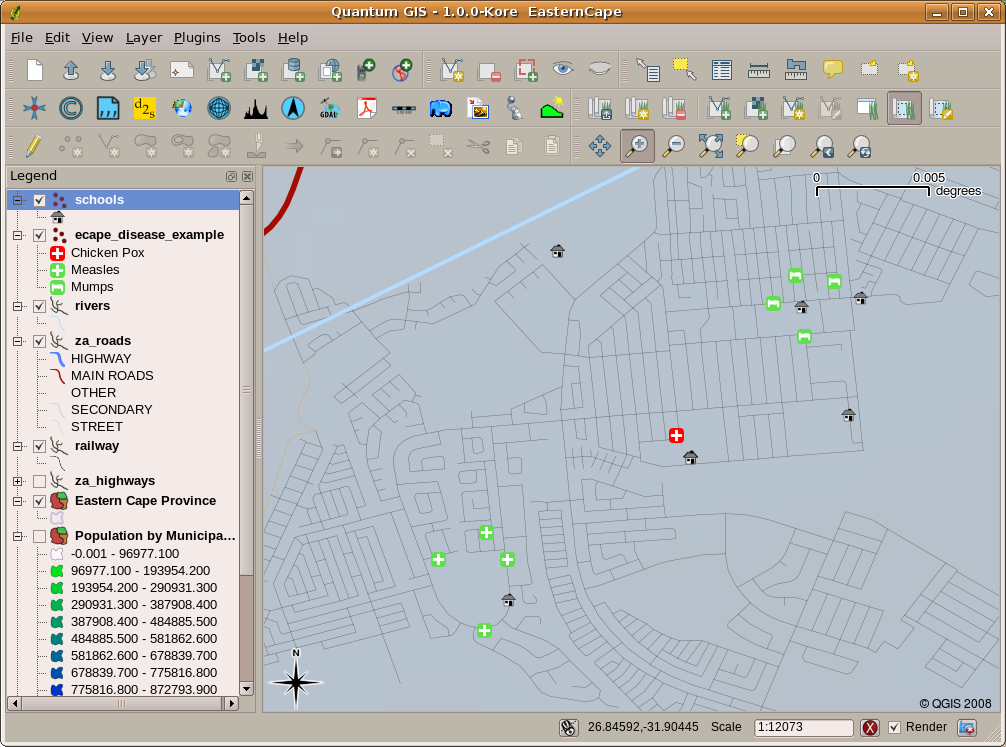
Fig. 2.12 Example showing disease records in a GIS application. It is easy to see that the mumps patients all live close to each other.
2.2. More about GIS
GIS is a relatively new field — it started in the 1970’s. It used to be that computerised GIS was only available to companies and universities that had expensive computer equipment. These days, anyone with a personal computer or laptop can use GIS software. Over time GIS Applications have also become easier to use — it used to require a lot of training to use a GIS Application, but now it is much easier to get started in GIS even for amateurs and casual users. As we described above, GIS is more than just software, it refers to all aspects of managing and using digital geographical data. In the tutorials that follow we will be focusing on GIS Software.
2.3. What is GIS Software / a GIS Application?
You can see an example of what a GIS Application looks like in Fig. 2.12. GIS Applications are normally programs with a graphical user interface that can be manipulated using the mouse and keyboard. The application provides menus near to the top of the window (Project, Edit, etc.) which, when clicked using the mouse, show a panel of actions. These actions provide a way for you to tell the GIS Application what you want to do. For example you may use the menus to tell the GIS Application to add a new layer to the display output, as in Fig. 2.13.
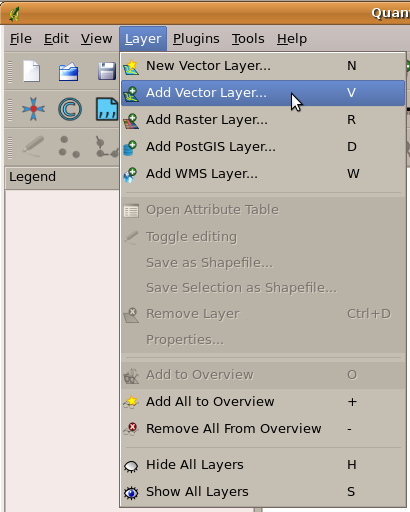
Fig. 2.13 Application menus, when clicked with the mouse, expand to show a list of actions that can be carried out.
As seen in Fig. 2.14, toolbars (rows of small pictures that can be clicked with the mouse) normally sit just below the menus and provide a quicker way to use frequently needed actions.
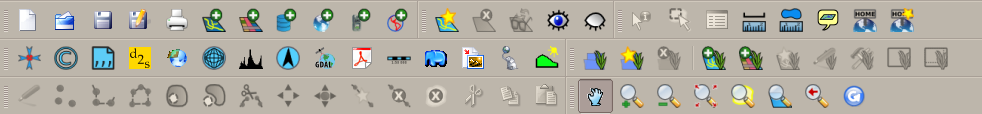
Fig. 2.14 Toolbars provide quick access to commonly used functions. Holding your mouse over a picture will usually tell you what will happen when you click on it.
A common function of GIS Applications is to display map layers. Map layers are stored as files on a disk or as records in a database. Normally each map layer will represent something in the real world — a roads layer for example will have data about the street network.
When you open a layer in the GIS Application it will appear in the map view. The map view shows a graphic representing your layer. When you add more than one layer to a map view, the layers are overlaid on top of each other. Look at figures Fig. 2.15, Fig. 2.16, Fig. 2.17 and Fig. 2.18 to see a map view that has several layers being added to it.
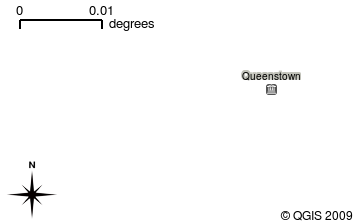
Fig. 2.15 A towns layer added to the map view
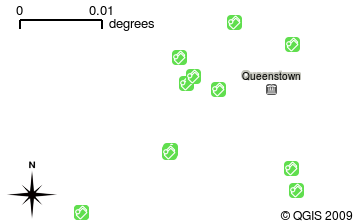
Fig. 2.16 A schools layer added to the map view
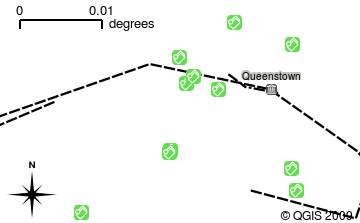
Fig. 2.17 A railways layer added to the map view
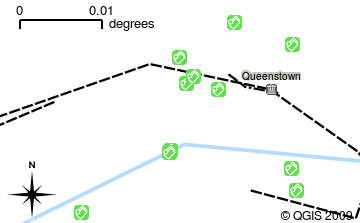
Fig. 2.18 A rivers layer added to the map view
An important function of the map view is to allow you to zoom in to magnify, zoom out to see a greater area and move around (panning) in the map. GIS software also lets you easily change symbology — the way information is displayed. Fig. 2.19 shows the map view after panning to the side and changing the symbology of the layers.
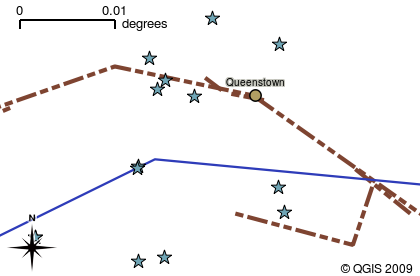
Fig. 2.19 A map view after moving around (panning) and changing the symbology
Another common feature of GIS Applications is the map legend. The map legend provides a list of layers that have been loaded in the GIS Application. Unlike a paper map legend, the map legend or ‘layers list’ in the GIS Application provides a way to re-order, hide, show and group layers. Changing the layer order is done by clicking on a layer in the legend, holding the mouse button down and then dragging the layer to a new position. In Fig. 2.20 and Fig. 2.21, the map legend is shown as the area to the left of the GIS Application window. By changing the layer order, the way that layers are drawn can be adjusted — in this case so that rivers are drawn below the roads instead of over them.
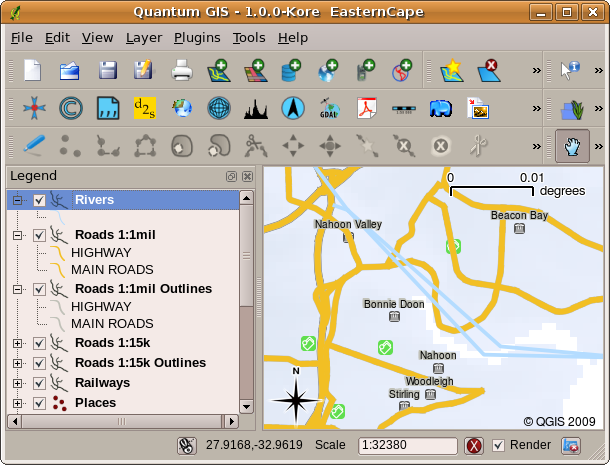
Fig. 2.20 Changing the layer order allows to adjust the way that layers are drawn. Before changing the layer order, rivers are drawn on top of roads
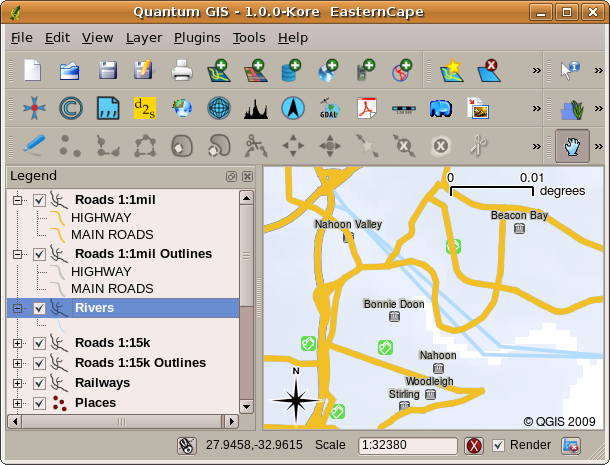
Fig. 2.21 Changing the layer order allows to adjust the way that layers are drawn. After changing the layer order, rivers are drawn underneath roads
2.4. Getting a GIS Application for your own computer(s)
There are many different GIS Applications available. Some have many sophisticated features and cost tens of thousands of Rands for each copy. In other cases, you can obtain a GIS Application for free. Deciding which GIS Application to use is a question of how much money you can afford and personal preference. For these tutorials, we will be using the QGIS Application. QGIS is completely free and you can copy it and share it with your friends as much as you like. If you received this tutorial in printed form, you should have received a copy of QGIS with it. If not, you can always visit https://www.qgis.org/ to download your free copy if you have access to the internet.
2.5. GIS Data
Now that we know what a GIS is and what a GIS Application can do, let’s talk about GIS data. Data is another word for information. The information we use in a GIS normally has a geographical aspect to it. Think of our example above, about the health care worker. She created a table to record diseases that looked like this:
Longitude |
Latitude |
Disease |
Date |
|---|---|---|---|
26.870436 |
-31.909519 |
Mumps |
13/12/2008 |
The longitude and latitude columns hold geographical data. The disease and date columns hold non-geographical data.
A common feature of GIS is that they allow you to associate information (non-geographical data) with places (geographical data). In fact, the GIS Application can store many pieces of information which are associated with each place — something that paper maps are not very good at. For example, our health care worker could store the person’s age and gender on her table. When the GIS Application draws the layer, you can tell it to draw the layer based on gender, or based on disease type, and so on. So, with a GIS Application we have a way to easily change the appearance of the maps we created based on the non-geographical data associated with places.
GIS Systems work with many different types of data. Vector data are stored as
a series of X, Y coordinate pairs inside the computer’s memory. Vector data
are used to represent points, lines and areas. Fig. 2.22
shows different types of vector data being viewed in a GIS application. In the
tutorials that follow we will be exploring vector data in more detail.
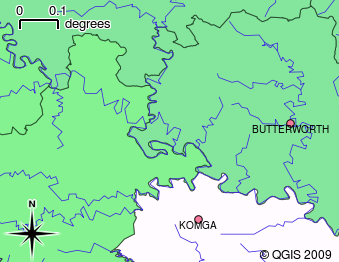
Fig. 2.22 Vector data are used to represent points (e.g., towns), lines (e.g., rivers) and polygons (e.g., municipal boundaries).
Raster data are stored as a grid of values. There are many satellites circling the earth and the photographs they take are a kind of raster data that can be viewed in a GIS. One important difference between raster and vector data is that if you zoom in too much on a raster image, it will start to appear ‘blocky’ (see Fig. 2.23 and Fig. 2.24). In fact these blocks are the individual cells of the data grid that makes up the raster image. We will be looking at raster data in greater detail in later tutorials.
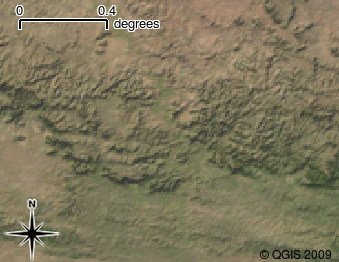
Fig. 2.23 Raster data are often images taken by satellites. Here we can see mountains in the Eastern Cape.
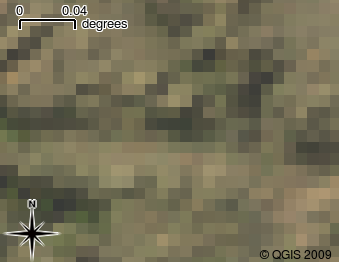
Fig. 2.24 The same raster data, but this time zoomed in. The grid nature of the data can be seen.
2.6. What have we learned?
Let’s wrap up what we covered in this worksheet:
A GIS is a system of computer hardware, computer software and geographical data.
A GIS Application allows you to view geographical data and is an important part of the GIS.
A GIS Application normally consists of a menu bar, toolbars, a map view and a legend.
Vector and raster data are geographical data used in a GIS application.
Geographical data can have associated non-geographical data.
2.7. Now you try!
Here are some ideas for you to try with your learners:
Geography: Describe the concept of GIS to your learners as outlined in this tutorial. Ask them to try to think of 3 reasons why it might be handy to use a GIS instead of paper maps. Here are some that we could think of:
GIS Applications allow you to create many different types of maps from the same data.
GIS is a great visualisation tool that can show you things about your data and how they are related in space (e.g. those disease outbreaks we saw earlier).
Paper maps need to be filed and are time consuming to view. The GIS can hold a very large amount of map data and make it quick and easy to find a place you are interested in.
Geography: Can you and your learners think of how raster data from satellites could be useful? Here are some ideas we had:
During natural disasters, raster data can be useful to show where the impacted areas are. For example a recent satellite image taken during a flood can help to show where people may need rescuing.
Sometimes people do bad things to the environment, like dumping dangerous chemicals that kill plants and animals. Using raster data from satellites can help us to monitor for these types of problems.
Town planners can use raster data from satellites to see where informal settlements are and to help in planning infrastructure.
2.8. Something to think about
If you don’t have a computer available, many of the topics we cover in this tutorial can be reproduced using an overhead and transparency as it uses the same technique of layering information. However, to properly understand GIS it is always better to learn it using a computer.
2.9. Further reading
Book: Desktop GIS: Mapping the Planet with Open Source Tools. Author: Gary Sherman. ISBN: 9781934356067
The QGIS User Guide also has more detailed information on working with QGIS.
2.10. What’s next?
In the sections that follow we are going to go into more detail, showing you how to use a GIS Application. All of the tutorials will be done using QGIS. Next up, let’s look at vectors!