14.5. Lesson: 体系的なサンプリングの設計
林分を表すポリゴンの集合は既にデジタイズしましたが、まだ森林についての情報を持っていません。その目的のために、この森林地域全体の目録作成の調査を設計し、そのパラメーターを推定できます。このレッスンでは、サンプリングプロットの体系的なセットを作成します。
森林目録を計画し始めるときは、目的、使用されるサンプルプロットの種類、目的を達成するために収集されるデータの種類を明確に定義することが重要です。それらは、個々の場合について森林管理目的のタイプに依存するでしょうし、誰か林業の知識を持つ人によって慎重に計画されなければなりません。このレッスンでは、体系的なサンプリングプロットの設計に基づいた理論的な目録を実装します。
このレッスンの目標: 森林地域を調査するために体系的なサンプリングプロットの設計を作成します。
14.5.1. 森林の目録を作成する
森林の目録を作成するには、それぞれ異なる目的や条件に合わせて、いくつかの方法があります。たとえば、森林の目録を作成する1つの非常に正確な方法は(樹種だけを考慮する場合)、森林を訪問し、すべての木とその特徴のリストを作成することです。ご想像できるように、これはいくつかの小さな領域または一部の特殊な状況を除けば、一般的には適用できません。
森林について知る最も一般的な方法は、森林をサンプリングすることです。つまり、森林のさまざまな場所で計測を行い、その情報を森林全体に一般化することです。これらの計測は、多くの場合、簡単に計測できる小さな森林領域である サンプルプロット で行われます。サンプルプロットは、どんなサイズ(たとえば、50 m2、0.5 ha)や形式(たとえば、円形、長方形、可変サイズ)にもでき、方法(たとえば、ランダム、体系的、線に沿って)もさまざまです。サンプルプロットのサイズ、形式、および場所は、通常、統計的、経済的、および実用的な考慮事項に従って決定されます。林業の知識がない方は このウィキペディアの記事 を読むことをお勧めします。
14.5.2.  Follow Along: 体系的サンプリングプロット設計を実装する
作業している森について管理者は、この森のためには体系的なサンプリング設計が最も適切であると判断し、またサンプルプロットとサンプリングラインとの間に80メートルの一定の距離が信頼性の高い結果が得られると判断しました(この場合では68%の確率で平均誤差+-5%)。可変サイズのプロットは、成長および成熟林分のため、この目録のための最も効果的な方法であると判断されているが、苗林分については4メートル固定の半径のプロットが使用されるでしょう。
実際には、後で野外チームによって使用されるポイントとしてサンプルプロットを表現する必要があるだけです:
前のレッスンからの
digitizing_2012.qgsプロジェクトを QGISで開きます。forest_stands_2012 以外のすべてのレイヤを削除します。
ここでプロジェクトを
forest_inventory.qgsとして保存してください
今、お互いに80メートル離れたポイントの長方形のグリッドを作成する必要があります:
 規則的な点群 を開きます。
作成範囲 フィールドの横にあるドロップダウンボタンを押して、 レイヤから計算 メニューから、 forest_stands_2012 を選択します。
点の間隔/数 の設定に、
80メートルを入力します。点の間隔を使う ボックスをチェックすると、この値がポイント間の距離を表していることを示します。
Under Regular points, save the output as
systematic_plots.shpin theforestry\sampling\folder.Check Open output file after running algorithm.
Press Run.
注釈
提案された 規則的な点 は、選択されたポリゴン レイヤーの範囲の左上隅から始まる体系的なポイントを作成します。この規則的な点にランダム性を追加したい場合は、0 から 80 (80 は点間の距離) の間でランダムに計算された数値を使用し、それからツールのダイアログで 隅からの初期嵌め込み(LH側) パラメータとして記述します
このツールは、ポイントの長方形のグリッドを生成するために、林分レイヤーの全体の範囲を使用していることに気づきます。しかし、お使いの森林面積の内側に実際にある点のみに関心があります(下の画像を参照):
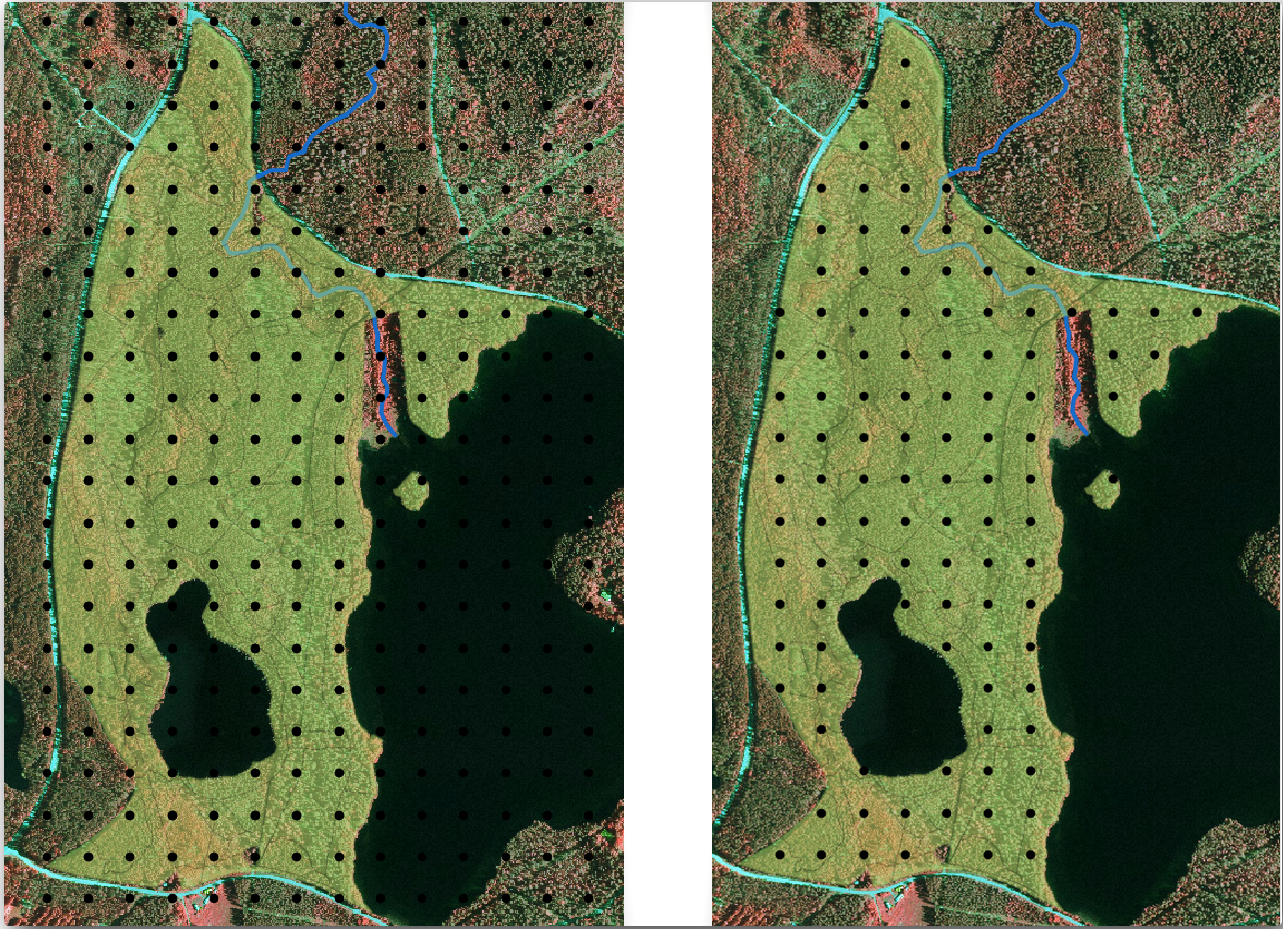
From the Processing toolbox, open
 .
.Select systematic_plots as the Input layer.
Set forest_stands_2012 as the Mask layer.
Save the Clipped (mask) result as
systematic_plots_clip.shpin theforestry\sampling\folder.Check Open output file after running algorithm.
Press Run.
これで、野外チームが設計されたサンプルプロットの場所に移動するために使用するポイントができました。野外作業のためにより便利になるように、これらのポイントをさらに準備できます。少なくとも、ポイントのために意味のある名前を追加し、GPSデバイスで使用できる形式にエクスポートする必要はあるでしょう。
Let's start with the naming of the sample plots. If you check the Attribute table for the plots inside the forest area, you can see that you have the default id field automatically generated by the Regular points tool. Label the points to see them in the map and consider if you could use those numbers as part of your sample plot naming:
Open the
 Labels
for the
Labels
for the systematic_plots_cliplayer.Turn the top menu into
Single Labels.For the Value entry, select the field
id.Go to the
 Buffer tab, check the
Draw text buffer and set the buffer Size to
Buffer tab, check the
Draw text buffer and set the buffer Size to 1.OK をクリックします。
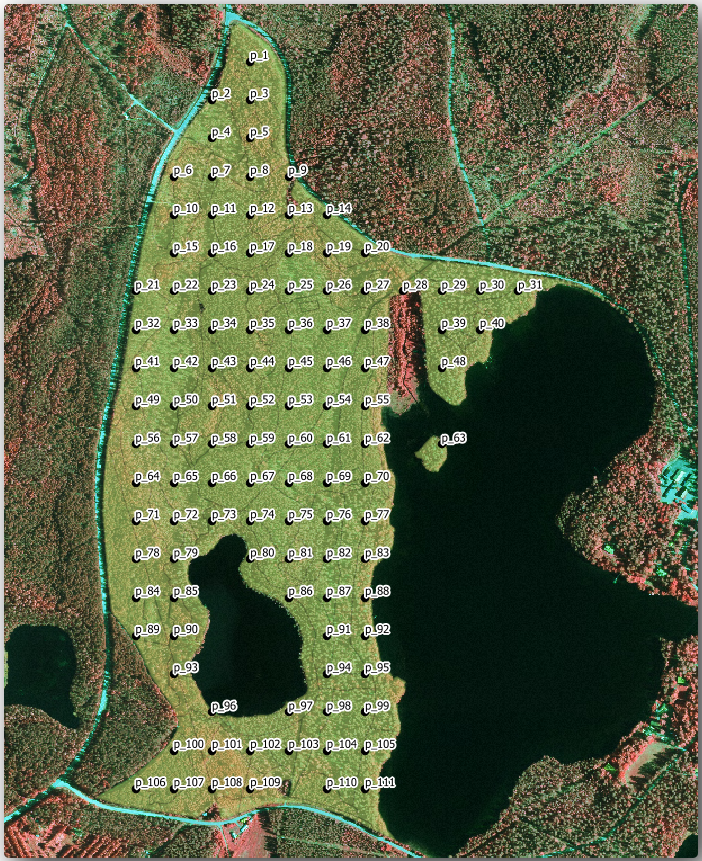
ここで地図上のラベルを見てください。ポイントが作成され、最初に西から東、それから北から南へと番号付けられていることがわかります。再び属性テーブルを見れば、テーブル内の順序もそのパターンに従っていることがわかります。異なる方法でサンプルプロットに名前付けする理由がない限り、名前を西東/南北様式で名前付けすることは論理的な順序に従っており、良いオプションです。
Nevertheless, the number values in the id field are not so good.
It would be better if the naming would be something like p_1, p_2....
You can create a new column for the systematic_plots_clip layer:
Go to the Attribute table for
systematic_plots_clip.Enable the
 edit mode.
Open the
 Field calculator:
Check Create a new field
Enter
Plot_idas Output field nameSet the Output field type to Text (string).
In the Expression field, write, copy or construct this formula
concat('P_', @rownum ). Remember that you can also double click on the elements inside the Function list. Theconcatfunction can be found under String and@rownumis under the Variables and values group.
OK をクリックします。
編集モードを無効にし、変更を保存します。
Now you have a new column with plot names that are meaningful to you. For the
systematic_plots_clip layer, change the field used for labeling to your
new Plot_id field.
14.5.3. Follow Along: GPX形式としてサンプルプロットを書き出す
The field teams will be probably using a GPS device to locate the sample plots you planned. The next step is to export the points you created to a format that your GPS can read. QGIS allows you to save your point and line vector data in GPS eXchange Format (GPX), which is an standard GPS data format that can be read by most of the specialized software. You need to be careful with selecting the CRS when you save your data:
Right-click
systematic_plots_cliplayer and select .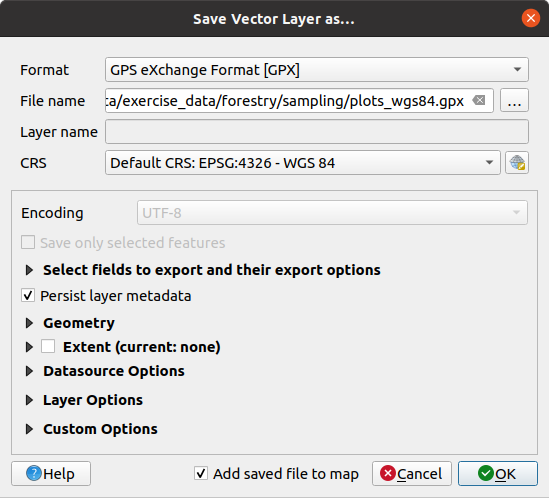
フォーマット で GPS交換フォーマット[GPX] を選択します。
Save the output File name as
plots_wgs84.gpxin theforestry\sampling\folder.CRS 中で 選択されたCRS を選択します。
Browse for EPSG:4326 - WGS 84.
注釈
The GPX format accepts only this CRS, if you select a different one, QGIS will give no error but you will get an empty file.
OK をクリックします。
In the dialog that opens, select only the
waypointslayer (the rest of the layers are empty).
The inventory sample plots are now in a standard format that can be managed by
most of the GPS software. The field teams can now upload the locations of the
sample plots to their devices. That would be done by using the specific devices
own software and the plots_wgs84.gpx file you just saved. Other option
would be to use the GPS Tools plugin but it would most likely
involve setting the tool to work with your specific GPS device. If you are
working with your own data and want to see how the tool works you can find out
information about it in the section GPSデータの操作 in the QGIS User Manual.
ここでQGISプロジェクトを保存します。
14.5.4. In Conclusion
森林目録に使用する体系的なサンプリングの設計を作成する方法を簡単に見たところです。サンプリング設計の他のタイプを作成するには、QGIS内のさまざまなツールやスプレッドシートを使用したりスクリプトを書いてサンプルプロットの座標を計算することが入ってきますが、一般的な考え方は同じままになります。
14.5.5. What's Next?
次のレッスンでは、野外チームが担当のサンプルプロットに到達するため使用している詳細地図を自動で作成するために、QGISの地図帳機能をどう使用するかを見ていきましょう。