24.1.9. Анализ растров
24.1.9.1. Cell statistics
Computes per-cell statistics based on input raster layers and for each cell writes the resulting statistics to an output raster. At each cell location, the output value is defined as a function of all overlaid cell values of the input rasters.
By default, a NoData cell in ANY of the input layers will result in a NoData cell in the output raster. If the Ignore NoData values option is checked, then NoData inputs will be ignored in the statistic calculation. This may result in NoData output for locations where all cells are NoData.
The Reference layer parameter specifies an existing raster layer to use as a reference when creating the output raster. The output raster will have the same extent, CRS, and pixel dimensions as this layer.
Calculation details:
Input raster layers that do not match the cell size of the reference
raster layer will be resampled using nearest neighbor resampling.
The output raster data type will be set to the most complex
data type present in the input datasets except when using the
functions Mean, Standard deviation and Variance (data type is always
Float32 or Float64 depending on input float type) or Count
and Variety (data type is always Int32).
Count: The count statistic will always result in the number of cells without NoData values at the current cell location.Median: If the number of input layers is even, the median will be calculated as the arithmetic mean of the two middle values of the ordered cell input values.Minority/Majority: If no unique minority or majority could be found, the result is NoData, except all input cell values are equal.
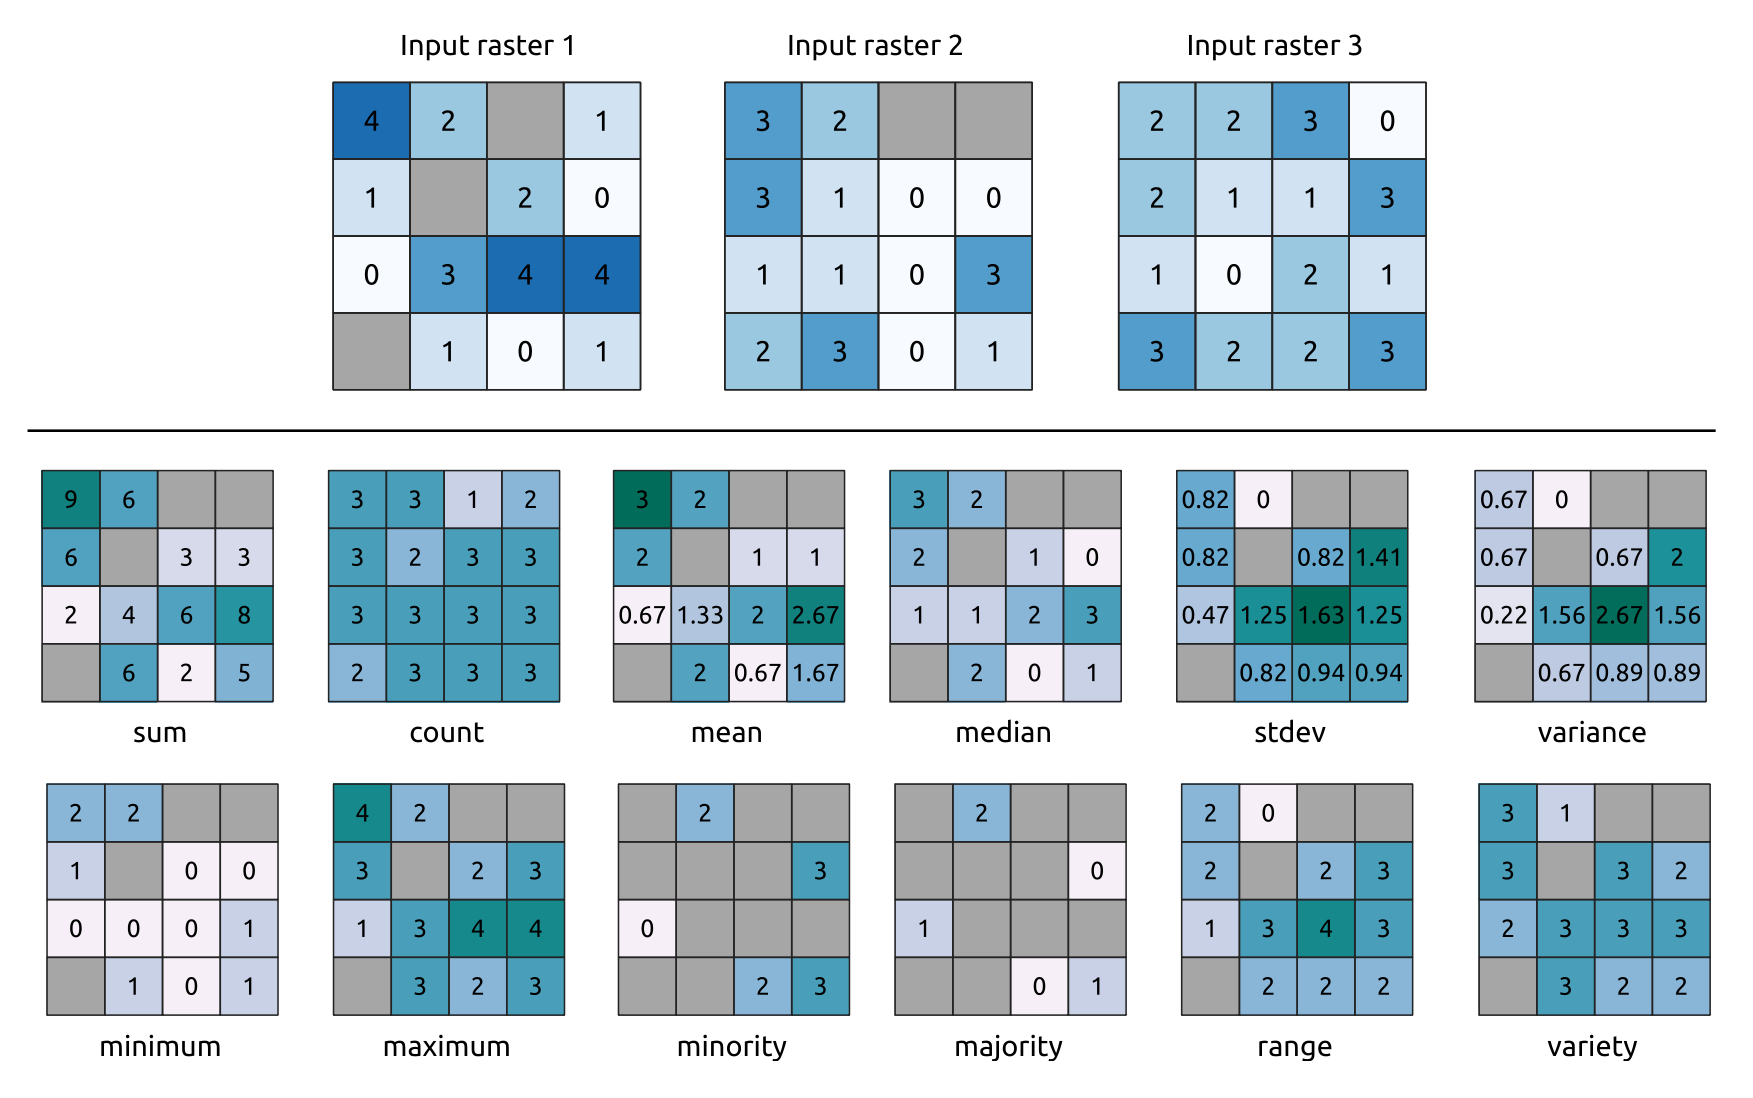
Рис. 24.8 Example with all the statistic functions. NoData cells (grey) are taken into account.
Parameters
Label |
Имя |
Тип |
Описание |
|---|---|---|---|
Input layers |
|
[raster] [list] |
Input raster layers |
Statistic |
|
[enumeration] Default: 0 |
Available statistics. Options:
|
Ignore NoData values |
|
[boolean] Default: True |
Calculate statistics also for all cells stacks, ignoring NoData occurrence. |
Reference layer |
|
[raster] |
The reference layer to create the output layer from (extent, CRS, pixel dimensions) |
Output no data value Optional |
|
[number] Default: -9999.0 |
Value to use for nodata in the output layer |
Output layer |
|
[same as input] |
Specification of the output raster. One of:
The file encoding can also be changed here. |
Outputs
Label |
Имя |
Тип |
Описание |
|---|---|---|---|
CRS authority identifier |
|
[crs] |
The coordinate reference system of the output raster layer |
Extent |
|
[extent] |
The spatial extent of the output raster layer |
Height in pixels |
|
[integer] |
The height in pixels of the output raster layer |
Output raster |
|
[raster] |
Output raster layer containing the result |
Total pixel count |
|
[integer] |
The count of pixels in the output raster layer |
Width in pixels |
|
[integer] |
The width in pixels of the output raster layer |
Python code
Algorithm ID: qgis:cellstatistics
import processing
processing.run("algorithm_id", {parameter_dictionary})
The algorithm id is displayed when you hover over the algorithm in the Processing Toolbox. The parameter dictionary provides the parameter NAMEs and values. See Изпользование алгоритмов геообработки в консоли for details on how to run processing algorithms from the Python console.
24.1.9.2. Equal to frequency
Evaluates on a cell-by-cell basis the frequency (number of times) the values
of an input stack of rasters are equal to the value of a value layer.
The output raster extent and resolution are defined by the input raster layer
and is always of Int32 type.
If multiband rasters are used in the data raster stack, the algorithm will always perform the analysis on the first band of the rasters - use GDAL to use other bands in the analysis. The output NoData value can be set manually.
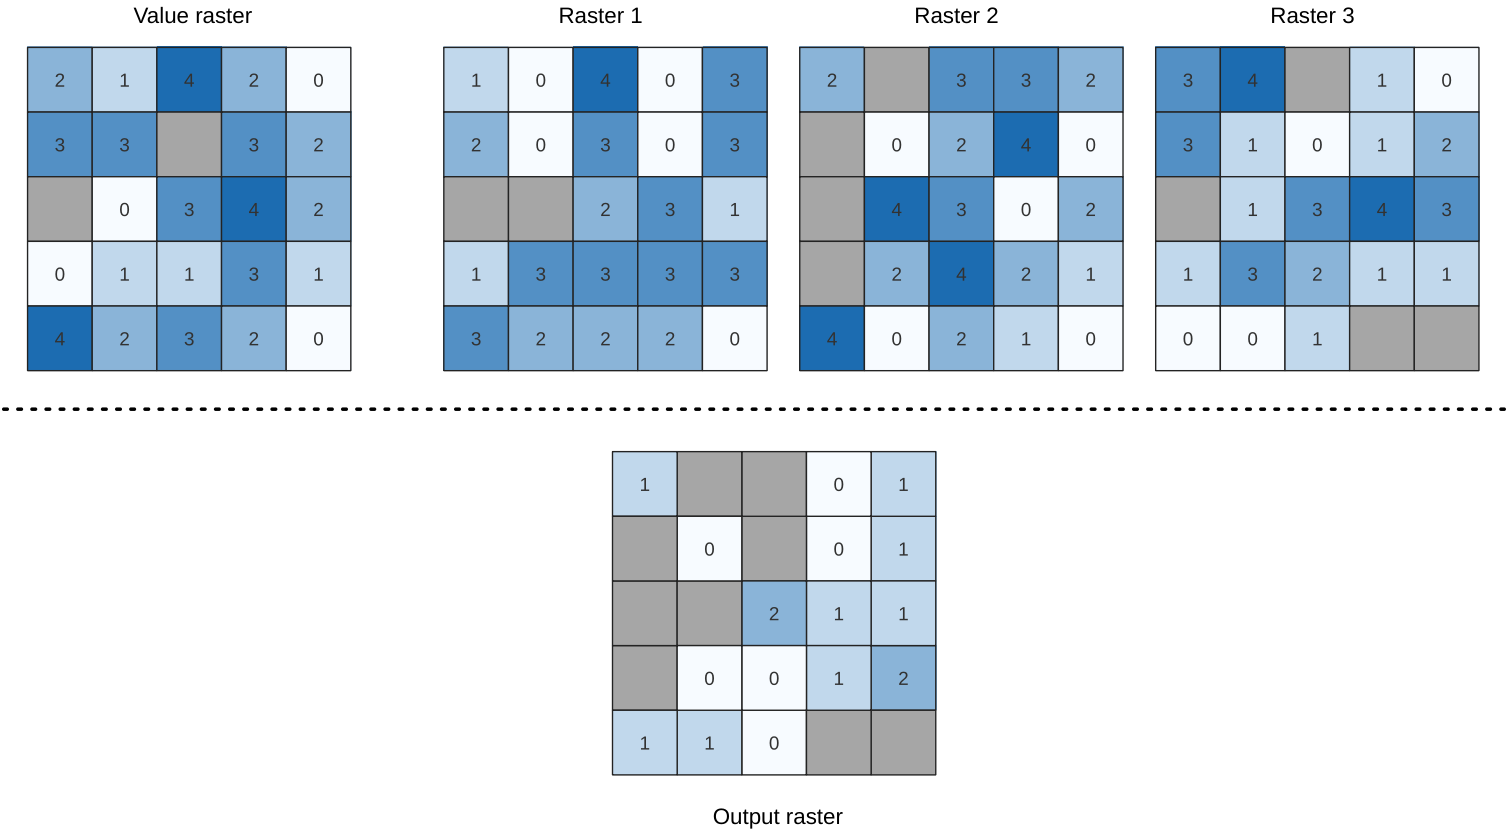
Рис. 24.9 For each cell in the output raster, the value represents the number of times
that the corresponding cells in the list of rasters are the same as the value raster.
NoData cells (grey) are taken into account.
См.также
Parameters
Basic parameters
Label |
Имя |
Тип |
Описание |
|---|---|---|---|
Input value raster |
|
[raster] |
The input value layer serves as reference layer for the sample layers |
Value raster band |
|
[raster band] Default: The first band of the raster layer |
Select the band you want to use as sample |
Input raster layers |
|
[raster] [list] |
Raster layers to evaluate. If multiband rasters are used in the data raster stack, the algorithm will always perform the analysis on the first band of the rasters |
Ignore NoData values |
|
[boolean] Default: False |
If unchecked, any NoData cells in the value raster or the data layer stack will result in a NoData cell in the output raster |
Output layer |
|
[same as input] Default: |
Specification of the output raster. One of:
|
Advanced parameters
Label |
Имя |
Тип |
Описание |
|---|---|---|---|
Output no data value Optional |
|
[number] Default: -9999.0 |
Value to use for nodata in the output layer |
Outputs
Label |
Имя |
Тип |
Описание |
|---|---|---|---|
Output layer |
|
[raster] |
Output raster layer containing the result |
CRS authority identifier |
|
[string] |
The coordinate reference system of the output raster layer |
Extent |
|
[string] |
The spatial extent of the output raster layer |
Count of cells with equal value occurrences |
|
[number] |
|
Height in pixels |
|
[number] |
The number of rows in the output raster layer |
Total pixel count |
|
[integer] |
The count of pixels in the output raster layer |
Mean frequency at valid cell locations |
|
[number] |
|
Count of value occurrences |
|
[number] |
|
Width in pixels |
|
[integer] |
The number of columns in the output raster layer |
Python code
Algorithm ID: native:equaltofrequency
import processing
processing.run("algorithm_id", {parameter_dictionary})
The algorithm id is displayed when you hover over the algorithm in the Processing Toolbox. The parameter dictionary provides the parameter NAMEs and values. See Изпользование алгоритмов геообработки в консоли for details on how to run processing algorithms from the Python console.
24.1.9.3. Fuzzify raster (gaussian membership)
Transforms an input raster to a fuzzified raster by assigning a
membership value to each pixel, using a Gaussian membership function.
Membership values range from 0 to 1.
In the fuzzified raster, a value of 0 implies no membership of the
defined fuzzy set, whereas a value of 1 means full membership.
The gaussian membership function is defined as  ,
where f1 is the spread and f2 the midpoint.
,
where f1 is the spread and f2 the midpoint.
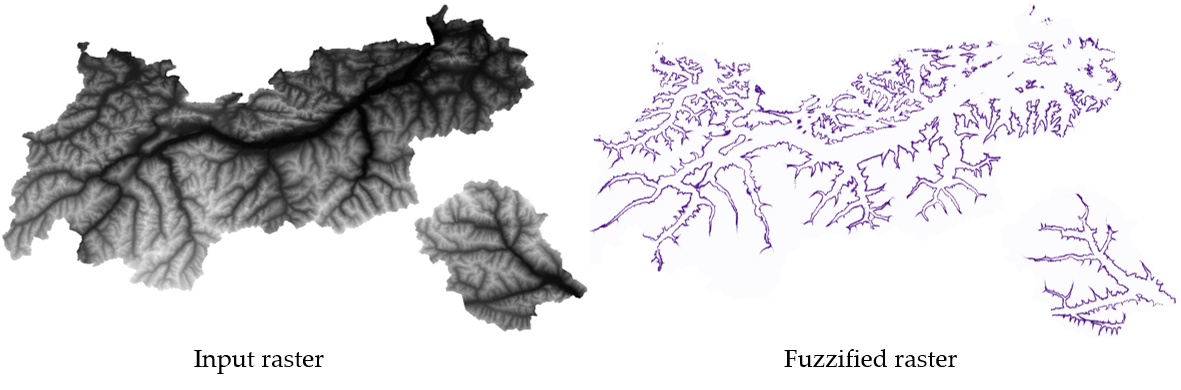
Рис. 24.10 Fuzzify raster example. Input raster source: Land Tirol - data.tirol.gv.at.
См.также
Fuzzify raster (large membership) Fuzzify raster (linear membership), Fuzzify raster (near membership), Fuzzify raster (power membership), Fuzzify raster (small membership)
Parameters
Label |
Имя |
Тип |
Описание |
|---|---|---|---|
Input Raster |
|
[raster] |
Input raster layer |
Band Number |
|
[raster band] Default: The first band of the raster layer |
If the raster is multiband, choose the band that you want to fuzzify. |
Function midpoint |
|
[number] Default: 10 |
Midpoint of the gaussian function |
Function spread |
|
[number] Default: 0.01 |
Spread of the gaussian function |
Fuzzified raster |
|
[same as input] |
Specification of the output raster. One of:
The file encoding can also be changed here. |
Outputs
Label |
Имя |
Тип |
Описание |
|---|---|---|---|
Fuzzified raster |
|
[same as input] |
Output raster layer containing the result |
CRS authority identifier |
|
[crs] |
The coordinate reference system of the output raster layer |
Extent |
|
[extent] |
The spatial extent of the output raster layer |
Width in pixels |
|
[integer] |
The width in pixels of the output raster layer |
Height in pixels |
|
[integer] |
The height in pixels of the output raster layer |
Total pixel count |
|
[integer] |
The count of pixels in the output raster layer |
Python code
Algorithm ID: qgis:fuzzifyrastergaussianmembership
import processing
processing.run("algorithm_id", {parameter_dictionary})
The algorithm id is displayed when you hover over the algorithm in the Processing Toolbox. The parameter dictionary provides the parameter NAMEs and values. See Изпользование алгоритмов геообработки в консоли for details on how to run processing algorithms from the Python console.
24.1.9.4. Fuzzify raster (large membership)
Transforms an input raster to a fuzzified raster by assigning a
membership value to each pixel, using a Large membership function.
Membership values range from 0 to 1.
In the fuzzified raster, a value of 0 implies no membership of the
defined fuzzy set, whereas a value of 1 means full membership.
The large membership function is defined as  ,
where f1 is the spread and f2 the midpoint.
,
where f1 is the spread and f2 the midpoint.
См.также
Fuzzify raster (gaussian membership), Fuzzify raster (linear membership), Fuzzify raster (near membership), Fuzzify raster (power membership), Fuzzify raster (small membership)
Parameters
Label |
Имя |
Тип |
Описание |
|---|---|---|---|
Input Raster |
|
[raster] |
Input raster layer |
Band Number |
|
[raster band] Default: The first band of the raster layer |
If the raster is multiband, choose the band that you want to fuzzify. |
Function midpoint |
|
[number] Default: 50 |
Midpoint of the large function |
Function spread |
|
[number] Default: 5 |
Spread of the large function |
Fuzzified raster |
|
[same as input] |
Specification of the output raster. One of:
The file encoding can also be changed here. |
Outputs
Label |
Имя |
Тип |
Описание |
|---|---|---|---|
Fuzzified raster |
|
[same as input] |
Output raster layer containing the result |
CRS authority identifier |
|
[crs] |
The coordinate reference system of the output raster layer |
Extent |
|
[extent] |
The spatial extent of the output raster layer |
Width in pixels |
|
[integer] |
The width in pixels of the output raster layer |
Height in pixels |
|
[integer] |
The height in pixels of the output raster layer |
Total pixel count |
|
[integer] |
The count of pixels in the output raster layer |
Python code
Algorithm ID: qgis:fuzzifyrasterlargemembership
import processing
processing.run("algorithm_id", {parameter_dictionary})
The algorithm id is displayed when you hover over the algorithm in the Processing Toolbox. The parameter dictionary provides the parameter NAMEs and values. See Изпользование алгоритмов геообработки в консоли for details on how to run processing algorithms from the Python console.
24.1.9.5. Fuzzify raster (linear membership)
Transforms an input raster to a fuzzified raster by assigning a
membership value to each pixel, using a Linear membership function.
Membership values range from 0 to 1. In the fuzzified raster, a value
of 0 implies no membership of the defined fuzzy set, whereas a value
of 1 means full membership.
The linear function is defined as  , where a
is the low bound and b the high bound. This equation assigns
membership values using a linear transformation for pixel values
between the low and high bounds.
Pixels values smaller than the low bound are given 0 membership
whereas pixel values greater than the high bound are given 1
membership.
, where a
is the low bound and b the high bound. This equation assigns
membership values using a linear transformation for pixel values
between the low and high bounds.
Pixels values smaller than the low bound are given 0 membership
whereas pixel values greater than the high bound are given 1
membership.
См.также
Fuzzify raster (gaussian membership), Fuzzify raster (large membership), Fuzzify raster (near membership), Fuzzify raster (power membership), Fuzzify raster (small membership)
Parameters
Label |
Имя |
Тип |
Описание |
|---|---|---|---|
Input Raster |
|
[raster] |
Input raster layer |
Band Number |
|
[raster band] Default: The first band of the raster layer |
If the raster is multiband, choose the band that you want to fuzzify. |
Low fuzzy membership bound |
|
[number] Default: 0 |
Low bound of the linear function |
High fuzzy membership bound |
|
[number] Default: 1 |
High bound of the linear function |
Fuzzified raster |
|
[same as input] |
Specification of the output raster. One of:
The file encoding can also be changed here. |
Outputs
Label |
Имя |
Тип |
Описание |
|---|---|---|---|
Fuzzified raster |
|
[same as input] |
Output raster layer containing the result |
CRS authority identifier |
|
[crs] |
The coordinate reference system of the output raster layer |
Extent |
|
[extent] |
The spatial extent of the output raster layer |
Width in pixels |
|
[integer] |
The width in pixels of the output raster layer |
Height in pixels |
|
[integer] |
The height in pixels of the output raster layer |
Total pixel count |
|
[integer] |
The count of pixels in the output raster layer |
Python code
Algorithm ID: qgisfuzzifyrasterlinearmembership
import processing
processing.run("algorithm_id", {parameter_dictionary})
The algorithm id is displayed when you hover over the algorithm in the Processing Toolbox. The parameter dictionary provides the parameter NAMEs and values. See Изпользование алгоритмов геообработки в консоли for details on how to run processing algorithms from the Python console.
24.1.9.6. Fuzzify raster (near membership)
Transforms an input raster to a fuzzified raster by assigning a
membership value to each pixel, using a Near membership function.
Membership values range from 0 to 1.
In the fuzzified raster, a value of 0 implies no membership of the
defined fuzzy set, whereas a value of 1 means full membership.
The near membership function is defined as  , where
f1 is the spread and f2 the midpoint.
, where
f1 is the spread and f2 the midpoint.
См.также
Fuzzify raster (gaussian membership), Fuzzify raster (large membership), Fuzzify raster (linear membership), Fuzzify raster (power membership), Fuzzify raster (small membership)
Parameters
Label |
Имя |
Тип |
Описание |
|---|---|---|---|
Input Raster |
|
[raster] |
Input raster layer |
Band Number |
|
[raster band] Default: The first band of the raster layer |
If the raster is multiband, choose the band that you want to fuzzify. |
Function midpoint |
|
[number] Default: 50 |
Midpoint of the near function |
Function spread |
|
[number] Default: 0.01 |
Spread of the near function |
Fuzzified raster |
|
[same as input] |
Specification of the output raster. One of:
The file encoding can also be changed here. |
Outputs
Label |
Имя |
Тип |
Описание |
|---|---|---|---|
Fuzzified raster |
|
[same as input] |
Output raster layer containing the result |
CRS authority identifier |
|
[crs] |
The coordinate reference system of the output raster layer |
Extent |
|
[extent] |
The spatial extent of the output raster layer |
Width in pixels |
|
[integer] |
The width in pixels of the output raster layer |
Height in pixels |
|
[integer] |
The height in pixels of the output raster layer |
Total pixel count |
|
[integer] |
The count of pixels in the output raster layer |
Python code
Algorithm ID: qgis:fuzzifyrasternearmembership
import processing
processing.run("algorithm_id", {parameter_dictionary})
The algorithm id is displayed when you hover over the algorithm in the Processing Toolbox. The parameter dictionary provides the parameter NAMEs and values. See Изпользование алгоритмов геообработки в консоли for details on how to run processing algorithms from the Python console.
24.1.9.7. Fuzzify raster (power membership)
Transforms an input raster to a fuzzified raster by assigning a
membership value to each pixel, using a Power membership function.
Membership values range from 0 to 1.
In the fuzzified raster, a value of 0 implies no membership of the
defined fuzzy set, whereas a value of 1 means full membership.
The power function is defined as  , where a is the
low bound, b is the high bound, and f1 the exponent.
This equation assigns membership values using the power transformation
for pixel values between the low and high bounds.
Pixels values smaller than the low bound are given 0 membership
whereas pixel values greater than the high bound are given 1
membership.
, where a is the
low bound, b is the high bound, and f1 the exponent.
This equation assigns membership values using the power transformation
for pixel values between the low and high bounds.
Pixels values smaller than the low bound are given 0 membership
whereas pixel values greater than the high bound are given 1
membership.
См.также
Fuzzify raster (gaussian membership), Fuzzify raster (large membership), Fuzzify raster (linear membership), Fuzzify raster (near membership), Fuzzify raster (small membership)
Parameters
Label |
Имя |
Тип |
Описание |
|---|---|---|---|
Input Raster |
|
[raster] |
Input raster layer |
Band Number |
|
[raster band] Default: The first band of the raster layer |
If the raster is multiband, choose the band that you want to fuzzify. |
Low fuzzy membership bound |
|
[number] Default: 0 |
Low bound of the power function |
High fuzzy membership bound |
|
[number] Default: 1 |
High bound of the power function |
High fuzzy membership bound |
|
[number] Default: 2 |
Exponent of the power function |
Fuzzified raster |
|
[same as input] |
Specification of the output raster. One of:
The file encoding can also be changed here. |
Outputs
Label |
Имя |
Тип |
Описание |
|---|---|---|---|
Fuzzified raster |
|
[same as input] |
Output raster layer containing the result |
CRS authority identifier |
|
[crs] |
The coordinate reference system of the output raster layer |
Extent |
|
[extent] |
The spatial extent of the output raster layer |
Width in pixels |
|
[integer] |
The width in pixels of the output raster layer |
Height in pixels |
|
[integer] |
The height in pixels of the output raster layer |
Total pixel count |
|
[integer] |
The count of pixels in the output raster layer |
Python code
Algorithm ID: qgisfuzzifyrasterpowermembership
import processing
processing.run("algorithm_id", {parameter_dictionary})
The algorithm id is displayed when you hover over the algorithm in the Processing Toolbox. The parameter dictionary provides the parameter NAMEs and values. See Изпользование алгоритмов геообработки в консоли for details on how to run processing algorithms from the Python console.
24.1.9.8. Fuzzify raster (small membership)
Transforms an input raster to a fuzzified raster by assigning a
membership value to each pixel, using a Small membership function.
Membership values range from 0 to 1.
In the fuzzified raster, a value of 0 implies no membership of the
defined fuzzy set, whereas a value of 1 means full membership.
The small membership function is defined as  , where
f1 is the spread and f2 the midpoint.
, where
f1 is the spread and f2 the midpoint.
См.также
Fuzzify raster (gaussian membership), Fuzzify raster (large membership) Fuzzify raster (linear membership), Fuzzify raster (near membership), Fuzzify raster (power membership)
Parameters
Label |
Имя |
Тип |
Описание |
|---|---|---|---|
Input Raster |
|
[raster] |
Input raster layer |
Band Number |
|
[raster band] Default: The first band of the raster layer |
If the raster is multiband, choose the band that you want to fuzzify. |
Function midpoint |
|
[number] Default: 50 |
Midpoint of the small function |
Function spread |
|
[number] Default: 5 |
Spread of the small function |
Fuzzified raster |
|
[same as input] |
Specification of the output raster. One of:
The file encoding can also be changed here. |
Outputs
Label |
Имя |
Тип |
Описание |
|---|---|---|---|
Fuzzified raster |
|
[same as input] |
Output raster layer containing the result |
CRS authority identifier |
|
[crs] |
The coordinate reference system of the output raster layer |
Extent |
|
[extent] |
The spatial extent of the output raster layer |
Width in pixels |
|
[integer] |
The width in pixels of the output raster layer |
Height in pixels |
|
[integer] |
The height in pixels of the output raster layer |
Total pixel count |
|
[integer] |
The count of pixels in the output raster layer |
Python code
Algorithm ID: qgisfuzzifyrastersmallmembership
import processing
processing.run("algorithm_id", {parameter_dictionary})
The algorithm id is displayed when you hover over the algorithm in the Processing Toolbox. The parameter dictionary provides the parameter NAMEs and values. See Изпользование алгоритмов геообработки в консоли for details on how to run processing algorithms from the Python console.
24.1.9.9. Greater than frequency
Evaluates on a cell-by-cell basis the frequency (number of times) the values
of an input stack of rasters are equal to the value of a value raster.
The output raster extent and resolution is defined by the input raster layer
and is always of Int32 type.
If multiband rasters are used in the data raster stack, the algorithm will always perform the analysis on the first band of the rasters - use GDAL to use other bands in the analysis. The output NoData value can be set manually.
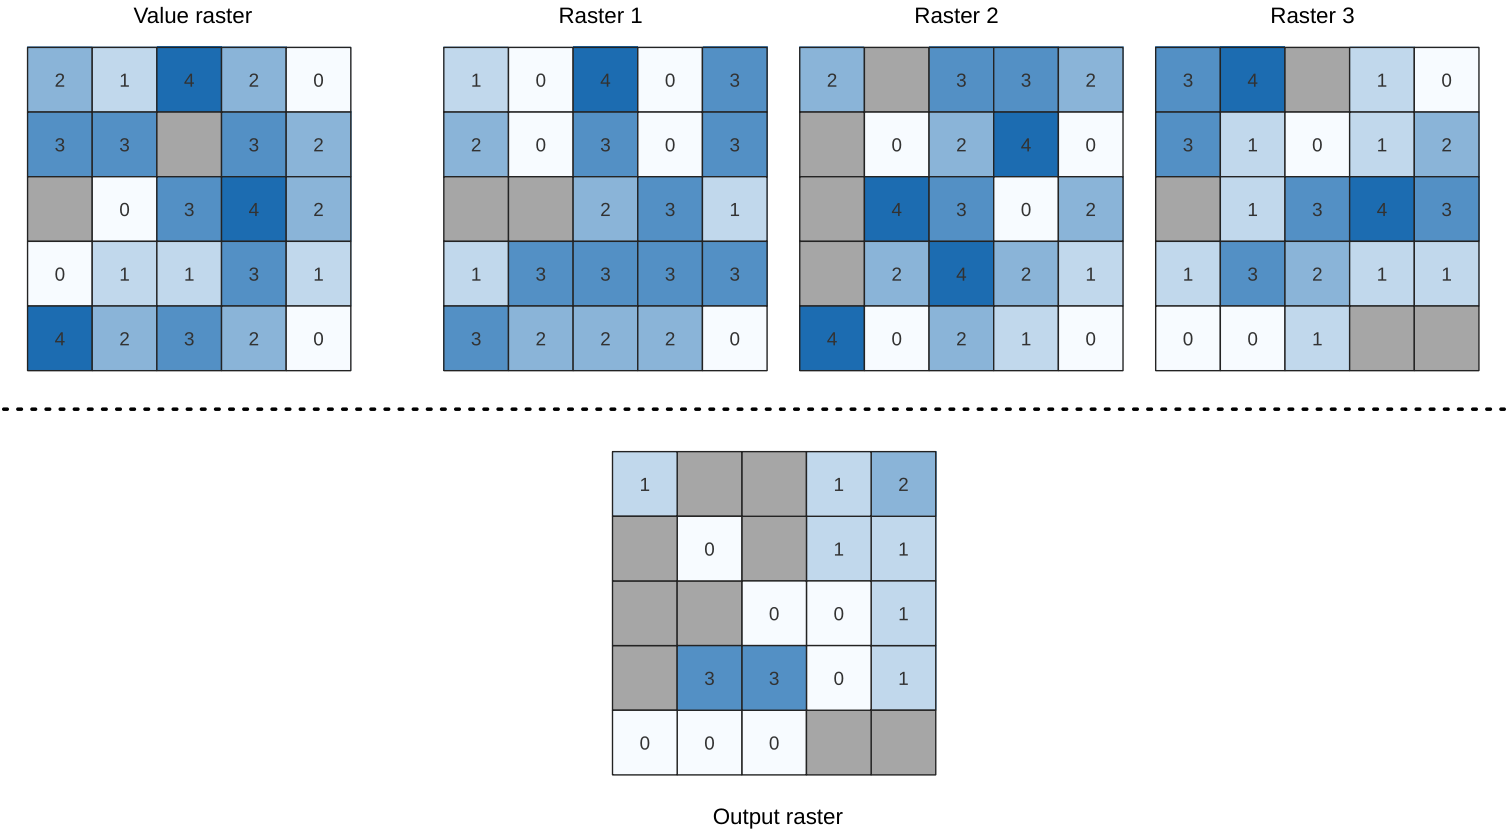
Рис. 24.11 For each cell in the output raster, the value represents the number of times
that the corresponding cells in the list of rasters are greater than the value raster.
NoData cells (grey) are taken into account.
См.также
Parameters
Basic parameters
Label |
Имя |
Тип |
Описание |
|---|---|---|---|
Input value raster |
|
[raster] |
The input value layer serves as reference layer for the sample layers |
Value raster band |
|
[raster band] Default: The first band of the raster layer |
Select the band you want to use as sample |
Input raster layers |
|
[raster] [list] |
Raster layers to evaluate. If multiband rasters are used in the data raster stack, the algorithm will always perform the analysis on the first band of the rasters |
Ignore NoData values |
|
[boolean] Default: False |
If unchecked, any NoData cells in the value raster or the data layer stack will result in a NoData cell in the output raster |
Output layer |
|
[same as input] Default: |
Specification of the output raster. One of:
|
Advanced parameters
Label |
Имя |
Тип |
Описание |
|---|---|---|---|
Output no data value Optional |
|
[number] Default: -9999.0 |
Value to use for nodata in the output layer |
Outputs
Label |
Имя |
Тип |
Описание |
|---|---|---|---|
Output layer |
|
[raster] |
Output raster layer containing the result |
CRS authority identifier |
|
[string] |
The coordinate reference system of the output raster layer |
Extent |
|
[string] |
The spatial extent of the output raster layer |
Count of cells with equal value occurrences |
|
[number] |
|
Height in pixels |
|
[number] |
The number of rows in the output raster layer |
Total pixel count |
|
[integer] |
The count of pixels in the output raster layer |
Mean frequency at valid cell locations |
|
[number] |
|
Count of value occurrences |
|
[number] |
|
Width in pixels |
|
[integer] |
The number of columns in the output raster layer |
Python code
Algorithm ID: native:greaterthanfrequency
import processing
processing.run("algorithm_id", {parameter_dictionary})
The algorithm id is displayed when you hover over the algorithm in the Processing Toolbox. The parameter dictionary provides the parameter NAMEs and values. See Изпользование алгоритмов геообработки в консоли for details on how to run processing algorithms from the Python console.
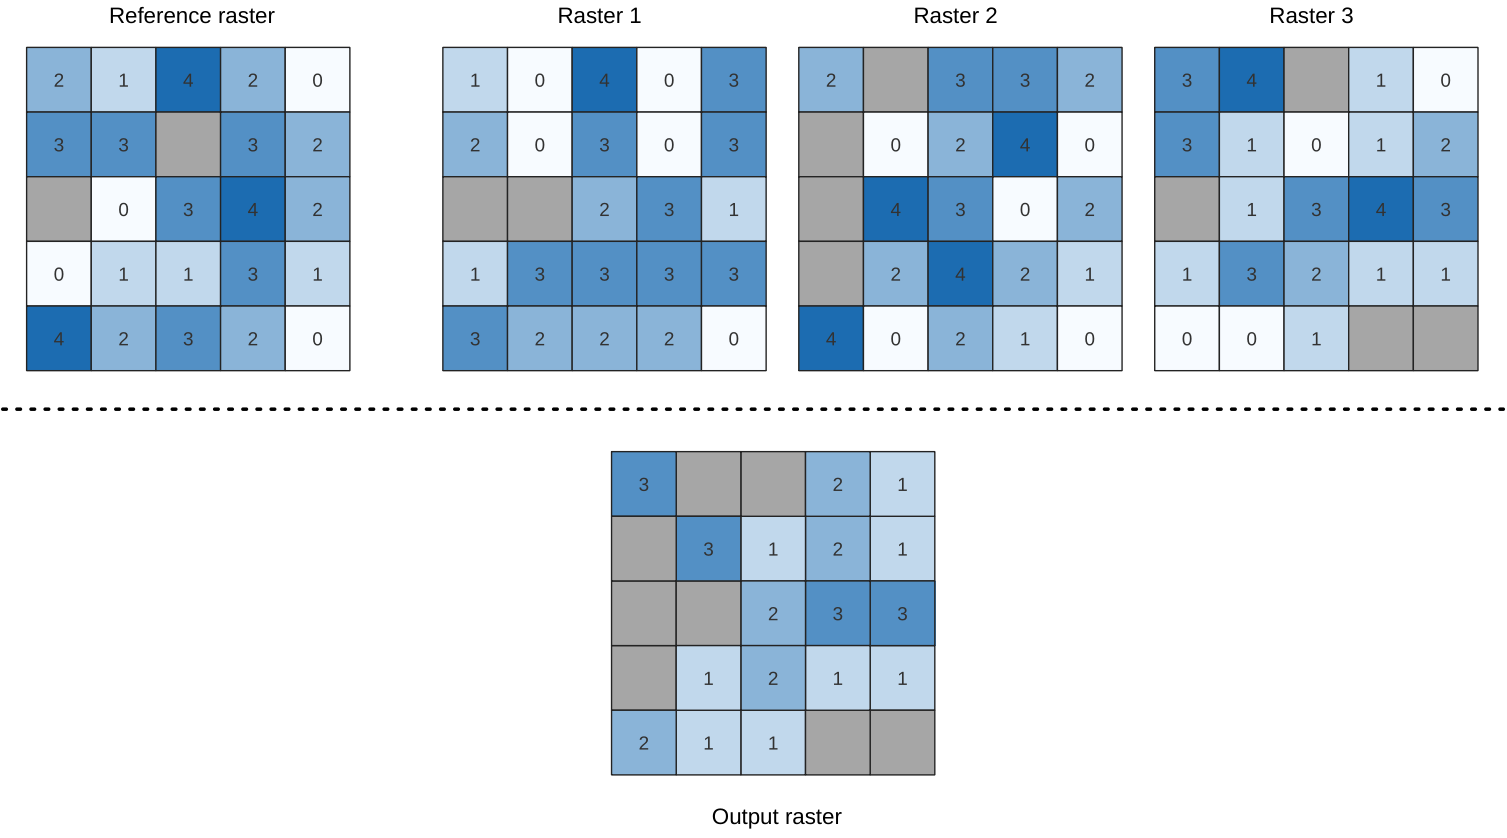
24.1.9.10. Highest position in raster stack
Evaluates on a cell-by-cell basis the position of the raster with the highest value in a stack of rasters. Position counts start with 1 and range to the total number of input rasters. The order of the input rasters is relevant for the algorithm. If multiple rasters feature the highest value, the first raster will be used for the position value.
If multiband rasters are used in the data raster stack, the algorithm will
always perform the analysis on the first band of the rasters - use GDAL to use
other bands in the analysis.
Any NoData cells in the raster layer stack will result in a NoData cell
in the output raster unless the «ignore NoData» parameter is checked.
The output NoData value can be set manually. The output rasters extent and
resolution is defined by a reference raster layer and is always of Int32 type.
См.также
Parameters
Basic parameters
Label |
Имя |
Тип |
Описание |
|---|---|---|---|
Input raster layers |
|
[raster] [list] |
List of raster layers to compare with |
Reference layer |
|
[raster] |
The reference layer for the output layer creation (extent, CRS, pixel dimensions) |
Ignore NoData values |
|
[boolean] Default: False |
If unchecked, any NoData cells in the data layer stack will result in a NoData cell in the output raster |
Output layer |
|
[raster] Default: |
Specification of the output raster containing the result. One of:
|
Advanced parameters
Label |
Имя |
Тип |
Описание |
|---|---|---|---|
Output no data value |
|
[number] Default: -9999.0 |
Value to use for nodata in the output layer |
Outputs
Label |
Имя |
Тип |
Описание |
|---|---|---|---|
Output layer |
|
[raster] |
Output raster layer containing the result |
CRS authority identifier |
|
[string] |
The coordinate reference system of the output raster layer |
Extent |
|
[string] |
The spatial extent of the output raster layer |
Width in pixels |
|
[integer] |
The number of columns in the output raster layer |
Height in pixels |
|
[integer] |
The number of rows in the output raster layer |
Total pixel count |
|
[integer] |
The count of pixels in the output raster layer |
Python code
Algorithm ID: native:highestpositioninrasterstack
import processing
processing.run("algorithm_id", {parameter_dictionary})
The algorithm id is displayed when you hover over the algorithm in the Processing Toolbox. The parameter dictionary provides the parameter NAMEs and values. See Изпользование алгоритмов геообработки в консоли for details on how to run processing algorithms from the Python console.
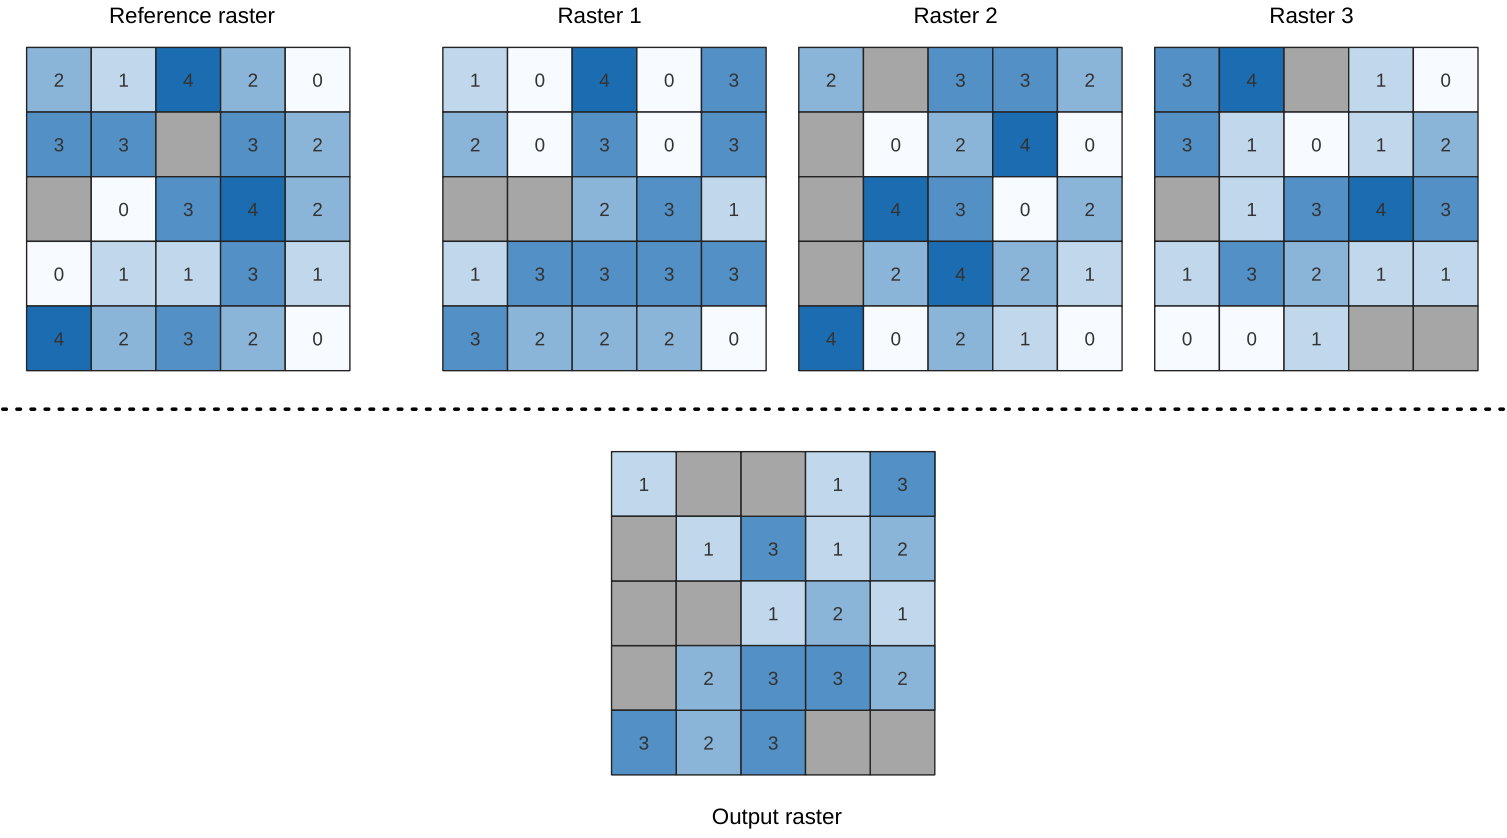
24.1.9.11. Less than frequency
Evaluates on a cell-by-cell basis the frequency (number of times) the values
of an input stack of rasters are less than the value of a value raster.
The output raster extent and resolution is defined by the input raster layer
and is always of Int32 type.
If multiband rasters are used in the data raster stack, the algorithm will always perform the analysis on the first band of the rasters - use GDAL to use other bands in the analysis. The output NoData value can be set manually.
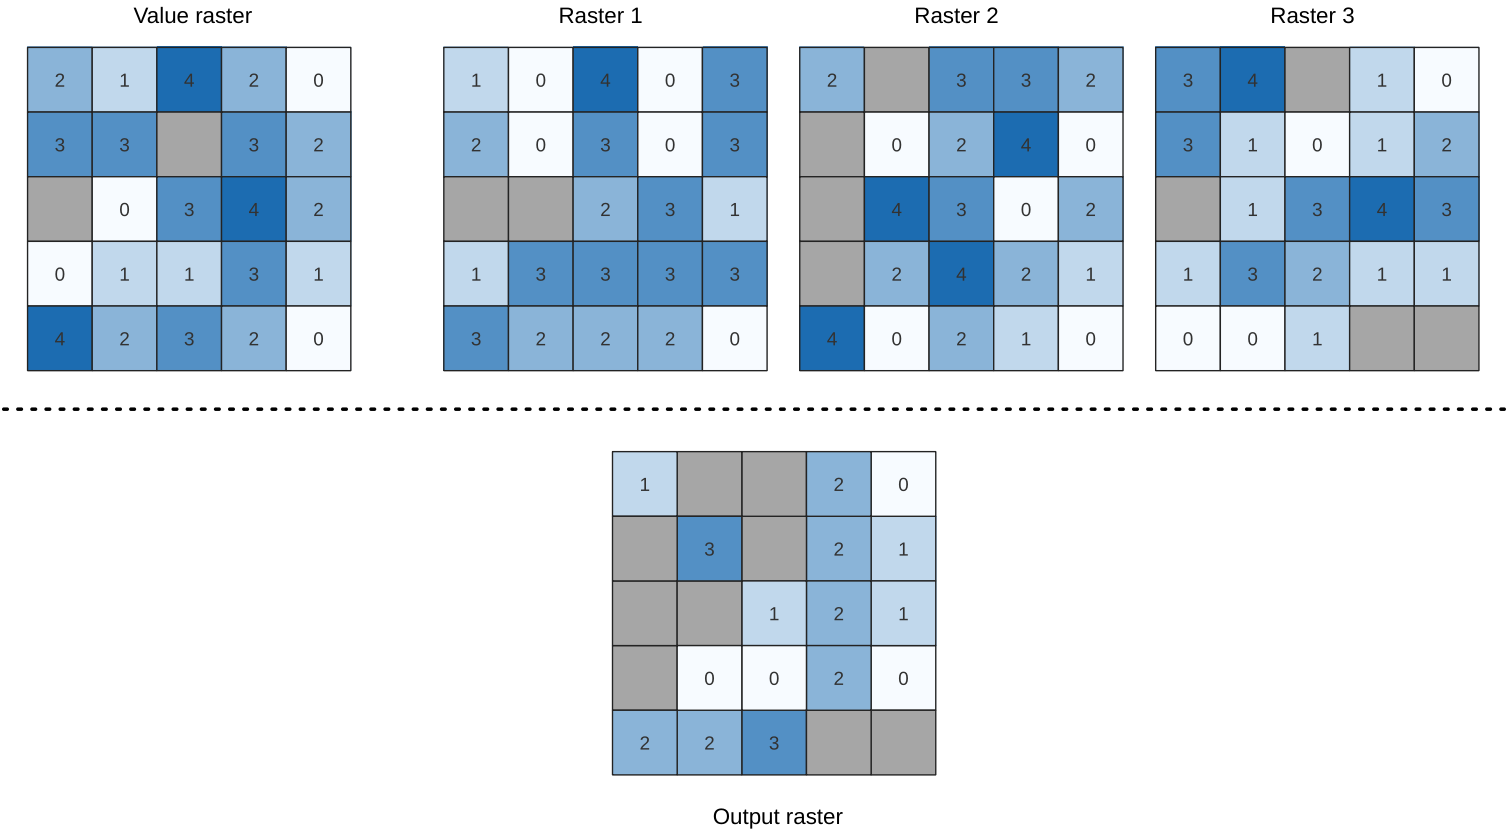
Рис. 24.12 For each cell in the output raster, the value represents the number of times
that the corresponding cells in the list of rasters are less than the value raster.
NoData cells (grey) are taken into account.
См.также
Parameters
Basic parameters
Label |
Имя |
Тип |
Описание |
|---|---|---|---|
Input value raster |
|
[raster] |
The input value layer serves as reference layer for the sample layers |
Value raster band |
|
[raster band] Default: The first band of the raster layer |
Select the band you want to use as sample |
Input raster layers |
|
[raster] [list] |
Raster layers to evaluate. If multiband rasters are used in the data raster stack, the algorithm will always perform the analysis on the first band of the rasters |
Ignore NoData values |
|
[boolean] Default: False |
If unchecked, any NoData cells in the value raster or the data layer stack will result in a NoData cell in the output raster |
Output layer |
|
[same as input] Default: |
Specification of the output raster. One of:
|
Advanced parameters
Label |
Имя |
Тип |
Описание |
|---|---|---|---|
Output no data value Optional |
|
[number] Default: -9999.0 |
Value to use for nodata in the output layer |
Outputs
Label |
Имя |
Тип |
Описание |
|---|---|---|---|
Output layer |
|
[raster] |
Output raster layer containing the result |
CRS authority identifier |
|
[string] |
The coordinate reference system of the output raster layer |
Extent |
|
[string] |
The spatial extent of the output raster layer |
Count of cells with equal value occurrences |
|
[number] |
|
Height in pixels |
|
[number] |
The number of rows in the output raster layer |
Total pixel count |
|
[integer] |
The count of pixels in the output raster layer |
Mean frequency at valid cell locations |
|
[number] |
|
Count of value occurrences |
|
[number] |
|
Width in pixels |
|
[integer] |
The number of columns in the output raster layer |
Python code
Algorithm ID: native:lessthanfrequency
import processing
processing.run("algorithm_id", {parameter_dictionary})
The algorithm id is displayed when you hover over the algorithm in the Processing Toolbox. The parameter dictionary provides the parameter NAMEs and values. See Изпользование алгоритмов геообработки в консоли for details on how to run processing algorithms from the Python console.
24.1.9.12. Lowest position in raster stack
Evaluates on a cell-by-cell basis the position of the raster with the lowest value in a stack of rasters. Position counts start with 1 and range to the total number of input rasters. The order of the input rasters is relevant for the algorithm. If multiple rasters feature the lowest value, the first raster will be used for the position value.
If multiband rasters are used in the data raster stack, the algorithm will
always perform the analysis on the first band of the rasters - use GDAL to use
other bands in the analysis.
Any NoData cells in the raster layer stack will result in a NoData cell
in the output raster unless the «ignore NoData» parameter is checked.
The output NoData value can be set manually. The output rasters extent and
resolution is defined by a reference raster layer and is always of Int32 type.
См.также
Parameters
Basic parameters
Label |
Имя |
Тип |
Описание |
|---|---|---|---|
Input raster layers |
|
[raster] [list] |
List of raster layers to compare with |
Reference layer |
|
[raster] |
The reference layer for the output layer creation (extent, CRS, pixel dimensions) |
Ignore NoData values |
|
[boolean] Default: False |
If unchecked, any NoData cells in the data layer stack will result in a NoData cell in the output raster |
Output layer |
|
[raster] Default: |
Specification of the output raster containing the result. One of:
|
Advanced parameters
Label |
Имя |
Тип |
Описание |
|---|---|---|---|
Output no data value |
|
[number] Default: -9999.0 |
Value to use for nodata in the output layer |
Outputs
Label |
Имя |
Тип |
Описание |
|---|---|---|---|
Output layer |
|
[raster] |
Output raster layer containing the result |
CRS authority identifier |
|
[string] |
The coordinate reference system of the output raster layer |
Extent |
|
[string] |
The spatial extent of the output raster layer |
Width in pixels |
|
[integer] |
The number of columns in the output raster layer |
Height in pixels |
|
[integer] |
The number of rows in the output raster layer |
Total pixel count |
|
[integer] |
The count of pixels in the output raster layer |
Python code
Algorithm ID: native:lowestpositioninrasterstack
import processing
processing.run("algorithm_id", {parameter_dictionary})
The algorithm id is displayed when you hover over the algorithm in the Processing Toolbox. The parameter dictionary provides the parameter NAMEs and values. See Изпользование алгоритмов геообработки в консоли for details on how to run processing algorithms from the Python console.
24.1.9.13. Raster boolean AND
Calculates the boolean AND for a set of input rasters.
If all of the input rasters have a non-zero value for a pixel, that
pixel will be set to 1 in the output raster.
If any of the input rasters have 0 values for the pixel it will
be set to 0 in the output raster.
The reference layer parameter specifies an existing raster layer to use as a reference when creating the output raster. The output raster will have the same extent, CRS, and pixel dimensions as this layer.
By default, a nodata pixel in ANY of the input layers will result in a
nodata pixel in the output raster.
If the Treat nodata values as false option is checked,
then nodata inputs will be treated the same as a 0 input value.
См.также
Parameters
Label |
Имя |
Тип |
Описание |
|---|---|---|---|
Input layers |
|
[raster] [list] |
List of input raster layers |
Reference layer |
|
[raster] |
The reference layer to create the output layer from (extent, CRS, pixel dimensions) |
Treat nodata values as false |
|
[boolean] Default: False |
Treat nodata values in the input files as 0 when performing the operation |
Output no data value |
|
[number] Default: -9999.0 |
Value to use for nodata in the output layer |
Output data type |
|
[enumeration] Default: 5 |
Output raster data type. Options:
|
Output layer |
|
[raster] |
Output raster layer |
Outputs
Label |
Имя |
Тип |
Описание |
|---|---|---|---|
Extent |
|
[extent] |
The extent of the output raster layer |
CRS authority identifier |
|
[crs] |
The coordinate reference system of the output raster layer |
Width in pixels |
|
[integer] |
The width in pixels of the output raster layer |
Height in pixels |
|
[integer] |
The height in pixels of the output raster layer |
Total pixel count |
|
[integer] |
The count of pixels in the output raster layer |
NODATA pixel count |
|
[integer] |
The count of nodata pixels in the output raster layer |
True pixel count |
|
[integer] |
The count of True pixels (value = 1) in the output raster layer |
False pixel count |
|
[integer] |
The count of False pixels (value = 0) in the output raster layer |
Output layer |
|
[raster] |
Output raster layer containing the result |
Python code
Algorithm ID: qgis:rasterbooleanand
import processing
processing.run("algorithm_id", {parameter_dictionary})
The algorithm id is displayed when you hover over the algorithm in the Processing Toolbox. The parameter dictionary provides the parameter NAMEs and values. See Изпользование алгоритмов геообработки в консоли for details on how to run processing algorithms from the Python console.
24.1.9.14. Raster boolean OR
Calculates the boolean OR for a set of input rasters.
If all of the input rasters have a zero value for a pixel, that
pixel will be set to 0 in the output raster.
If any of the input rasters have 1 values for the pixel it will
be set to 1 in the output raster.
The reference layer parameter specifies an existing raster layer to use as a reference when creating the output raster. The output raster will have the same extent, CRS, and pixel dimensions as this layer.
By default, a nodata pixel in ANY of the input layers will result in a
nodata pixel in the output raster.
If the Treat nodata values as false option is checked,
then nodata inputs will be treated the same as a 0 input value.
См.также
Parameters
Label |
Имя |
Тип |
Описание |
|---|---|---|---|
Input layers |
|
[raster] [list] |
List of input raster layers |
Reference layer |
|
[raster] |
The reference layer to create the output layer from (extent, CRS, pixel dimensions) |
Treat nodata values as false |
|
[boolean] Default: False |
Treat nodata values in the input files as 0 when performing the operation |
Output no data value |
|
[number] Default: -9999.0 |
Value to use for nodata in the output layer |
Output data type |
|
[enumeration] Default: 5 |
Output raster data type. Options:
|
Output layer |
|
[raster] |
Output raster layer |
Outputs
Label |
Имя |
Тип |
Описание |
|---|---|---|---|
Extent |
|
[extent] |
The extent of the output raster layer |
CRS authority identifier |
|
[crs] |
The coordinate reference system of the output raster layer |
Width in pixels |
|
[integer] |
The width in pixels of the output raster layer |
Height in pixels |
|
[integer] |
The height in pixels of the output raster layer |
Total pixel count |
|
[integer] |
The count of pixels in the output raster layer |
NODATA pixel count |
|
[integer] |
The count of nodata pixels in the output raster layer |
True pixel count |
|
[integer] |
The count of True pixels (value = 1) in the output raster layer |
False pixel count |
|
[integer] |
The count of False pixels (value = 0) in the output raster layer |
Output layer |
|
[raster] |
Output raster layer containing the result |
Python code
Algorithm ID: qgis:rasterbooleanor
import processing
processing.run("algorithm_id", {parameter_dictionary})
The algorithm id is displayed when you hover over the algorithm in the Processing Toolbox. The parameter dictionary provides the parameter NAMEs and values. See Изпользование алгоритмов геообработки в консоли for details on how to run processing algorithms from the Python console.
24.1.9.15. Raster calculator
Performs algebraic operations using raster layers.
The resulting layer will have its values computed according to an expression. The expression can contain numerical values, operators and references to any of the layers in the current project.
Примечание
When using the calculator in Интерфейс пакетной обработки or from
the Консоль QGIS Python the files to use have to be specified.
The corresponding layers are referred using the base name of the
file (without the full path).
For instance, if using a layer at path/to/my/rasterfile.tif,
the first band of that layer will be referred as
rasterfile.tif@1.
См.также
Parameters
Label |
Имя |
Тип |
Описание |
|---|---|---|---|
Layers |
GUI only |
Shows the list of all raster layers loaded in the legend.
These can be used to fill the expression box (double click to
add).
Raster layers are referred by their name and the number of the
band: |
|
Operators |
GUI only |
Contains some calculator like buttons that can be used to fill the expression box. |
|
Expression |
|
[string] |
Expression that will be used to calculate the output raster layer. You can use the operator buttons provided to type directly the expression in this box. |
Predefined expressions |
GUI only |
You can use the predefined |
|
Reference layer(s) (used for automated extent, cellsize, and CRS) Optional |
|
[raster] [list] |
Layer(s) that will be used to fetch extent, cell size and CRS.
By choosing the layer in this box you avoid filling in all the
other parameters by hand.
Raster layers are referred by their name and the number of
the band: |
Cell size (use 0 or empty to set it automatically) Optional |
|
[number] |
Cell size of the output raster layer. If the cell size is not specified, the minimum cell size of the selected reference layer(s) will be used. The cell size will be the same for the X and Y axes. |
Output extent (xmin, xmax, ymin, ymax) Optional |
|
[extent] |
Extent of the output raster layer. If the extent is not specified, the minimum extent that covers all the selected reference layers will be used. |
Output CRS Optional |
|
[crs] |
CRS of the output raster layer. If the output CRS is not specified, the CRS of the first reference layer will be used. |
Вывод |
|
[raster] Default: |
Specification of the output raster. One of:
The file encoding can also be changed here. |
Outputs
Label |
Имя |
Тип |
Описание |
|---|---|---|---|
Вывод |
|
[raster] |
Output raster file with the calculated values. |
Python code
Algorithm ID: qgis:rastercalculator
import processing
processing.run("algorithm_id", {parameter_dictionary})
The algorithm id is displayed when you hover over the algorithm in the Processing Toolbox. The parameter dictionary provides the parameter NAMEs and values. See Изпользование алгоритмов геообработки в консоли for details on how to run processing algorithms from the Python console.
24.1.9.16. Raster layer statistics
Calculates basic statistics from the values in a given band of the raster layer. The output is loaded in the menu.
Parameters
Label |
Имя |
Тип |
Описание |
|---|---|---|---|
Input layer |
|
[raster] |
Input raster layer |
Band number |
|
[raster band] Default: The first band of the input layer |
If the raster is multiband, choose the band you want to get statistics for. |
Вывод |
|
[html] Default: |
Specification of the output file:
The file encoding can also be changed here. |
Outputs
Label |
Имя |
Тип |
Описание |
|---|---|---|---|
Maximum value |
|
[number] |
|
Mean value |
|
[number] |
|
Minimum value |
|
[number] |
|
Вывод |
|
[html] |
The output file contains the following information:
|
Range |
|
[number] |
|
Standard deviation |
|
[number] |
|
Sum |
|
[number] |
|
Sum of the squares |
|
[number] |
Python code
Algorithm ID: qgis:rasterlayerstatistics
import processing
processing.run("algorithm_id", {parameter_dictionary})
The algorithm id is displayed when you hover over the algorithm in the Processing Toolbox. The parameter dictionary provides the parameter NAMEs and values. See Изпользование алгоритмов геообработки в консоли for details on how to run processing algorithms from the Python console.
24.1.9.17. Raster layer unique values report
Returns the count and area of each unique value in a given raster layer.
Parameters
Label |
Имя |
Тип |
Описание |
|---|---|---|---|
Input layer |
|
[raster] |
Input raster layer |
Band number |
|
[raster band] Default: The first band of the input layer |
If the raster is multiband, choose the band you want to get statistics for. |
Unique values report |
|
[file] Default: |
Specification of the output file:
The file encoding can also be changed here. |
Unique values table |
|
[table] Default: |
Specification of the table for unique values:
The file encoding can also be changed here. |
Outputs
Label |
Имя |
Тип |
Описание |
|---|---|---|---|
CRS authority identifier |
|
[crs] |
|
Extent |
|
[extent] |
|
Height in pixels |
|
[number] |
|
NODATA pixel count |
|
[number] |
|
Total pixel count |
|
[number] |
|
Unique values report |
|
[html] |
The output HTML file contains the following information:
|
Unique values table |
|
[table] |
A table with three columns:
|
Width in pixels |
|
[number] |
Python code
Algorithm ID: qgis:rasterlayeruniquevaluesreport
import processing
processing.run("algorithm_id", {parameter_dictionary})
The algorithm id is displayed when you hover over the algorithm in the Processing Toolbox. The parameter dictionary provides the parameter NAMEs and values. See Изпользование алгоритмов геообработки в консоли for details on how to run processing algorithms from the Python console.
24.1.9.18. Raster layer zonal statistics
Calculates statistics for a raster layer’s values, categorized by zones defined in another raster layer.
См.также
Parameters
Label |
Имя |
Тип |
Описание |
|---|---|---|---|
Input Layer |
|
[raster] |
Input raster layer |
Band number |
|
[raster band] Default: The first band of the raster layer |
If the raster is multiband choose the band for which you want to calculate the statistics. |
Zones layer |
|
[raster] |
Raster layer defining zones. Zones are given by contiguous pixels having the same pixel value. |
Zones band number |
|
[raster band] Default: The first band of the raster layer |
If the raster is multiband, choose the band that defines the zones |
Reference layer Optional |
|
[enumeration] Default: 0 |
Raster layer used to calculate the centroids that will be used as reference when determining the zones in the output layer. One of:
|
Statistics |
|
[table] |
Table with the calculated statistics |
Outputs
Label |
Имя |
Тип |
Описание |
|---|---|---|---|
CRS authority identifier |
|
[crs] |
|
Extent |
|
[extent] |
|
Height in pixels |
|
[number] |
|
NODATA pixel count |
|
[number] |
|
Statistics |
|
[table] |
The output layer contains the following information for each zone:
|
Total pixel count |
|
[number] |
|
Width in pixels |
|
[number] |
Python code
Algorithm ID: qgis:rasterlayerzonalstats
import processing
processing.run("algorithm_id", {parameter_dictionary})
The algorithm id is displayed when you hover over the algorithm in the Processing Toolbox. The parameter dictionary provides the parameter NAMEs and values. See Изпользование алгоритмов геообработки в консоли for details on how to run processing algorithms from the Python console.
24.1.9.19. Raster surface volume
Calculates the volume under a raster surface relative to a given base level. This is mainly useful for Digital Elevation Models (DEM).
Parameters
Label |
Имя |
Тип |
Описание |
|---|---|---|---|
INPUT layer |
|
[raster] |
Input raster, representing a surface |
Band number |
|
[raster band] Default: The first band of the raster layer |
If the raster is multiband, choose the band that shall define the surface. |
Base level |
|
[number] Default: 0.0 |
Define a base or reference value.
This base is used in the volume calculation according to the
|
Method |
|
[enumeration] Default: 0 |
Define the method for the volume calculation given by the
difference between the raster pixel value and the
|
Surface volume report |
|
[html] Default: |
Specification of the output HTML report. One of:
The file encoding can also be changed here. |
Surface volume table |
|
[table] Default: |
Specification of the output table. One of:
The file encoding can also be changed here. |
Outputs
Label |
Имя |
Тип |
Описание |
|---|---|---|---|
Volume |
|
[number] |
The calculated volume |
Area |
|
[number] |
The area in square map units |
Pixel_count |
|
[number] |
The total number of pixels that have been analyzed |
Surface volume report |
|
[html] |
The output report (containing volume, area and pixel count) in HTML format |
Surface volume table |
|
[table] |
The output table (containing volume, area and pixel count) |
Python code
Algorithm ID: qgis:rastersurfacevolume
import processing
processing.run("algorithm_id", {parameter_dictionary})
The algorithm id is displayed when you hover over the algorithm in the Processing Toolbox. The parameter dictionary provides the parameter NAMEs and values. See Изпользование алгоритмов геообработки в консоли for details on how to run processing algorithms from the Python console.
24.1.9.20. Reclassify by layer
Reclassifies a raster band by assigning new class values based on the ranges specified in a vector table.
Parameters
Label |
Имя |
Тип |
Описание |
|---|---|---|---|
Raster layer |
|
[raster] |
Raster layer to reclassify |
Band number |
|
[raster band] Default: The first band of the raster layer |
If the raster is multiband, choose the band you want to reclassify. |
Layer containing class breaks |
|
[vector: any] |
Vector layer containing the values to use for classification. |
Minimum class value field |
|
[tablefield: numeric] |
Field with the minimum value of the range for the class. |
Maximum class value field |
|
[tablefield: numeric] |
Field with the maximum value of the range for the class. |
Output value field |
|
[tablefield: numeric] |
Field with the value that will be assigned to the pixels that fall in the class (between the corresponding min and max values). |
Output no data value |
|
[number] Default: -9999.0 |
Value to apply to no data values. |
Range boundaries |
|
[enumeration] Default: 0 |
Defines comparison rules for the classification. Options:
|
Use no data when no range matches value |
|
[boolean] Default: False |
Values that do not belong to a class will result in the no data value. If False, the original value is kept. |
Output data type |
|
[enumeration] Default: 5 |
Defines the data type of the output raster file. Options:
|
Reclassified raster |
|
[raster] |
Specification of the output raster. One of:
The file encoding can also be changed here. |
Outputs
Label |
Имя |
Тип |
Описание |
|---|---|---|---|
Reclassified raster |
|
[raster] |
Output raster layer with reclassified band values |
Python code
Algorithm ID: qgis:reclassifybylayer
import processing
processing.run("algorithm_id", {parameter_dictionary})
The algorithm id is displayed when you hover over the algorithm in the Processing Toolbox. The parameter dictionary provides the parameter NAMEs and values. See Изпользование алгоритмов геообработки в консоли for details on how to run processing algorithms from the Python console.
24.1.9.21. Reclassify by table
Reclassifies a raster band by assigning new class values based on the ranges specified in a fixed table.
Parameters
Label |
Имя |
Тип |
Описание |
|---|---|---|---|
Raster layer |
|
[raster] |
Raster layer to reclassify |
Band number |
|
[raster band] Default: 1 |
Raster band for which you want to recalculate values. |
Reclassification table |
|
[table] |
A 3-columns table to fill with the values to set the boundaries
of each class ( |
Output no data value |
|
[number] Default: -9999.0 |
Value to apply to no data values. |
Range boundaries |
|
[enumeration] Default: 0 |
Defines comparison rules for the classification. Options:
|
Use no data when no range matches value |
|
[boolean] Default: False |
Applies the no data value to band values that do not fall in any class. If False, the original value is kept. |
Output data type |
|
[enumeration] Default: 5 |
Defines the format of the output raster file. Options:
|
Reclassified raster |
|
[raster] Default: „[Save to temporary file]“ |
Specification of the output raster layer. One of:
The file encoding can also be changed here |
Outputs
Label |
Имя |
Тип |
Описание |
|---|---|---|---|
Reclassified raster |
|
[raster] Default: „[Save to temporary file]“ |
The output raster layer. |
Python code
Algorithm ID: qgis:reclassifybytable
import processing
processing.run("algorithm_id", {parameter_dictionary})
The algorithm id is displayed when you hover over the algorithm in the Processing Toolbox. The parameter dictionary provides the parameter NAMEs and values. See Изпользование алгоритмов геообработки в консоли for details on how to run processing algorithms from the Python console.
24.1.9.22. Rescale raster
Rescales raster layer to a new value range, while preserving the shape (distribution) of the raster’s histogram (pixel values). Input values are mapped using a linear interpolation from the source raster’s minimum and maximum pixel values to the destination minimum and miximum pixel range.
By default the algorithm preserves the original NODATA value, but there is an option to override it.
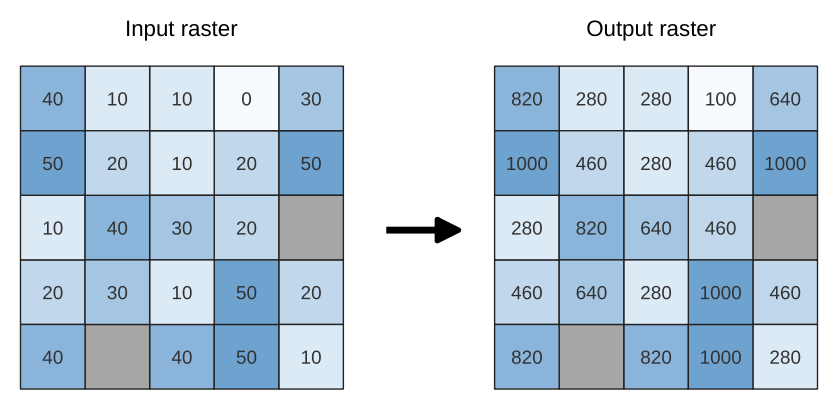
Рис. 24.13 Rescaling values of a raster layer from [0 - 50] to [100 - 1000]
Parameters
Label |
Имя |
Тип |
Описание |
|---|---|---|---|
Input Raster |
|
[raster] |
Raster layer to use for rescaling |
Band number |
|
[raster band] Default: The first band of the input layer |
If the raster is multiband, choose a band. |
New minimum value |
|
[number] Default value: 0.0 |
Minimum pixel value to use in the rescaled layer |
New maximum value |
|
[number] Default value: 255.0 |
Maximum pixel value to use in the rescaled layer |
New NODATA value Optional |
|
[number] Default value: Not set |
Value to assign to the NODATA pixels. If unset, original NODATA values are preserved. |
Rescaled |
|
[raster] Default: |
Specification of the output raster layer. One of:
|
Outputs
Label |
Имя |
Тип |
Описание |
|---|---|---|---|
Rescaled |
|
[raster] |
Output raster layer with rescaled band values |
Python code
Algorithm ID: native:rescaleraster
import processing
processing.run("algorithm_id", {parameter_dictionary})
The algorithm id is displayed when you hover over the algorithm in the Processing Toolbox. The parameter dictionary provides the parameter NAMEs and values. See Изпользование алгоритмов геообработки в консоли for details on how to run processing algorithms from the Python console.
24.1.9.23. Round raster
Rounds the cell values of a raster dataset according to the specified number of decimals.
Alternatively, a negative number of decimal places may be used to round values to powers of a base n. For example, with a Base value n of 10 and Decimal places of -1, the algorithm rounds cell values to multiples of 10, -2 rounds to multiples of 100, and so on. Arbitrary base values may be chosen, the algorithm applies the same multiplicative principle. Rounding cell values to multiples of a base n may be used to generalize raster layers.
The algorithm preserves the data type of the input raster. Therefore byte/integer rasters can only be rounded to multiples of a base n, otherwise a warning is raised and the raster gets copied as byte/integer raster.
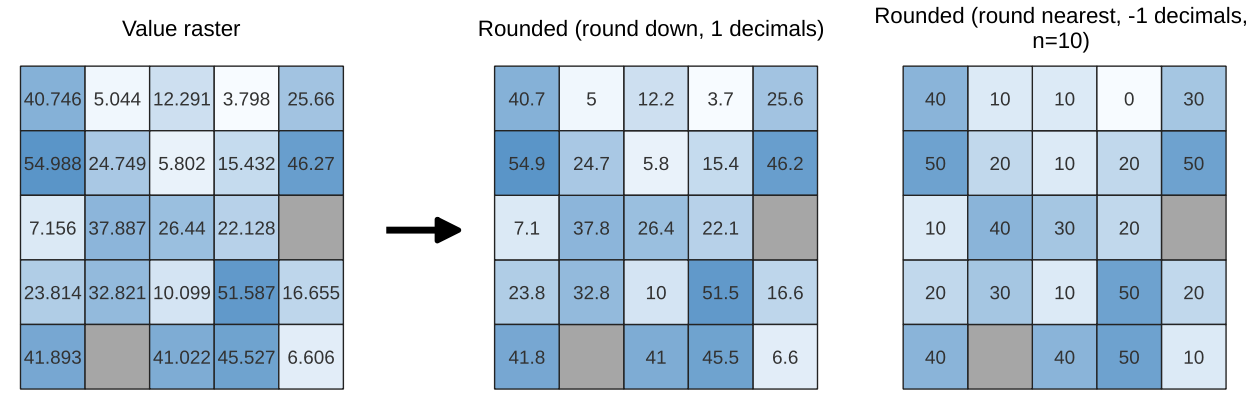
Рис. 24.14 Rounding values of a raster
Parameters
Basic parameters
Label |
Имя |
Тип |
Описание |
|---|---|---|---|
Input raster |
|
[raster] |
The raster to process. |
Band number |
|
[number] Default: 1 |
The band of the raster |
Rounding direction |
|
[list] Default: 1 |
How to choose the target rounded value. Options are: 0 - Round up 1 - Round to nearest 2 - Round down |
Number of decimals places |
|
[number] Default: 2 |
Number of decimals places to round to. Use negative values to round cell values to a multiple of a base n |
Output raster |
|
[raster] Default: |
Specification of the output file. One of:
|
Advanced parameters
Label |
Имя |
Тип |
Описание |
|---|---|---|---|
Base n for rounding to multiples of n |
|
[number] Default: 10 |
When the |
Outputs
Label |
Имя |
Тип |
Описание |
|---|---|---|---|
Output raster |
|
[raster] |
The output raster layer with values rounded for the selected band. |
Python code
Algorithm ID: native:roundrastervalues
import processing
processing.run("algorithm_id", {parameter_dictionary})
The algorithm id is displayed when you hover over the algorithm in the Processing Toolbox. The parameter dictionary provides the parameter NAMEs and values. See Изпользование алгоритмов геообработки в консоли for details on how to run processing algorithms from the Python console.
24.1.9.24. Sample raster values
Extracts raster values at the point locations. If the raster layer is multiband, each band is sampled.
The attribute table of the resulting layer will have as many new columns as the raster layer band count.
Parameters
Label |
Имя |
Тип |
Описание |
|---|---|---|---|
Input Point Layer |
|
[vector: point] |
Point vector layer to use for sampling |
Raster Layer to sample |
|
[raster] |
Raster layer to sample at the given point locations. |
Output column prefix |
|
[string] Default: „rvalue“ |
Prefix for the names of the added columns. |
Sampled Points Optional |
|
[vector: point] Default: |
Specify the output layer containing the sampled values. One of:
The file encoding can also be changed here. |
Outputs
Label |
Имя |
Тип |
Описание |
|---|---|---|---|
Sampled Points Optional |
|
[vector: point] |
The output layer containing the sampled values. |
Python code
Algorithm ID: qgis:rastersampling
import processing
processing.run("algorithm_id", {parameter_dictionary})
The algorithm id is displayed when you hover over the algorithm in the Processing Toolbox. The parameter dictionary provides the parameter NAMEs and values. See Изпользование алгоритмов геообработки в консоли for details on how to run processing algorithms from the Python console.
24.1.9.25. Zonal histogram
Appends fields representing counts of each unique value from a raster layer contained within polygon features.
The output layer attribute table will have as many fields as the unique values of the raster layer that intersects the polygon(s).
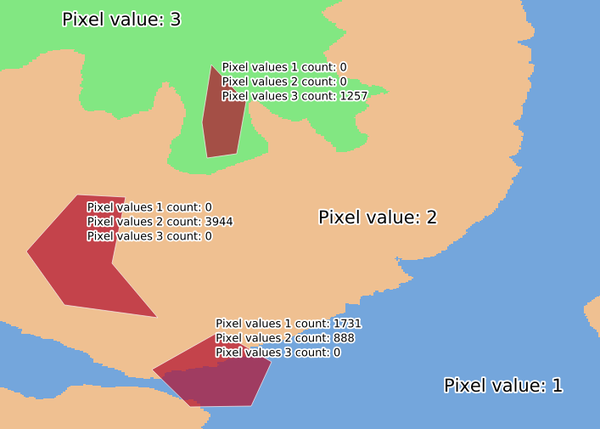
Рис. 24.15 Raster layer histogram example
Parameters
Label |
Имя |
Тип |
Описание |
|---|---|---|---|
Raster layer |
|
[raster] |
Input raster layer. |
Band number |
|
[raster band] Default: The first band of the input layer |
If the raster is multiband, choose a band. |
Vector layer containing zones |
|
[vector: polygon] |
Vector polygon layer that defines the zones. |
Output column prefix |
Optional |
[string] Default: „HISTO_“ |
Prefix for the output columns names. |
Output zones |
|
[vector: polygon] Default: |
Specify the output vector polygon layer. One of:
The file encoding can also be changed here. |
Outputs
Label |
Имя |
Тип |
Описание |
|---|---|---|---|
Output zones Optional |
|
[vector: polygon] Default: |
The output vector polygon layer. |
Python code
Algorithm ID: qgis:zonalhistogram
import processing
processing.run("algorithm_id", {parameter_dictionary})
The algorithm id is displayed when you hover over the algorithm in the Processing Toolbox. The parameter dictionary provides the parameter NAMEs and values. See Изпользование алгоритмов геообработки в консоли for details on how to run processing algorithms from the Python console.
24.1.9.26. Zonal statistics
Calculates statistics of a raster layer for each feature of an overlapping polygon vector layer.
Prior to QGIS 3.16, the algorithm edited the layer in-place, adding the new statistics fields to it. Now, it outputs a new layer with these statistics.
Parameters
Label |
Имя |
Тип |
Описание |
|---|---|---|---|
Input layer |
|
[vector: polygon] |
Vector polygon layer that contains the zones. |
Raster layer |
|
[raster] |
Input raster layer. |
Raster band |
|
[raster band] Default: The first band of the input layer |
If the raster is multiband, choose a band for the statistics. |
Output column prefix |
|
[string] Default: „_“ |
Prefix for the output columns names. |
Statistics to calculate |
|
[enumeration] [list] Default: [0,1,2] |
List of statistical operator for the output. Options:
|
Zonal Statistics |
|
[vector: polygon] Default: |
Specify the output vector polygon layer. One of:
The file encoding can also be changed here. |
Outputs
Label |
Имя |
Тип |
Описание |
|---|---|---|---|
Zonal Statistics |
|
[vector: polygon] |
The zone vector layer with added statistics. |
Python code
Algorithm ID: qgis:zonalstatisticsfb
import processing
processing.run("algorithm_id", {parameter_dictionary})
The algorithm id is displayed when you hover over the algorithm in the Processing Toolbox. The parameter dictionary provides the parameter NAMEs and values. See Изпользование алгоритмов геообработки в консоли for details on how to run processing algorithms from the Python console.