6.1. Lesson: データを再投影および変換する
Let us talk about Coordinate Reference Systems (CRSs) again. We have touched on this briefly before, but haven't discussed what it means practically.
このレッスンの目標: ベクターデータセットの再投影および変換をします。
6.1.1.  Follow Along: 投影法
The CRS that all the data, as well as the map itself are in right now is called WGS84. This is a very common Geographic Coordinate System (GCS) for representing data. But there's a problem, as we will see.
Save your current map
Then open the map of the world which you will find under
exercise_data/world/world.qgsZoom in to South Africa by using the Zoom In tool
Try setting a scale in the Scale field, which is in the Statusbar along the bottom of the screen. While over South Africa, set this value to
1:5 000 000(one to five million).Pan around the map while keeping an eye on the Scale field
Notice the scale changing? That's because you are moving away from the
one point that you zoomed into at 1:5 000 000, which was at the
center of your screen.
All around that point, the scale is different.
理由を理解するために、地球の世界を考えます。それは北から南に沿って引かれる線があります。これらの経線は赤道で遠く離れますが、極で出会います。
In a GCS, you are working on this sphere, but your screen is flat. When you try to represent the sphere on a flat surface, distortion occurs, similar to what would happen if you cut open a tennis ball and tried to flatten it out. What this means on a map is that the longitude lines stay equally far apart from each other, even at the poles (where they are supposed to meet). This means that, as you travel away from the equator on your map, the scale of the objects that you see gets larger and larger. What this means for us, practically, is that there is no constant scale on our map!
この問題を解決するため、かわりに投影座標系(PCS)を使用してみましょう。PCSでは縮尺変更のための余裕を作り、それを修正する方法でデータを「投影」または変換します。そのため、一定の縮尺を維持するために、PCSを使用するために私たちのデータを投影変換する必要があります。
6.1.2. Follow Along: 「その場で」再投影
By default, QGIS reprojects data "on the fly". What this means is that even if the data itself is in another CRS, QGIS can project it as if it were in a CRS of your choice.
You can change the CRS of the project by clicking on the
 Current projection button in the bottom
right corner of QGIS.
Current projection button in the bottom
right corner of QGIS.
In the dialog that appears, type the word
globalinto the Filter field. A few CRSs should appear in the Predefined Reference Systems field below.Select WGS 84 / NSIDC EASE-Grid 2.0 Global | EPSG:6933 entry by clicking on it, and then click OK.
南アフリカの形状が変化するのに注意してください。すべて投影法の変更によって地球の見た目としての形状が変わります。
Zoom to a scale of
1:5 000 000again, as before.地図をパンニングします。
縮尺は同じであることに注意します!
「その場で」再投影は異なるCRSのデータセットを組み合わせて使う際にも用いられます。
Add another vector layer to your map which has the data for South Africa only. You will find it as
exercise_data/world/RSA.shp.Load it. A quick way to see its CRS is by hovering the mouse over the layer in the legend. It is
EPSG:3410.何に気づきますか?
The layer is visible even if it has a different CRS from the continents one.
6.1.3.  Follow Along: 他のCRSに設定したデータセットの保存
Sometimes you need to export an existing dataset with another CRS. As we will see in the next lesson, if you need to make distance calculations on layer, it is always better to have the layer in a projected coordinate system.
Be aware that the 'on the fly' reprojection is related to the project and not to single layers. This means that a layer can have a different CRS from the project even if you see it in the correct position.
You can easily export the layer with another CRS.
Add the
buildingsdataset fromtraining_data.gpkgRight-click on the
buildingslayer in the Layers panelSelect in the menu that appears. You will be shown the Save Vector Layer as... dialog.
Click on the Browse button next to the File name field
Navigate to
exercise_data/and specify the name of the new layer asbuildings_reprojected.shp.Change the value of the CRS. Only the recent CRSs used will be shown in the drop-down menu. Click on the
 Select projection button next
to the drop-down menu.
Select projection button next
to the drop-down menu.The Coordinate Reference System Selector dialog will appear. In its Filter field, search for
34S.Select WGS 84 / UTM zone 34S | EPSG:32734 from the list
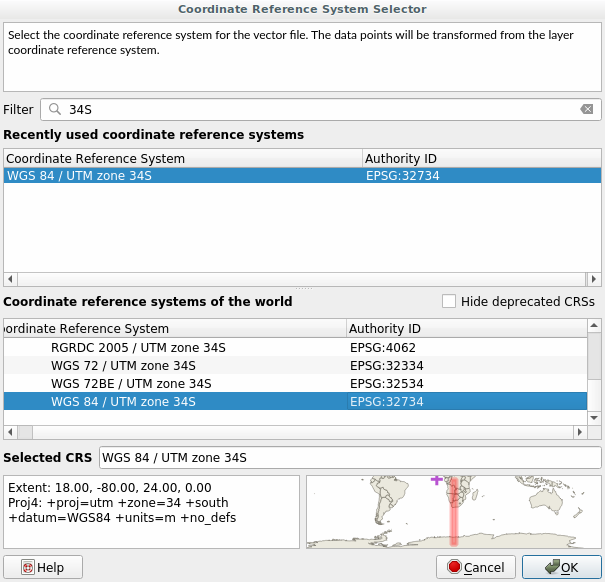
Leave the other options unchanged. The Save Vector Layer as... dialog now looks like this:
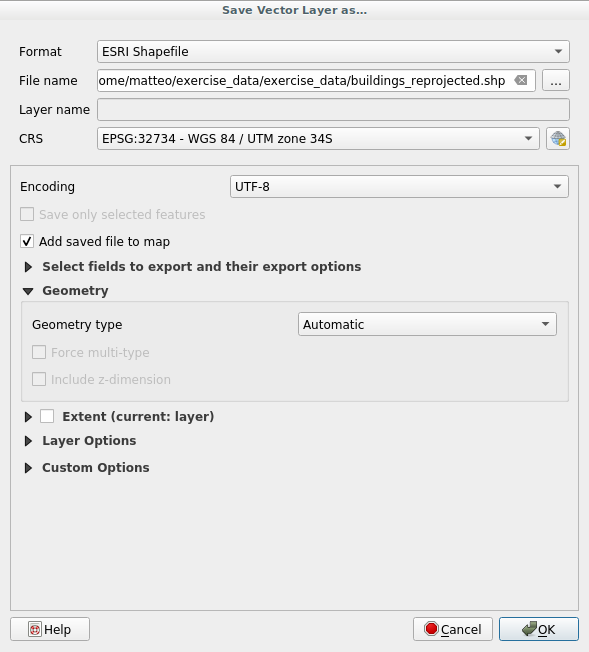
OK をクリックします
You can now compare the old and new projections of the layer and see that they are in two different CRS but they are still overlapping.
6.1.4.  Follow Along: 独自の投影法の作成
投影はデフォルトでQGISに含まれるものだけよりも多くあります。自身の投影も作成できます。
Start a new map
Load the
world/oceans.shpdatasetGo to and you will see this dialog.
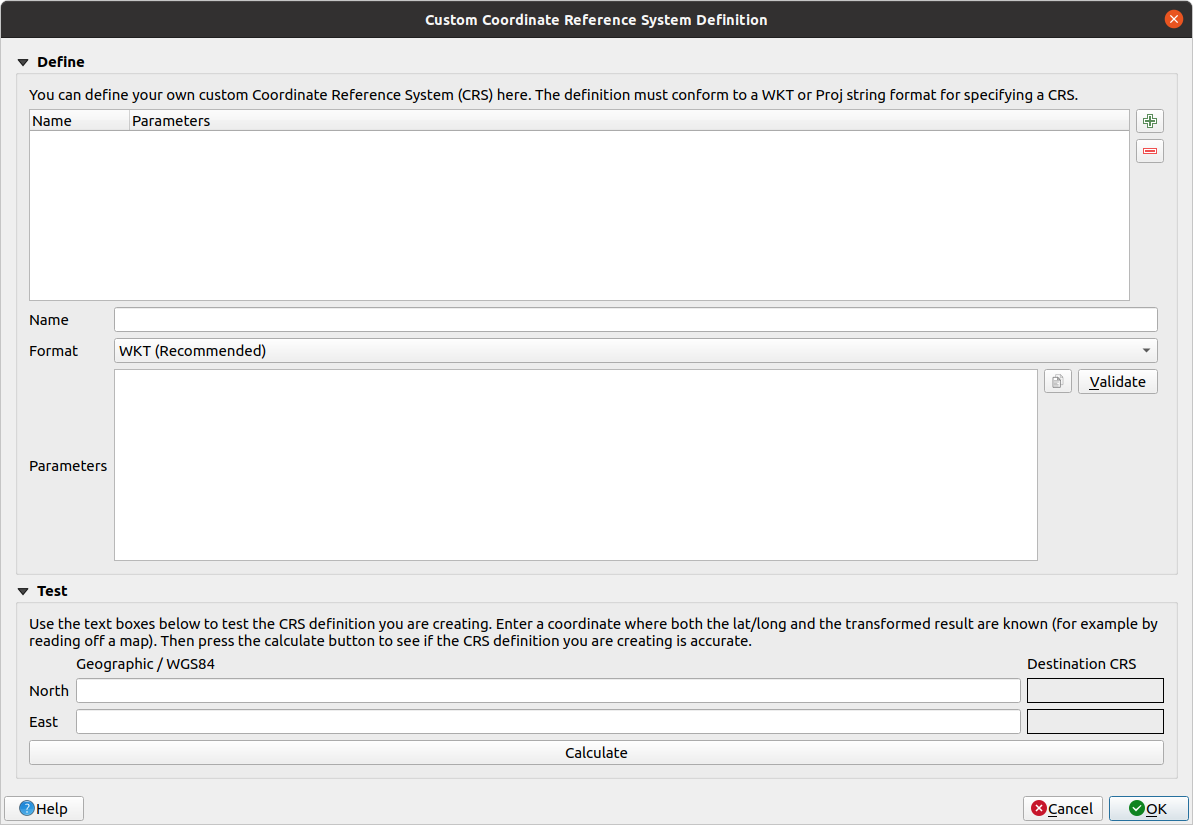
Click on the
 Add new CRS button to create a new
projection
Add new CRS button to create a new
projectionAn interesting projection to use is called
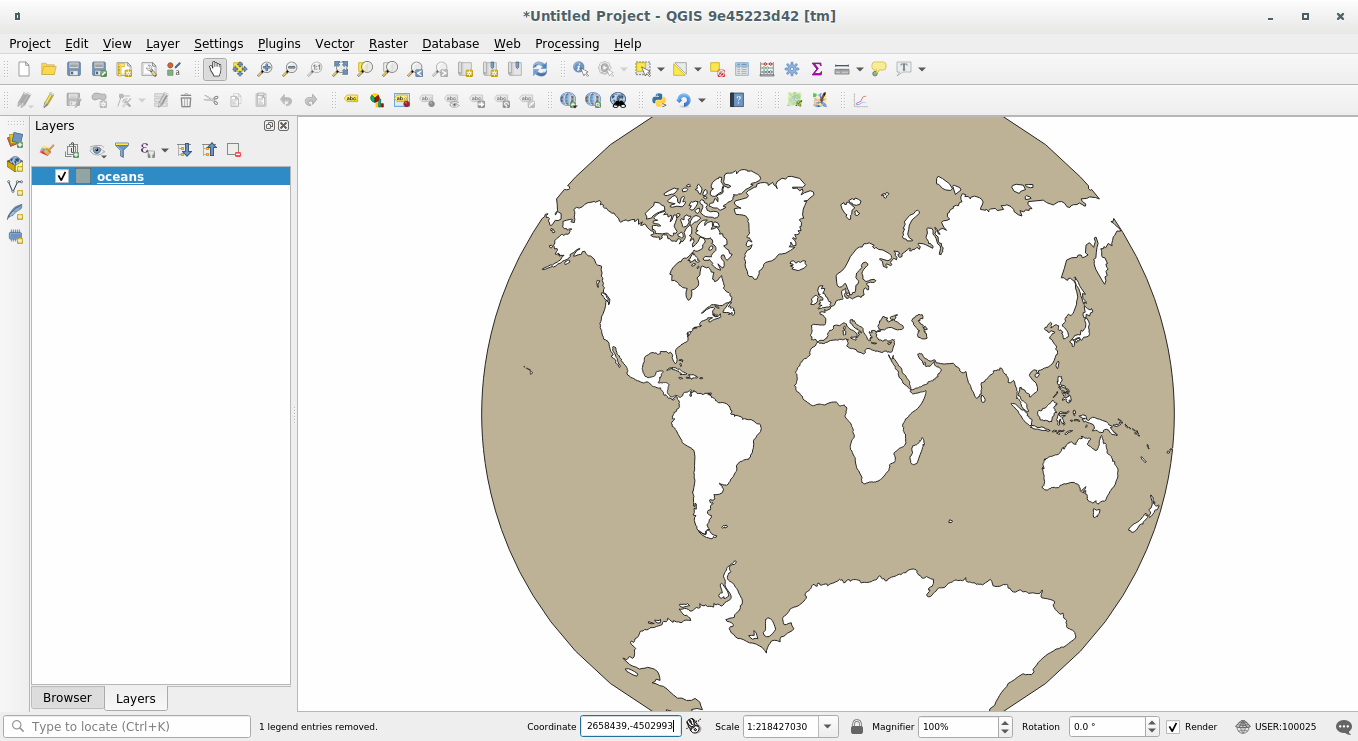
Van der Grinten I. Enter its name in the Name field.他のほとんどの投影がそうであるように、この投影は、長方形のものの代わりに円形フィールドに地球を表します。
In Format, select WKT (Recommended)
Add the following string in the Parameters field:
PROJCRS["unknown",
    BASEGEOGCRS["unknown",
        DATUM["unknown",
            ELLIPSOID["unknown",6371000,0,
                LENGTHUNIT["metre",1,
                    ID["EPSG",9001]]]],
        PRIMEM["Greenwich",0,
            ANGLEUNIT["degree",0.0174532925199433],
            ID["EPSG",8901]]],
    CONVERSION["unknown",
        METHOD["Van Der Grinten"],
        PARAMETER["Longitude of natural origin",0,
            ANGLEUNIT["degree",0.0174532925199433],
            ID["EPSG",8802]],
        PARAMETER["False easting",0,
            LENGTHUNIT["metre",1],
            ID["EPSG",8806]],
        PARAMETER["False northing",0,
            LENGTHUNIT["metre",1],
            ID["EPSG",8807]]],
    CS[Cartesian,2],
        AXIS["(E)",east,
            ORDER[1],
            LENGTHUNIT["metre",1,
                ID["EPSG",9001]]],
        AXIS["(N)",north,
            ORDER[2],
            LENGTHUNIT["metre",1,
                ID["EPSG",9001]]]]
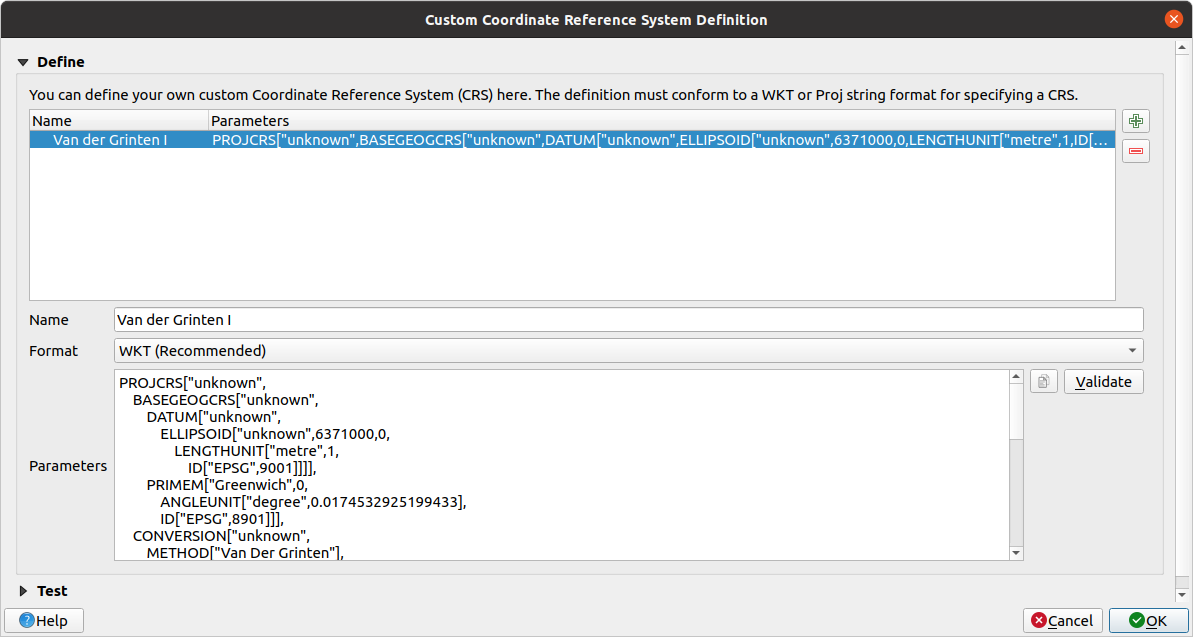
OK をクリックします
Click on the
Current CRS button at the
right of the status bar to change the project CRSChoose your newly defined projection (search for its name in the Filter field)
この投影法を適用するため地図は再投影され、したがって:
6.1.5. In Conclusion
異なる投影は、異なる目的のために有用です。正しい投影を選択することにより、地図上の地物が正確に表現されていることを確認できます。
6.1.6. Further Reading
Materials for the Advanced section of this lesson were taken from this article.
Read further information on Coordinate Reference Systems.
6.1.7. What's Next?
In the next lesson you will learn how to analyze vector data using QGIS' various vector analysis tools.