6.3. Lesson: ネットワーク分析
Calculating the shortest distance between two points is a common GIS task. Tools for this can be found in the Processing Toolbox.
このレッスンの目的 ネットワーク分析 アルゴリズムを使うことを学びます。
6.3.1.  Follow Along: ツールとデータ
すべてのネットワーク解析アルゴリズムは メニューにあります。利用可能なツールがたくさんあることがわかります:
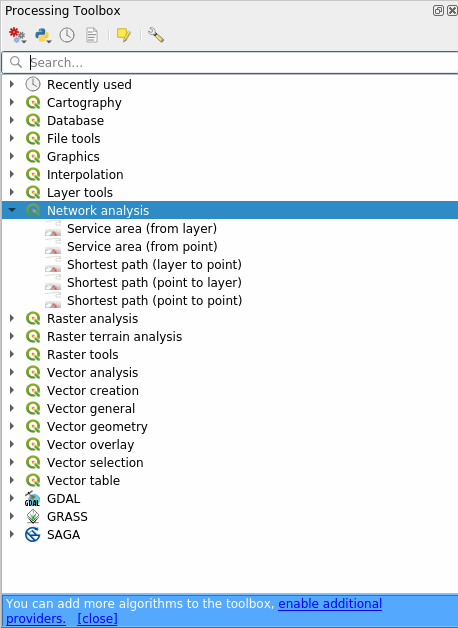
Open the project exercise_data/network_analysis/network.qgz.
It contains two layers:
network_pointsnetwork_lines
The network_lines layer has already a style that helps to understand the road network.
最短経路ツールは、ネットワークの2点間の最短経路または最短経路を計算する方法を提供します。
start and end points selected on the map
start point selected on the map and end points taken from a point layer
start points taken from a point layer and end point selected on the map
では始めましょう。
6.3.2. 最短経路を計算する(点から点へ)
を使うと、地図上で手動で選択した2点間の最短距離を計算できます。
In this example we will calculate the shortest (not fastest) path between two points.
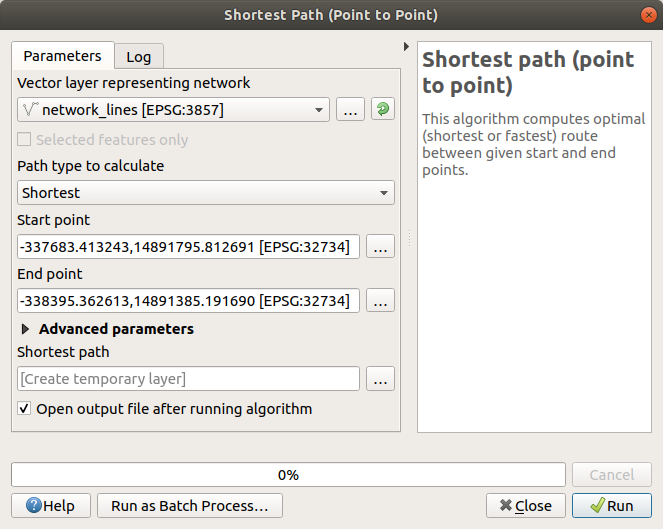
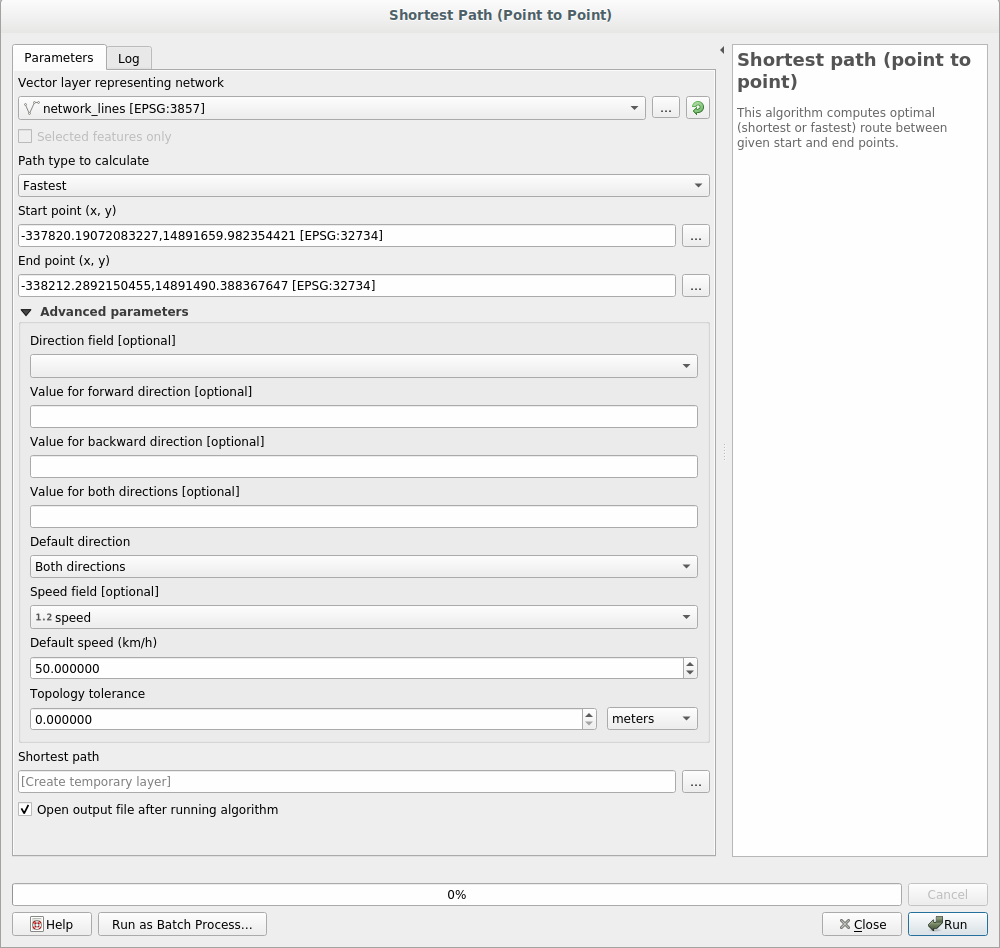
Open the Shortest path (point to point) algorithm
Select network_lines for Vector layer representing network
Use
Shortestfor Path type to calculateUse these two points as starting and ending points for the analysis:
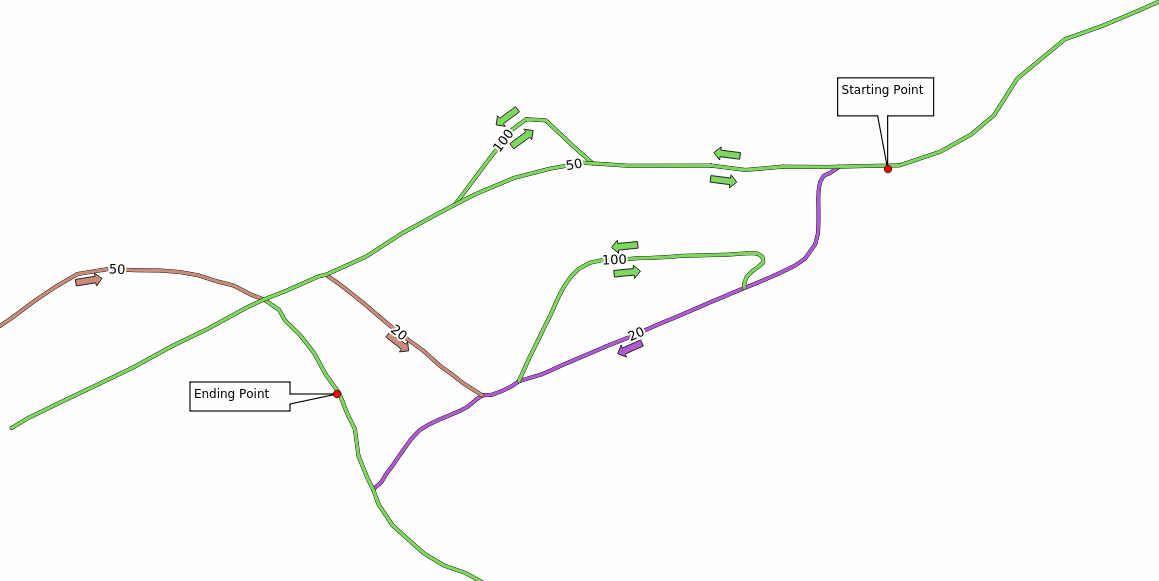
Click on the ... button next to Start point (x, y) and choose the location tagged with
Starting Pointin the picture. The coordinates of the clicked point are added.Do the same thing, but choosing the location tagged with
Ending pointfor End point (x, y)実行 ボタンをクリックします:
A new line layer is created representing the shortest path between the chosen points. Uncheck the
network_lineslayer to see the result better: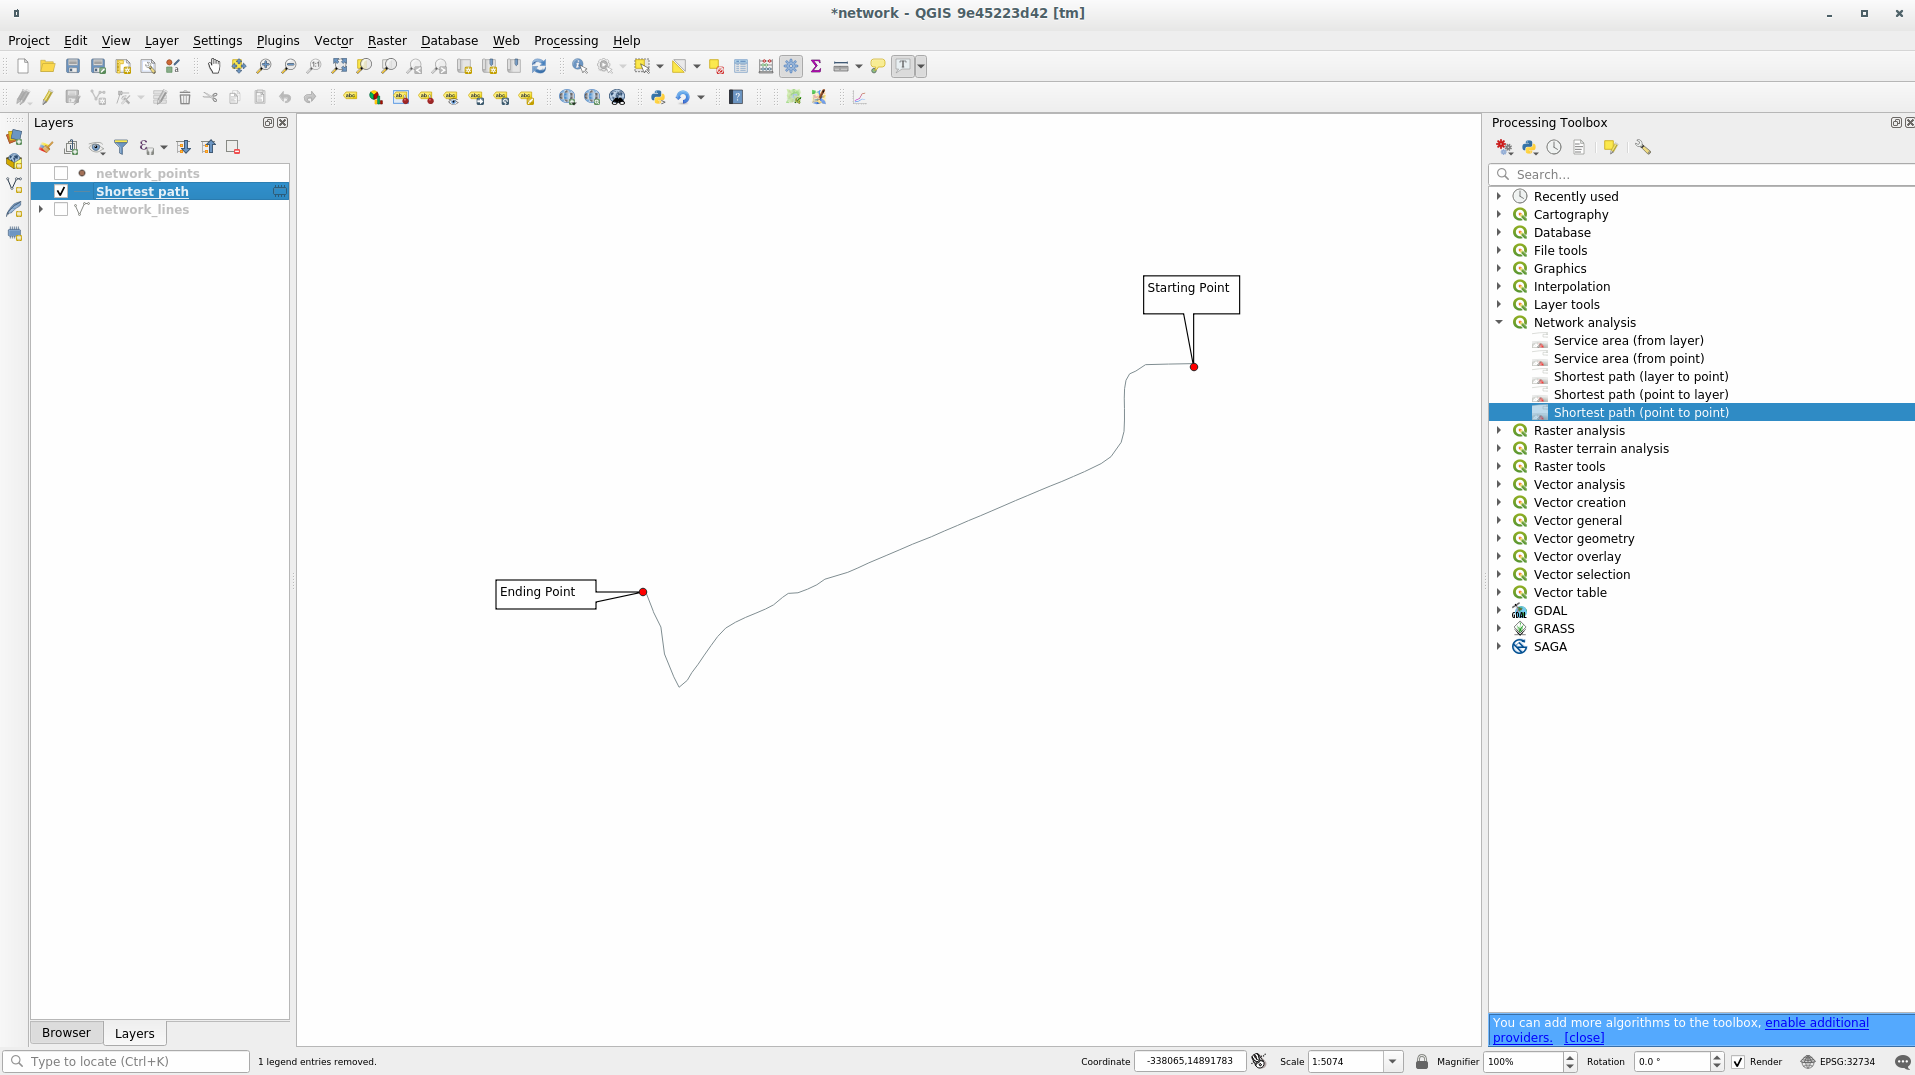
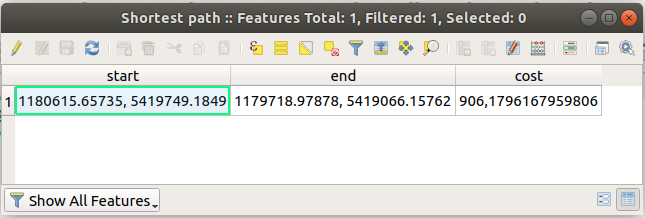
Open the attribute table of the output layer. It contains three fields, representing the coordinates of the start and end points and the cost.
最短を:guilabel:計算するパスの種類 として選択したので、 コスト は2つの位置間の 距離 をレイヤ単位で表します。この場合、選択された点の間の 最短 の距離は約1000メートルです。
Now that you know how to use the tool, feel free to test other locations.
6.3.3.  Try Yourself 最速径路
前の演習と同じデータを使用して、2点間の最速経路を計算してみます。
始点から終点までどのくらいの時間が必要ですか?
6.3.4. Follow Along: Advanced options
Let us explore some more options of the Network Analysis tools. In the previous exercise we calculated the fastest route between two points. As you can imagine, the time depends on the travel speed.
We will use the same layers and starting and ending points of the previous exercises.
Open the Shortest path (point to point) algorithm
Fill the Input layer, Start point (x, y) and End point (x, y) as we did before
Choose
Fastestas the Path type to calculateOpen the Advanced parameter menu
Change the Default speed (km/h) from the default
50value to4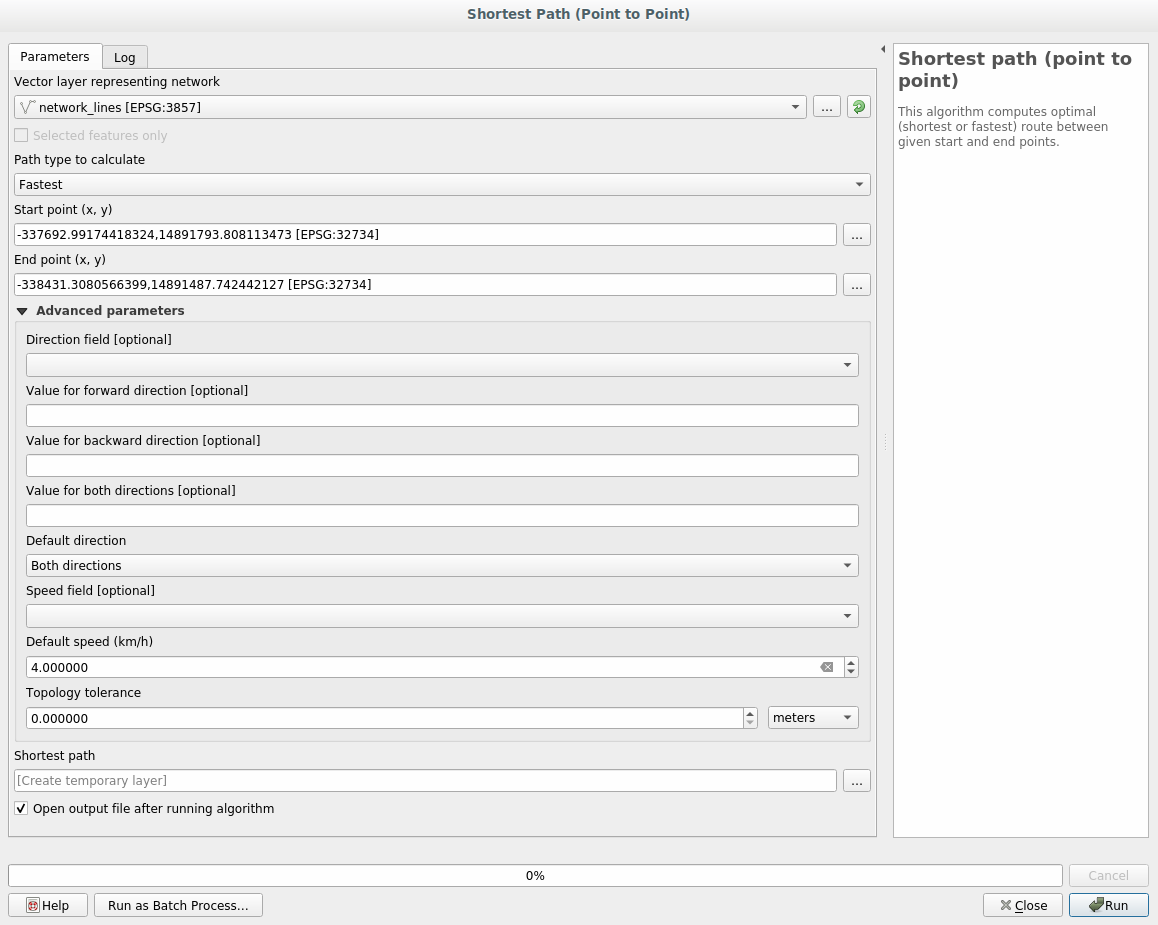
Click on Run
アルゴリズムが終了したら、ダイアログを閉じて、出力レイヤの属性テーブルを開きます。
The cost field contains the value according to the speed parameter you have chosen. We can convert the cost field from hours with fractions to the more readable minutes values.
 アイコンをクリックしてフィールド計算機を開き、 コスト フィールドに60を掛けて新しいフィールド 分 を追加します。
おしまい!これで、ある地点から別の地点までの所要時間がわかります。
6.3.5.  Shortest path with speed limit
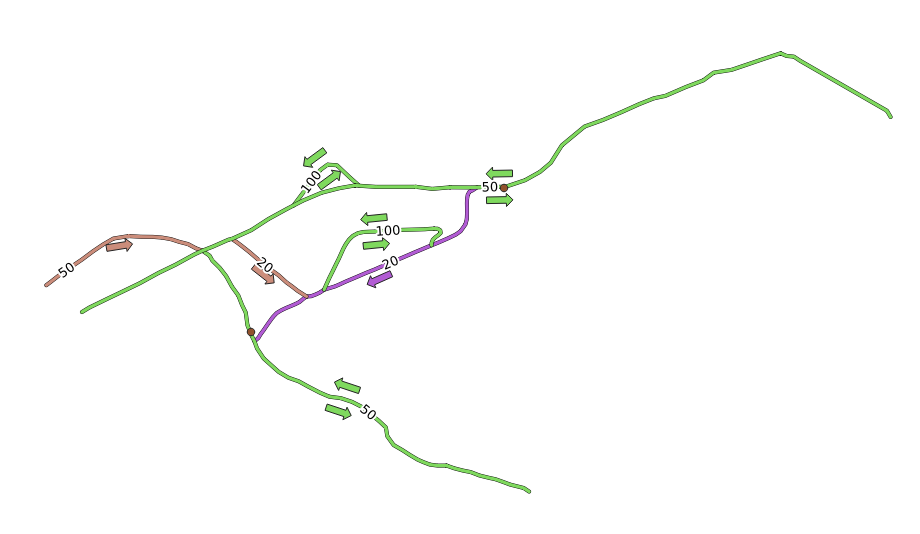
ネットワーク解析ツールボックスには他にも興味深いオプションがあります。次の地図を見てください:
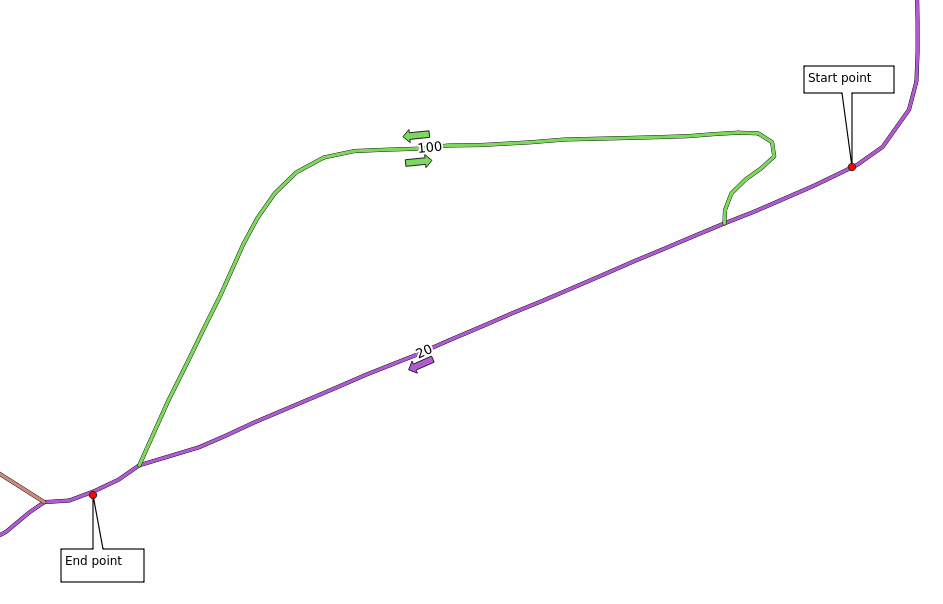
各道路の制限速度を考慮した 最速 ルートを知りたい(ラベルは 制限速度 をkm / hで表しています)。制限速度を考慮しない最短経路はもちろん紫色の経路になります。しかし、その道路では制限速度20 km / hですが、緑色の道路では100 km / h出せます!
最初の練習でやったように、 を使用して、手動で始点と終点を選びます。
Open the algorithm
Select network_lines for the Vector layer representing network parameter
Choose
Fastestas the Path type to calculateClick on the ... button next to the Start point (x, y) and choose the start point.
Do the same thing for End point (x, y)
Open the Advanced parameters menu
Choose the speed field as the Speed Field parameter. With this option the algorithm will take into account the speed limits for each road.
Click on the Run button
Turn off the
network_lineslayer to better see the result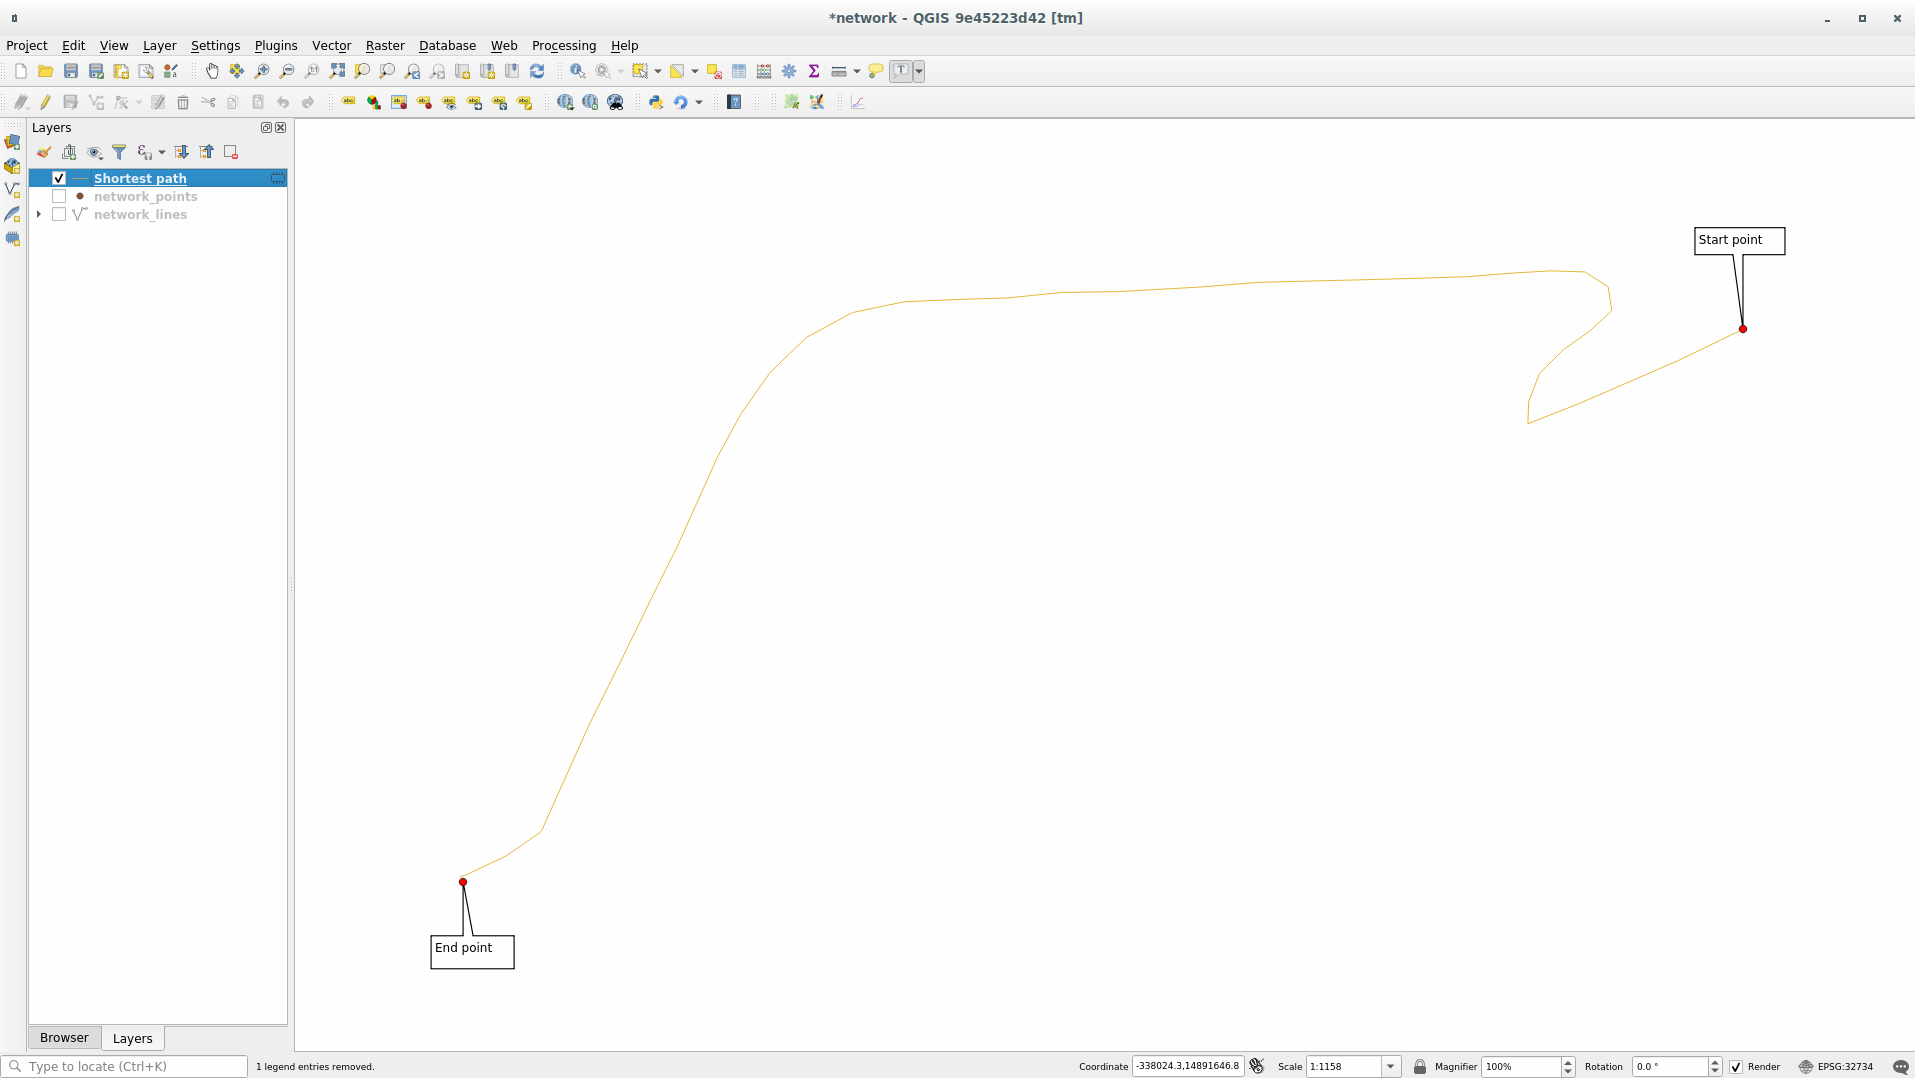
ご覧のとおり、最速ルートは最短ルートに対応していません。
6.3.6. サービスエリア(レイヤーから)
アルゴリズムで質問に答えることができます:ポイントレイヤが与えられ、距離または時間の値が与えられると到達可能なすべてのエリアはどうなりますか?
注釈
The is the same algorithm, but it allows you to manually choose the point on the map.
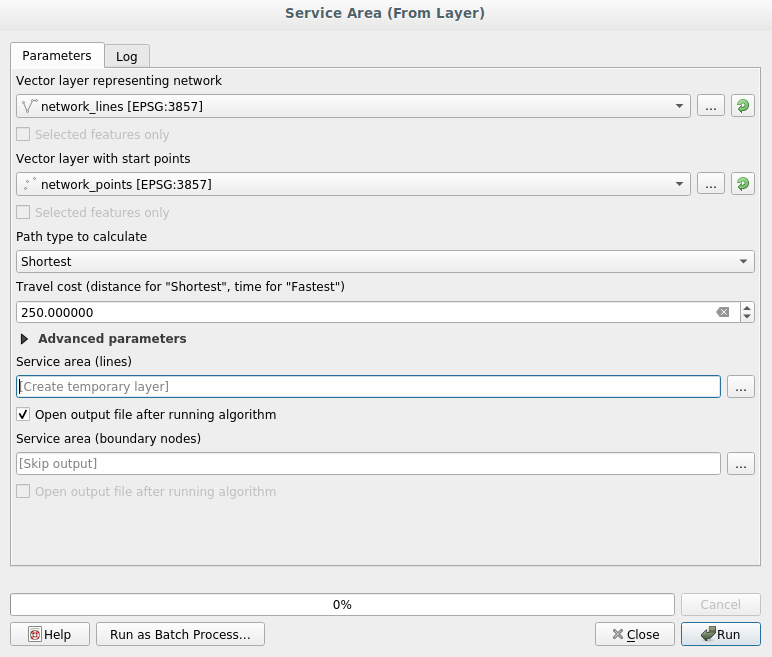
``250``メートルの距離が与えられたとして、 network_points レイヤーの各ポイントからどれだけネットワーク上を移動できるか知りたいのです。
Uncheck all the layers except
network_pointsOpen the algorithm
Choose
network_linesfor Vector layer representing networkChoose
network_pointsfor Vector layer with start pointsChoose
Shortestin Path type to calculateEnter
250for the Travel cost parameterClick on Run and close the dialog
出力レイヤは、250メートルの距離を与えられてポイント地物から到達できる最大径路を表します。
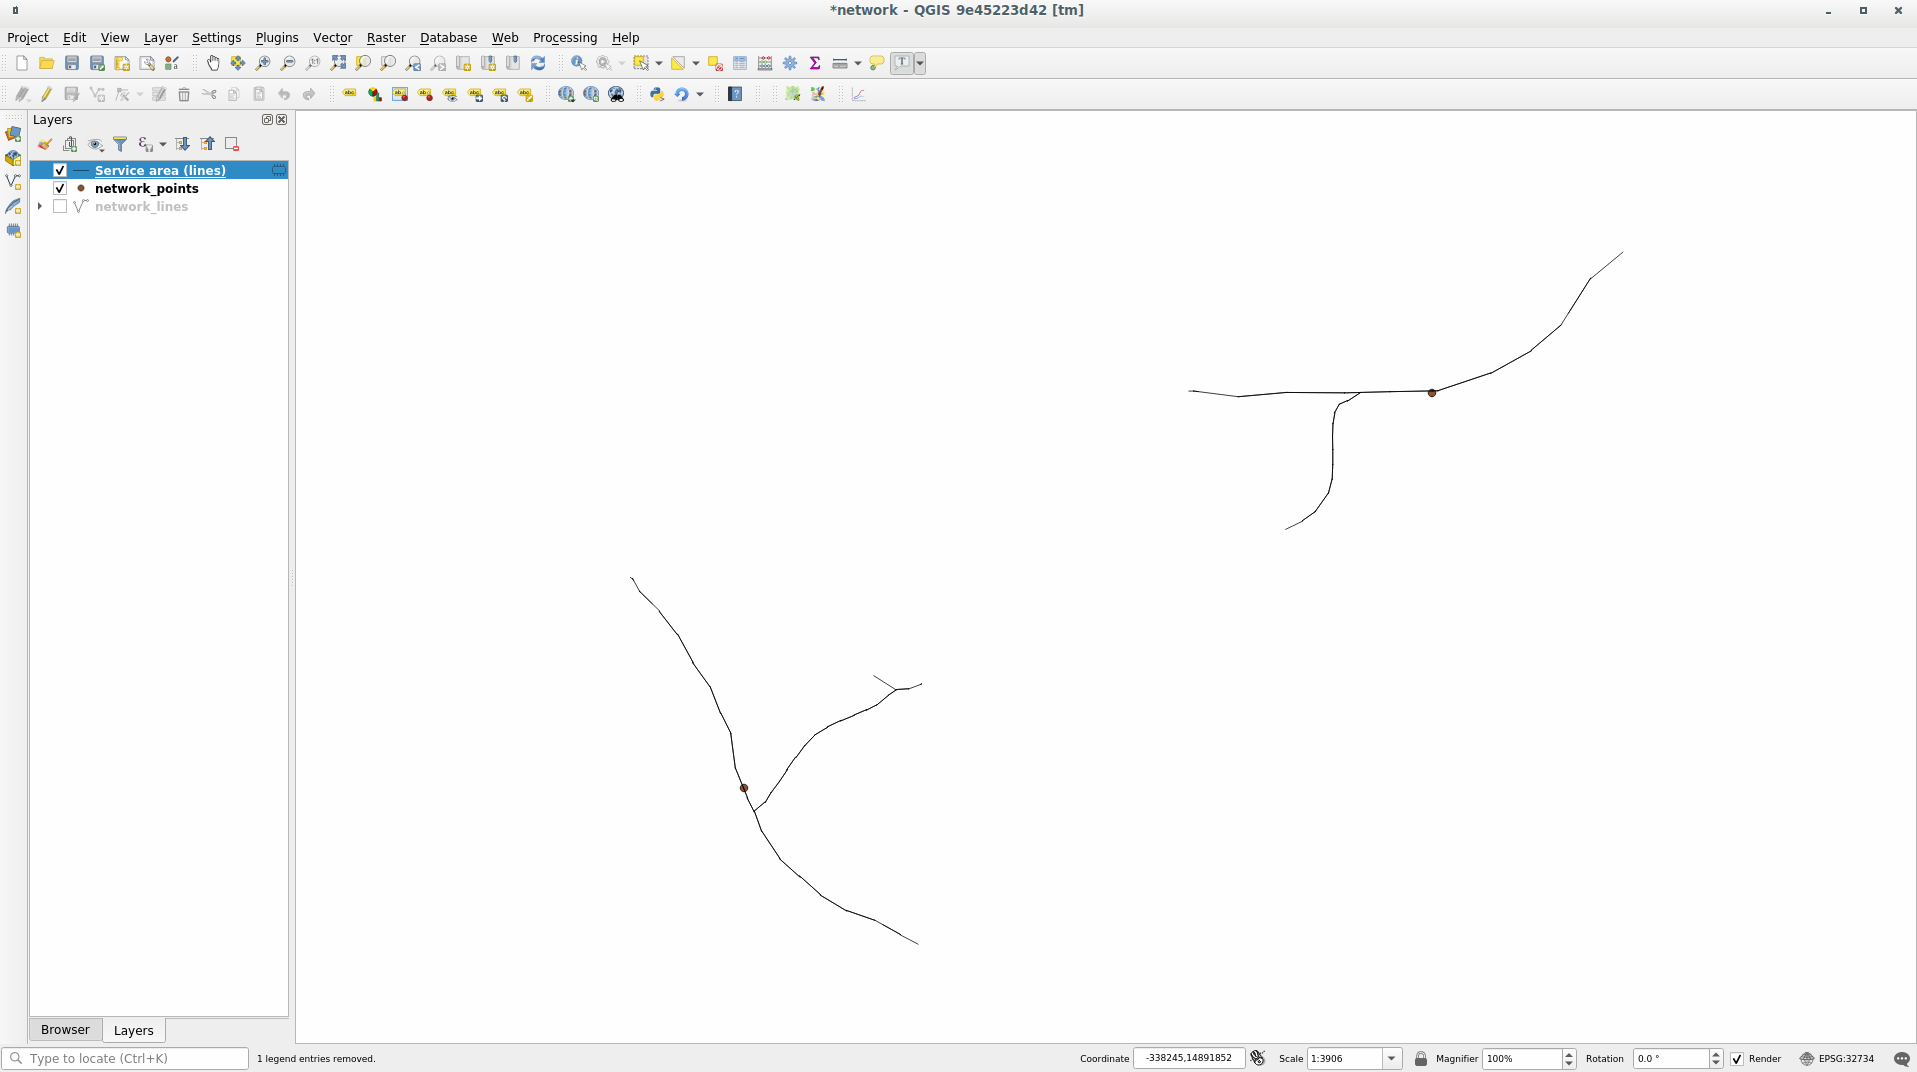
Cool isn't it?
6.3.7. In Conclusion
Now you know how to use Network analysis algorithm to solve shortest and fastest path problems.
これで、ベクタレイヤデータに対して空間統計を実行する準備が整いました。さあ行きましょう!
6.3.8. What's Next?
次は、ベクターデータセットに空間統計アルゴリズムを実行する方法について説明します。