6.3. Lesson: Network Analysis
Calculating the shortest distance between two points is a common GIS task. Tools for this can be found in the Processing Toolbox.
The goal for this lesson: learn to use Network analysis algorithms.
6.3.1.  Follow Along: The Tools and the Data
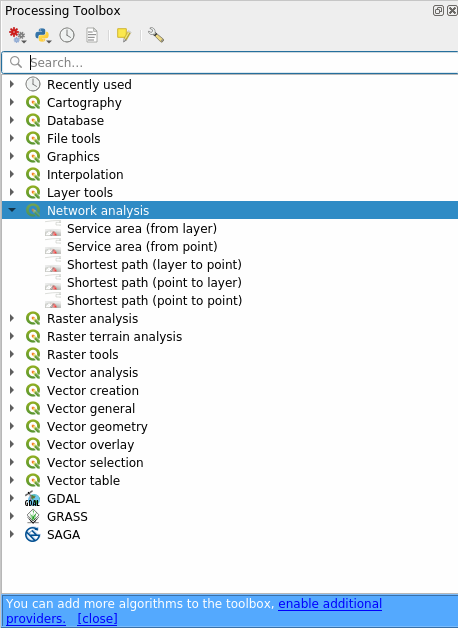
You can find all the network analysis algorithms in the menu. You can see that there are many tools available:
Open the project exercise_data/network_analysis/network.qgz.
It contains two layers:
network_pointsnetwork_lines
The network_lines layer has already a style that helps to understand the road network.
The shortest path tools provide ways to calculate either the shortest or the fastest path between two points of a network, given:
start and end points selected on the map
start point selected on the map and end points taken from a point layer
start points taken from a point layer and end point selected on the map
Let’s start.
6.3.2. Calculate the shortest path (point to point)
The allows you to calculate the shortest distance between two manually selected points on the map.
In this example we will calculate the shortest (not fastest) path between two points.
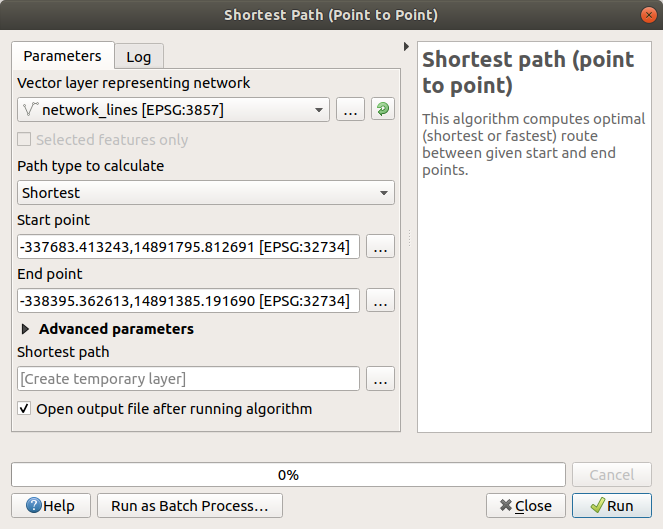
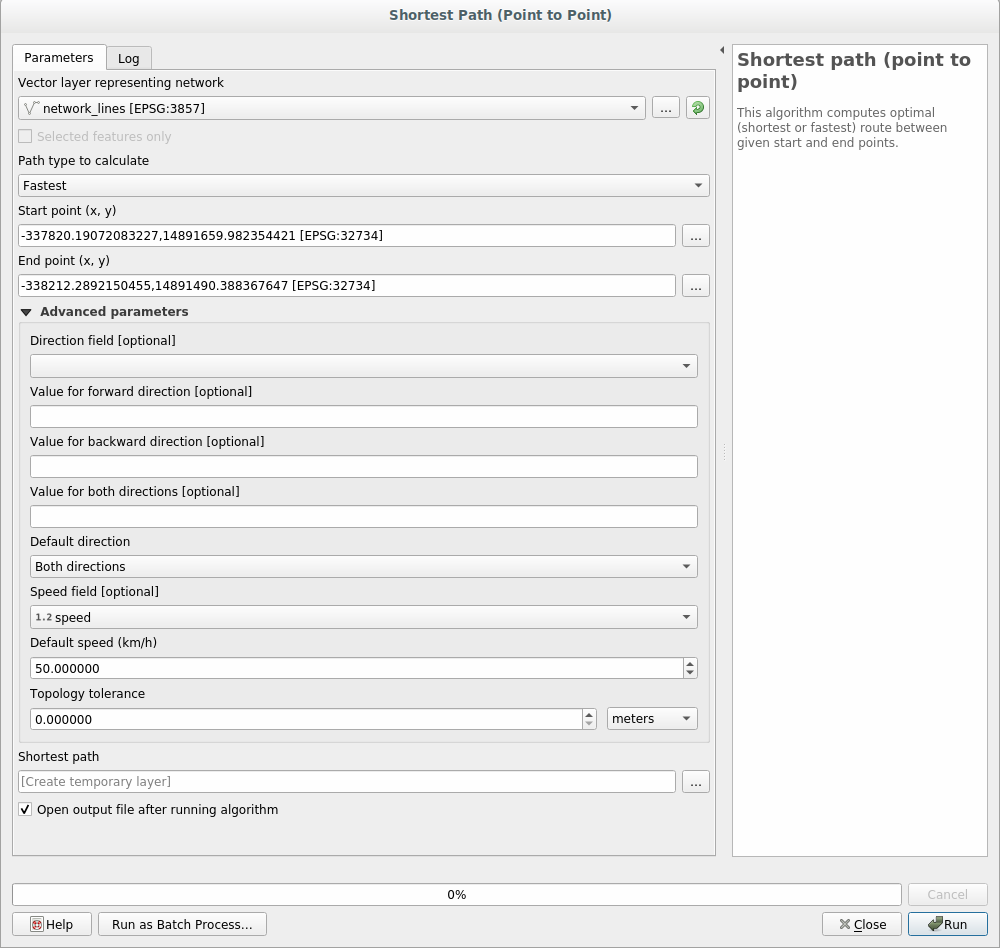
Open the Shortest path (point to point) algorithm
Select network_lines for Vector layer representing network
Use
Shortestfor Path type to calculateUse these two points as starting and ending points for the analysis:
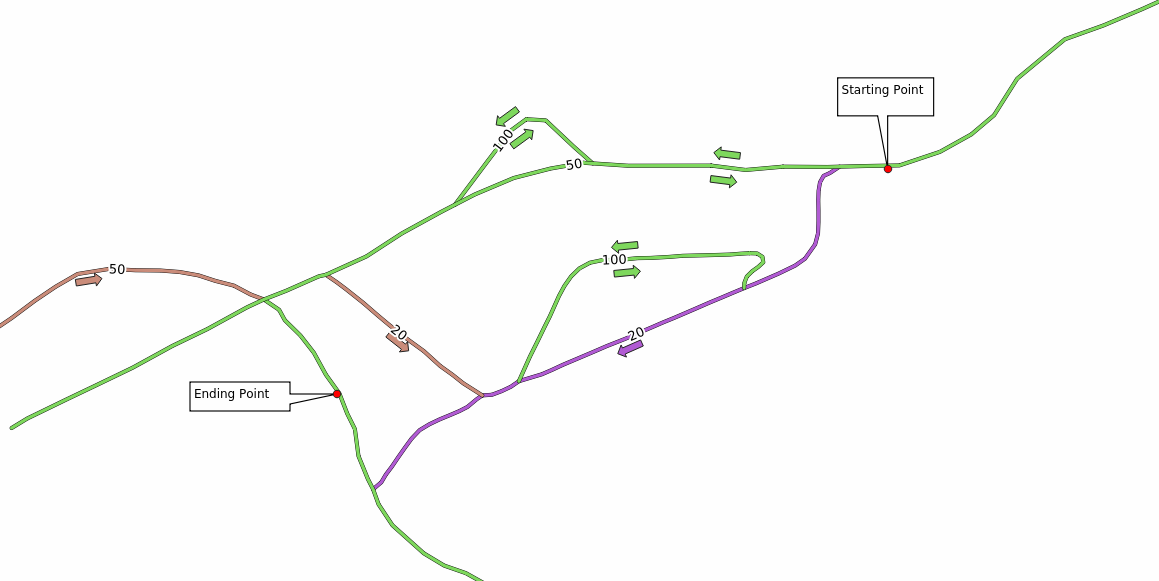
Click on the … button next to Start point (x, y) and choose the location tagged with
Starting Pointin the picture. The coordinates of the clicked point are added.Do the same thing, but choosing the location tagged with
Ending pointfor End point (x, y)Click on the Run button:
A new line layer is created representing the shortest path between the chosen points. Uncheck the
network_lineslayer to see the result better: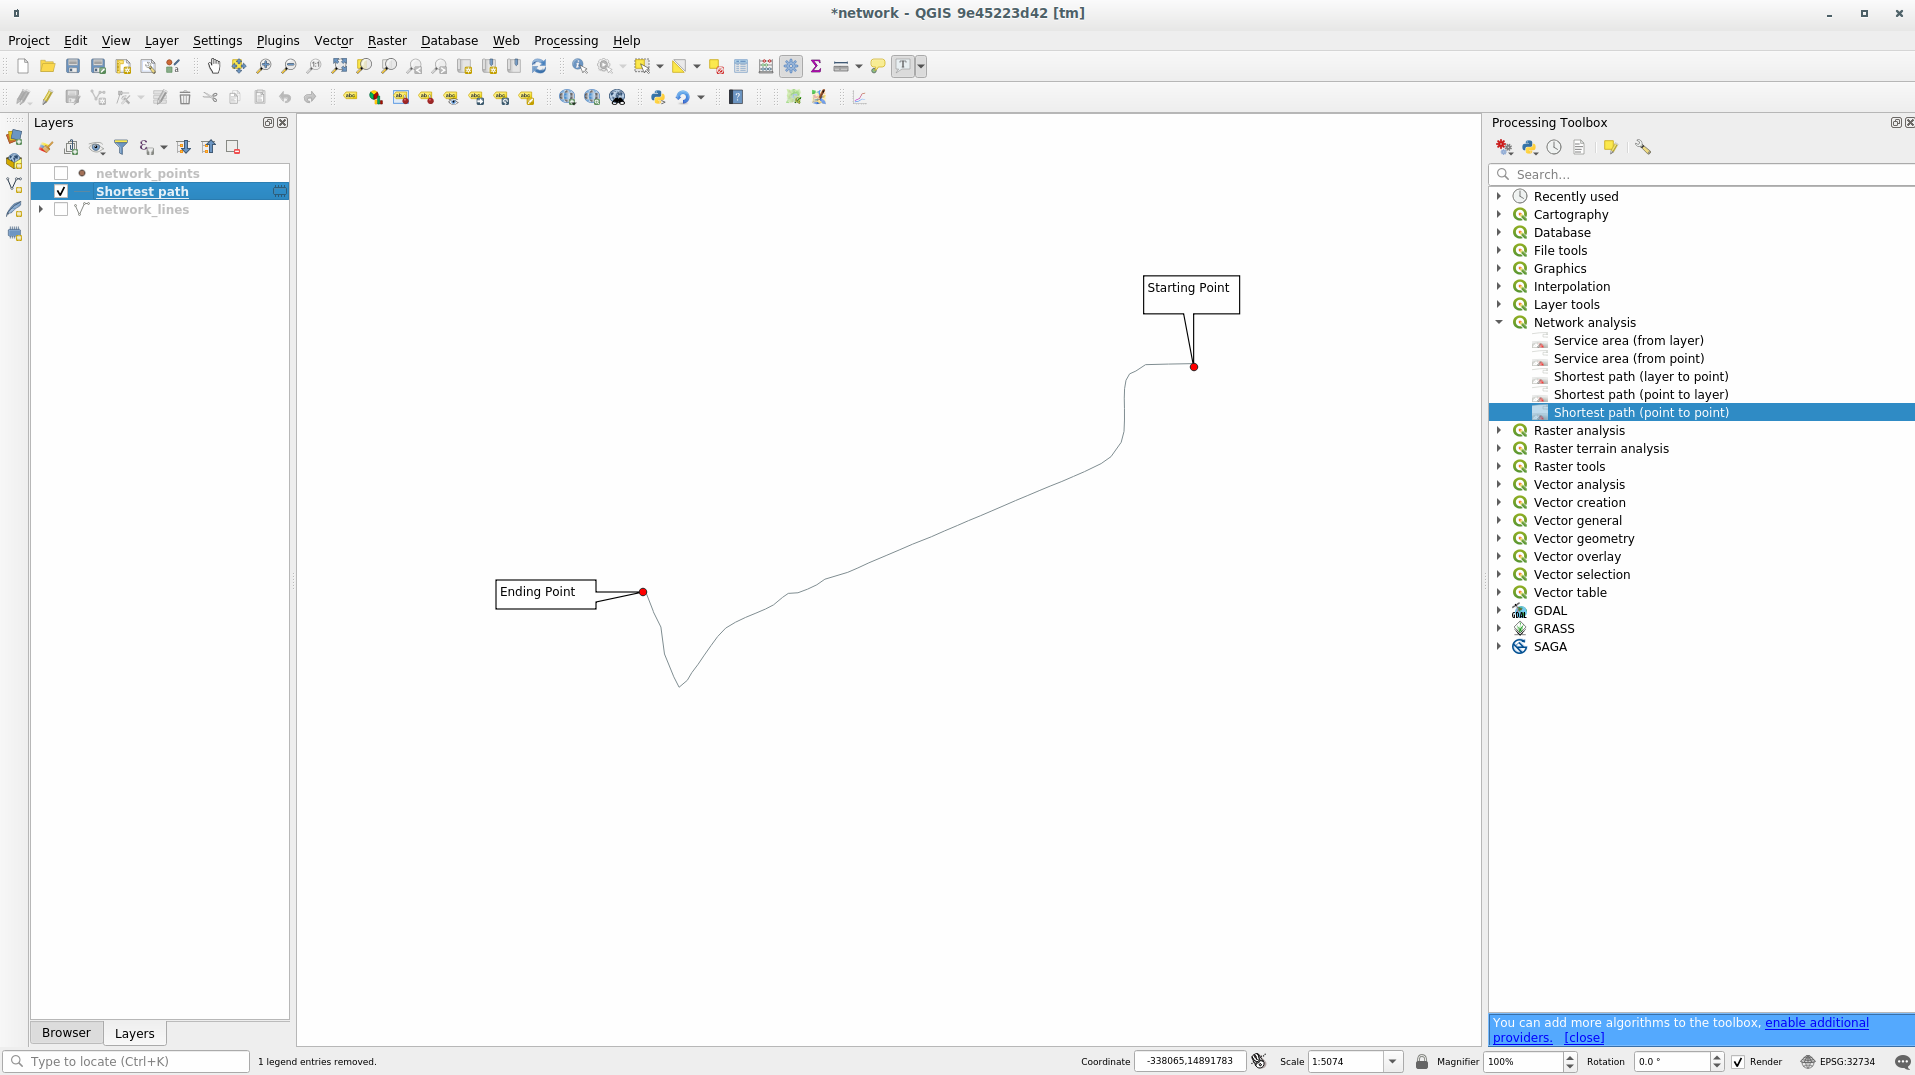
Open the attribute table of the output layer. It contains three fields, representing the coordinates of the start and end points and the cost.
We chose
Shortestas Path type to calculate, so the cost represent the distance, in layer units, between the two locations.In our case, the shortest distance between the chosen points is around
1000meters: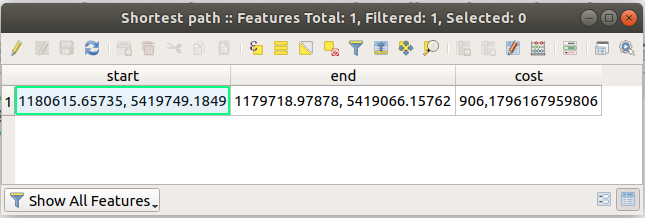
Now that you know how to use the tool, feel free to test other locations.
6.3.3.  Try Yourself Fastest path
With the same data of the previous exercise, try to calculate the fastest path between the two points.
How much time do you need to go from the start to the end point?
6.3.4. Follow Along: Advanced options
Let us explore some more options of the Network Analysis tools. In the previous exercise we calculated the fastest route between two points. As you can imagine, the time depends on the travel speed.
We will use the same layers and starting and ending points of the previous exercises.
Open the Shortest path (point to point) algorithm
Fill the Input layer, Start point (x, y) and End point (x, y) as we did before
Choose
Fastestas the Path type to calculateOpen the Advanced parameter menu
Change the Default speed (km/h) from the default
50value to4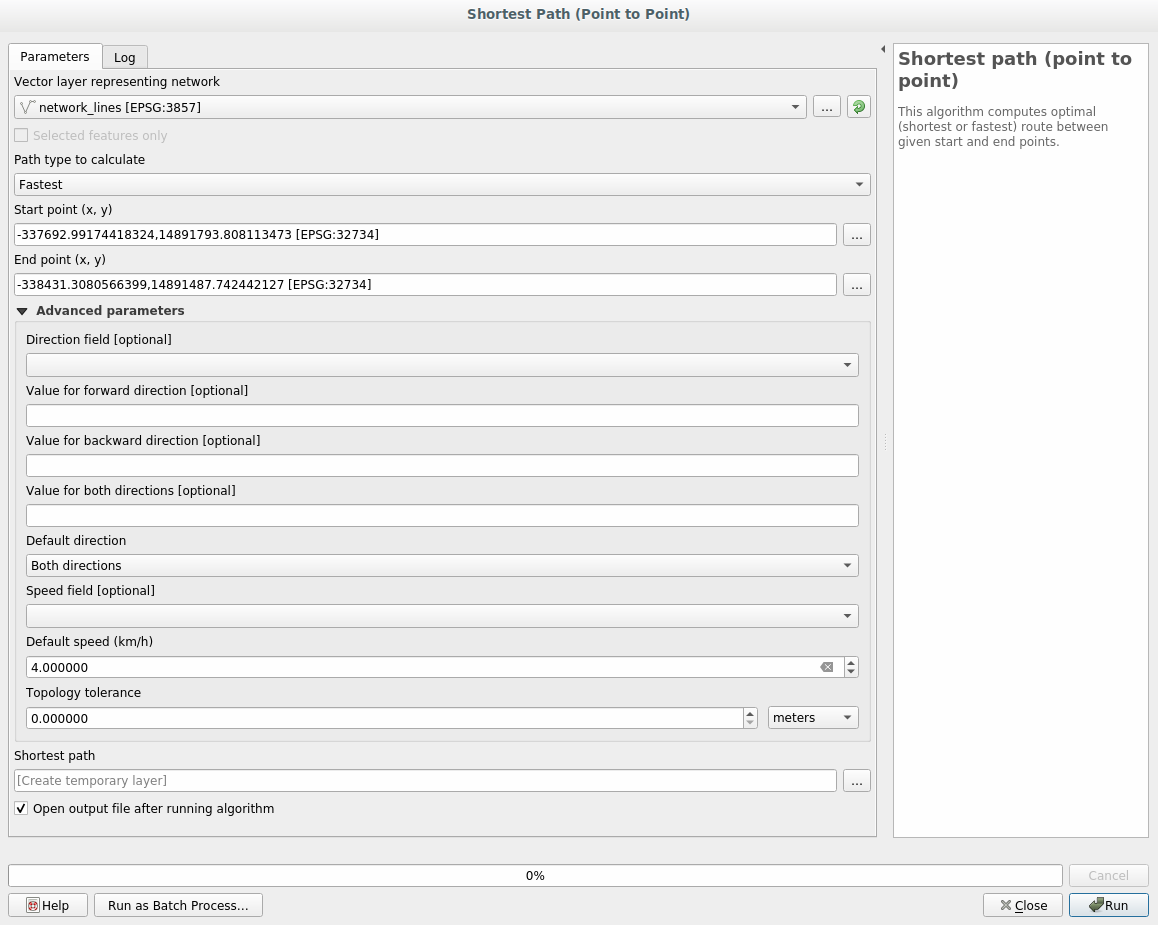
Click on Run
Once the algorithm is finished, close the dialog and open the attribute table of the output layer.
The cost field contains the value according to the speed parameter you have chosen. We can convert the cost field from hours with fractions to the more readable minutes values.
Open the field calculator by clicking on the
 icon
and add the new field minutes by multiplying the
cost field by 60:
icon
and add the new field minutes by multiplying the
cost field by 60: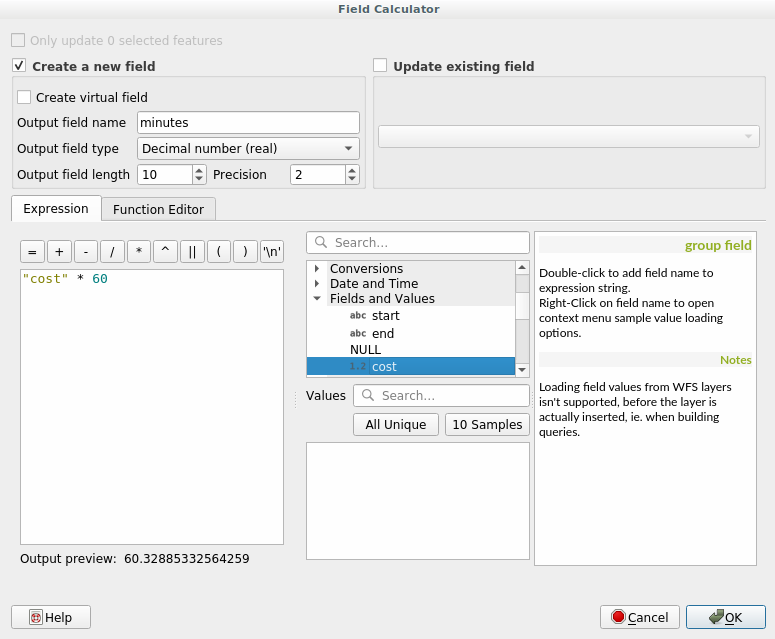
That’s it! Now you know how many minutes it will take to get from one point to the other one.
6.3.5.  Shortest path with speed limit
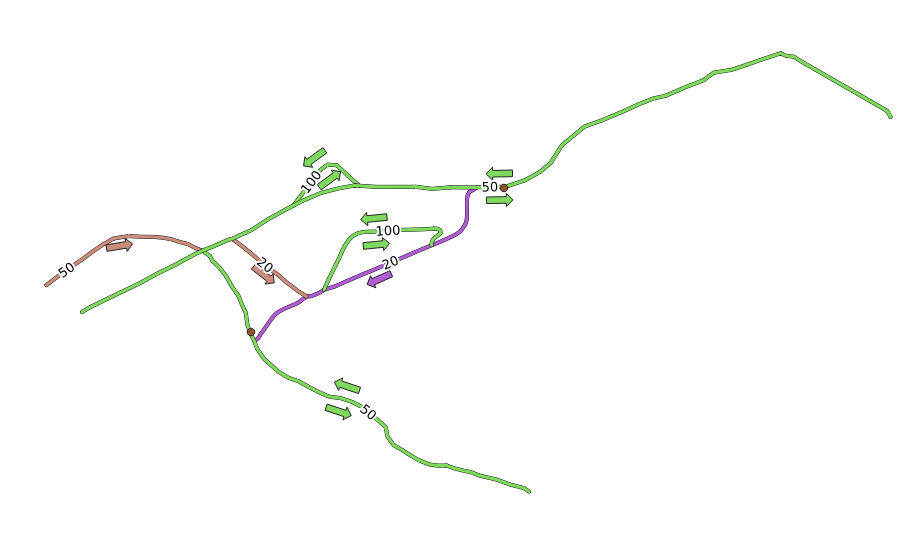
The Network analysis toolbox has other interesting options. Looking at the following map:
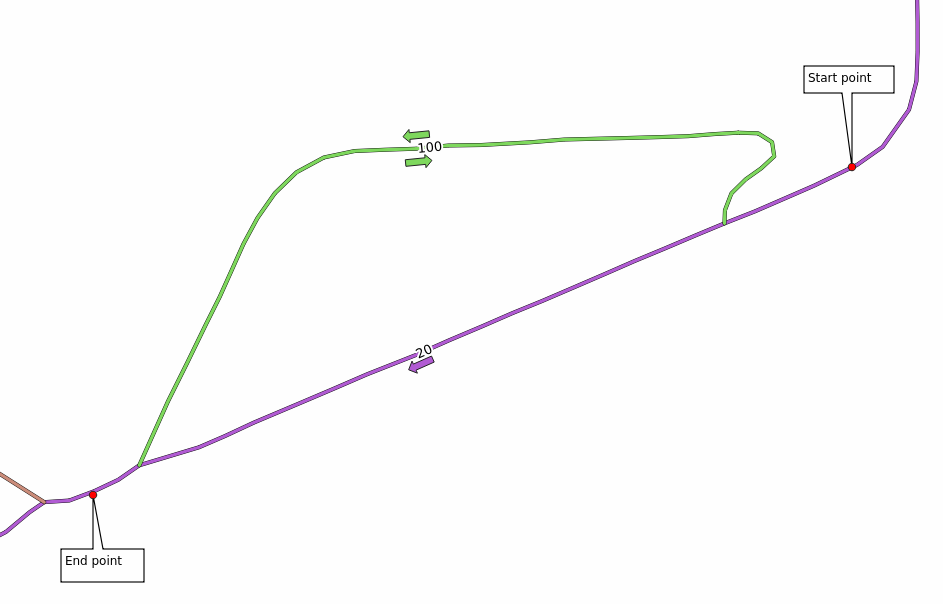
we would like to know the fastest route considering the speed limits of each road (the labels represent the speed limits in km/h). The shortest path without considering speed limits would of course be the purple path. But in that road the speed limit is 20 km/h, while in the green road you can go at 100 km/h!
As we did in the first exercise, we will use the and we will manually choose the start and end points.
Open the algorithm
Select network_lines for the Vector layer representing network parameter
Choose
Fastestas the Path type to calculateClick on the … button next to the Start point (x, y) and choose the start point.
Do the same thing for End point (x, y)
Open the Advanced parameters menu
Choose the speed field as the Speed Field parameter. With this option the algorithm will take into account the speed limits for each road.
Click on the Run button
Turn off the
network_lineslayer to better see the result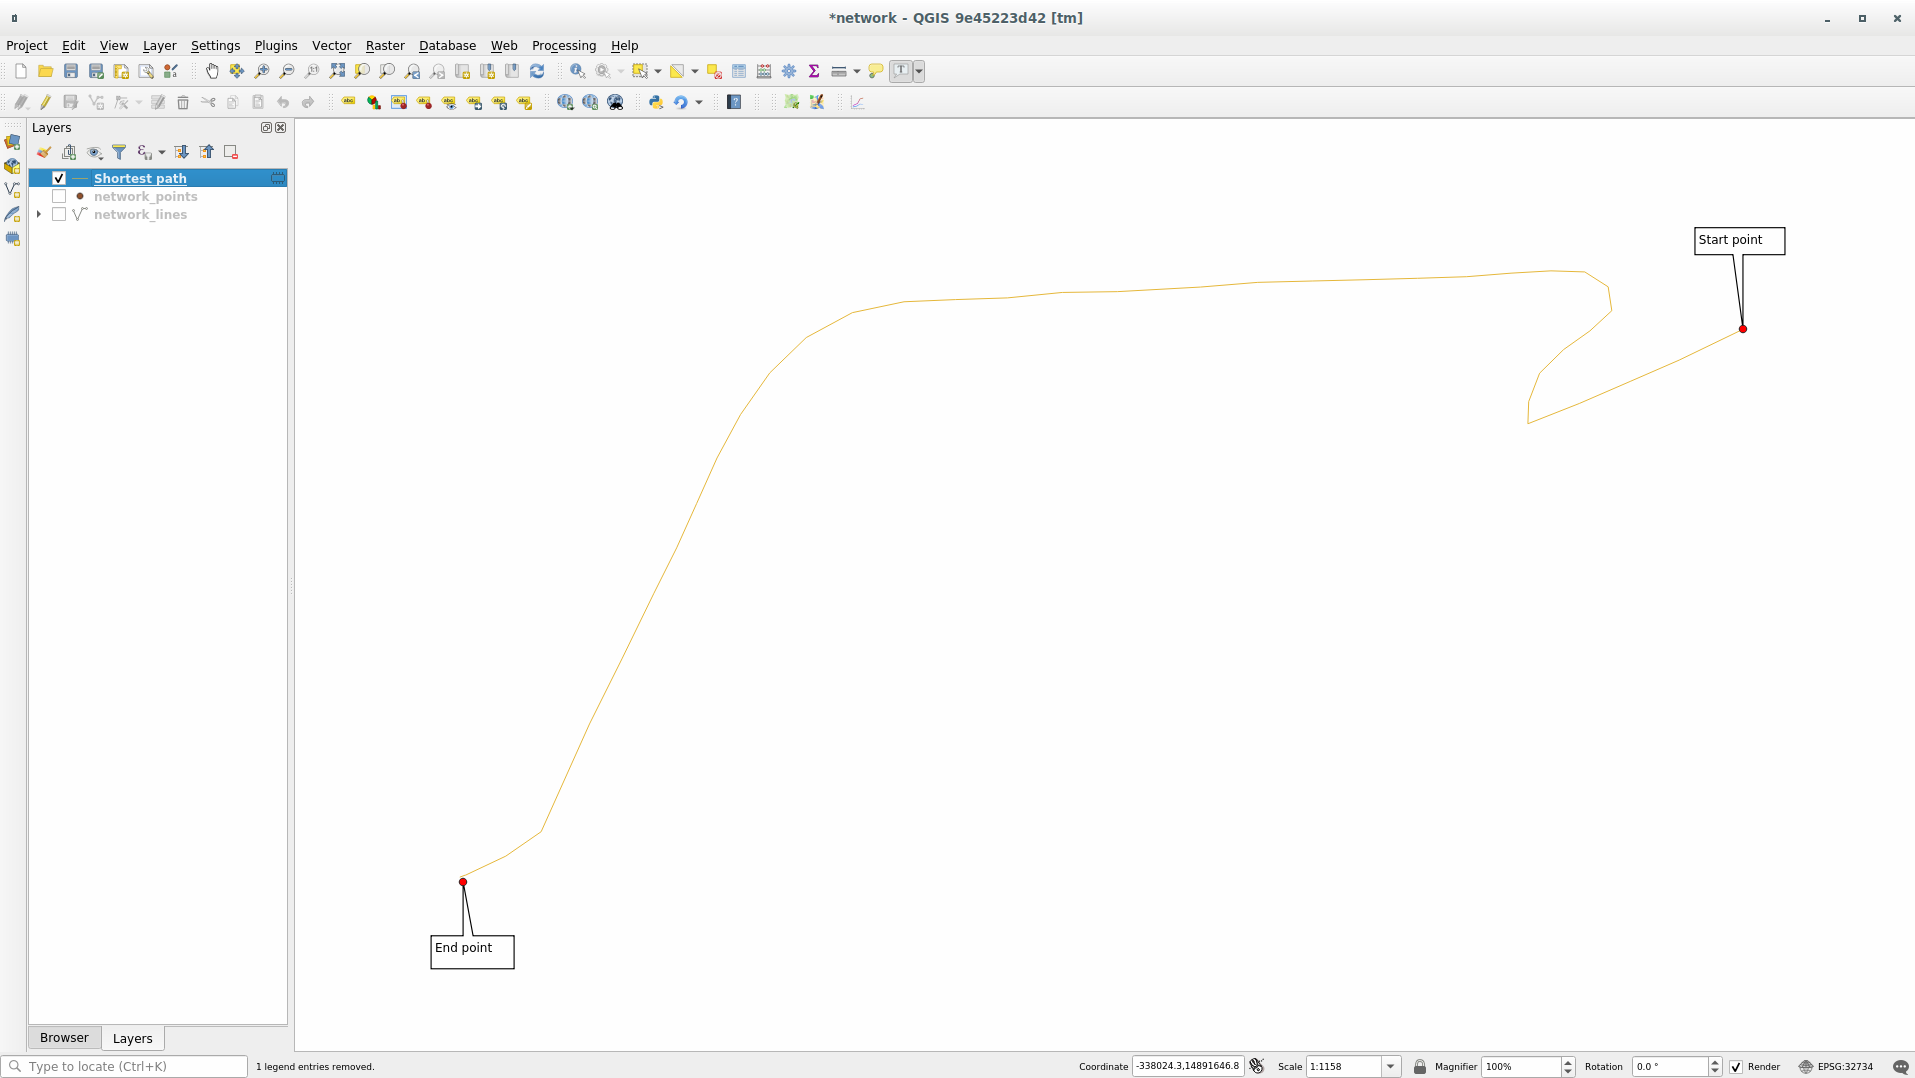
As you can see the fastest route does not correspond to the shortest one.
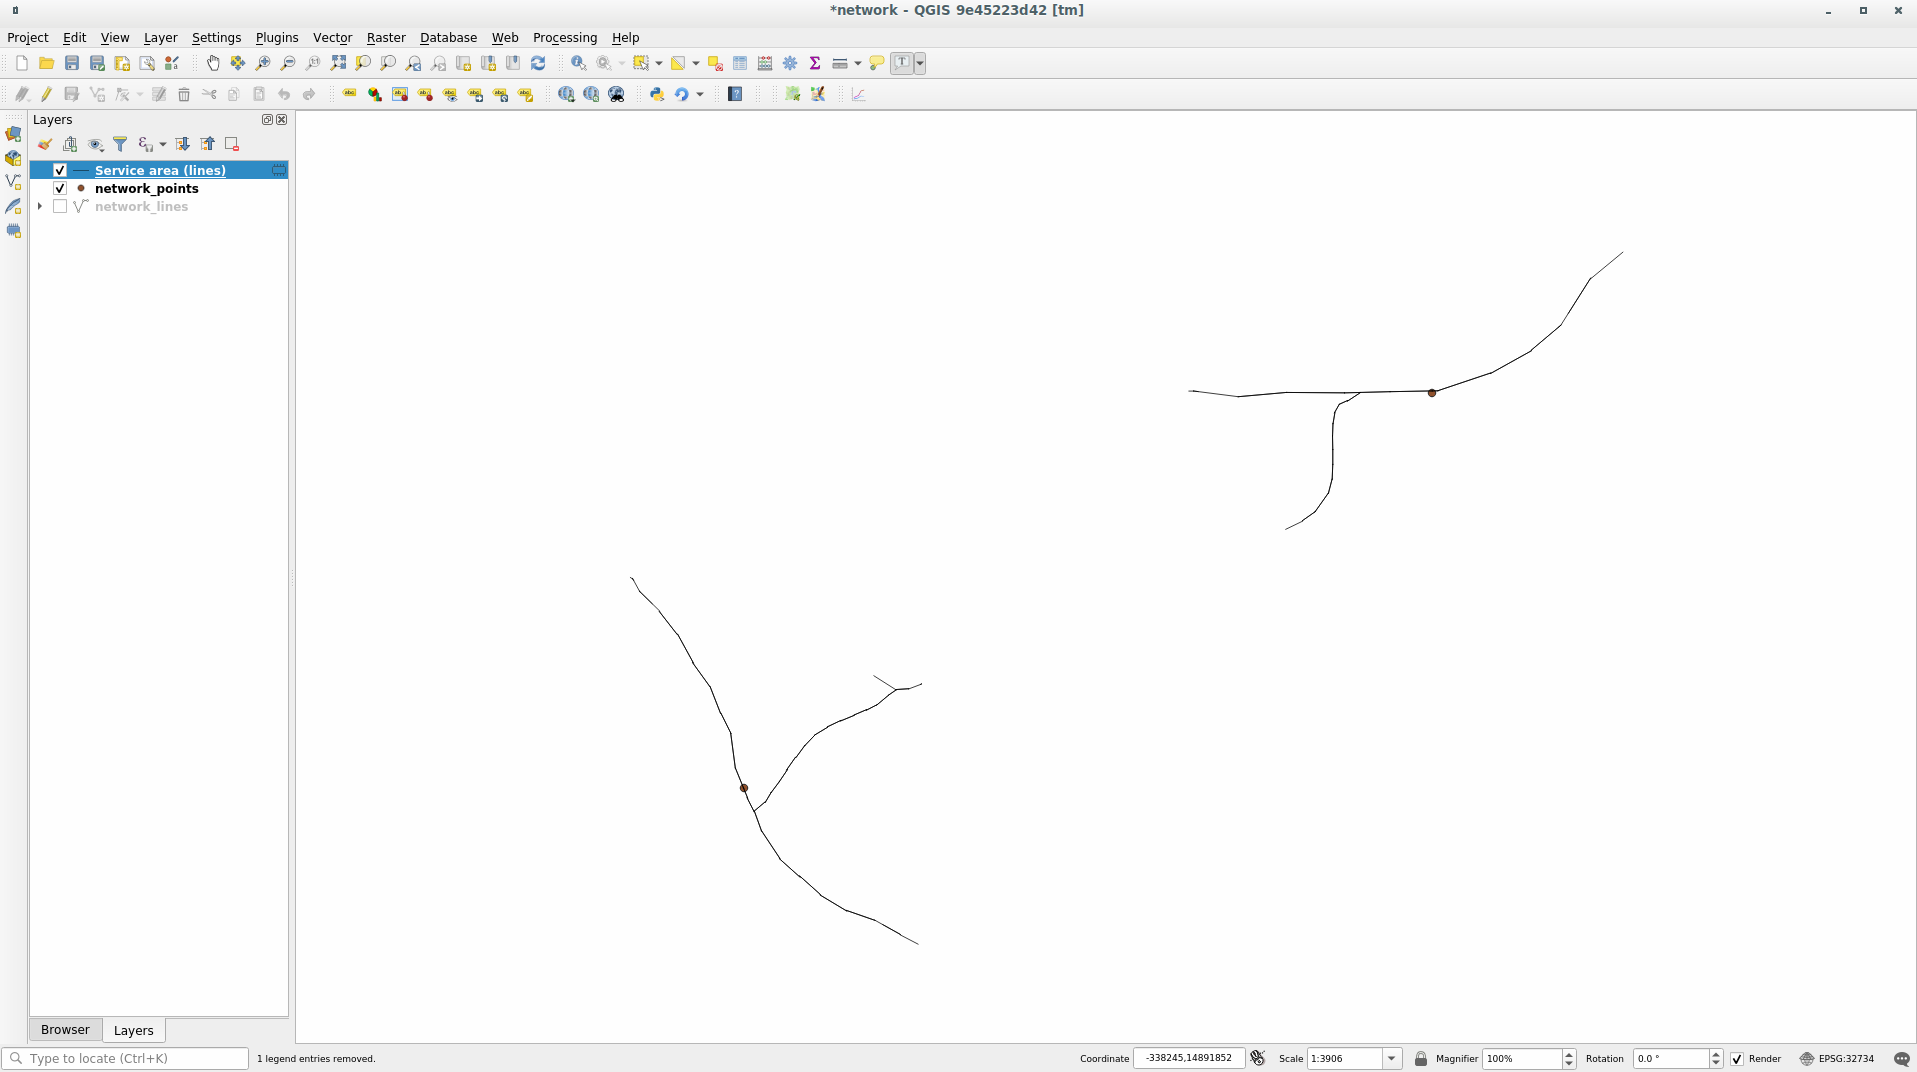
6.3.6. Service area (from layer)
The algorithm can answer the question: given a point layer, what are all the reachable areas given a distance or a time value?
Note
The is the same algorithm, but it allows you to manually choose the point on the map.
Given a distance of 250 meters we want to know how far we can go
on the network from each point of the network_points
layer.
Uncheck all the layers except
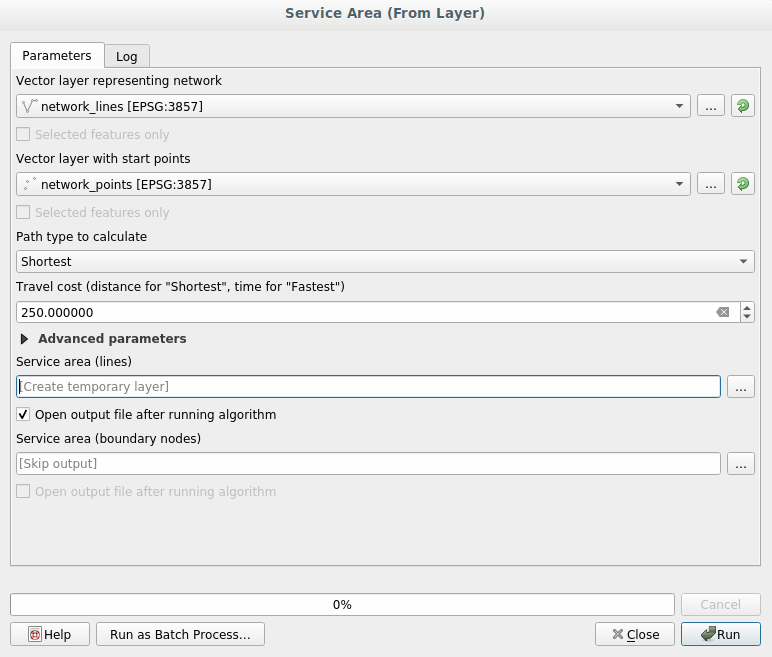
network_pointsOpen the algorithm
Choose
network_linesfor Vector layer representing networkChoose
network_pointsfor Vector layer with start pointsChoose
Shortestin Path type to calculateEnter
250for the Travel cost parameterClick on Run and close the dialog
The output layer represents the maximum path you can reach from the point features given a distance of 250 meters:
Cool isn’t it?
6.3.7. In Conclusion
Now you know how to use Network analysis algorithm to solve shortest and fastest path problems.
We are now ready to perform some spatial statistic on vector layer data. Let’s go!
6.3.8. What’s Next?
Next you’ll see how to run spatial statistics algorithms on vector datasets.