` `
일반 도구
컨텍스트 도움말
When you need help on a specific topic, you can access context help via the [Help] button available in most dialogs — please note that third-party plugins can point to dedicated web pages.
패널
QGIS provides by default many panels to work with. Some of these panels are described below while others may be found in different parts of the document. A complete list of default panels provided by QGIS is available at 패널.
레이어 패널
The layers Panel lists all the layers in the project and helps you manage their visibility. A layer can be selected and dragged up or down in the legend to change the Z-ordering. Z-ordering means that layers listed nearer the top of the legend are drawn over layers listed lower down in the legend.
주석
레이어 정렬 패널을 통해 범례의 Z 순서를 무시하게 할 수 있습니다.
레이어 패널 상단에 있는 툴바의 기능은 다음과 같습니다:
 Open the layer styling dock: toggle the layer styling
panel on and off.
Open the layer styling dock: toggle the layer styling
panel on and off. Add new group: 새 레이어 그룹을 만듭니다.
 Manage Visibility: control visibility of layers and
preset layers combination.
Manage Visibility: control visibility of layers and
preset layers combination. Filter Legend by Map Content: 레이어가 켜지고 피처가 현재 맵 캔버스 안에 들어오는 레이어만, 레이어 패널에 레이어 스타일을 표시합니다. 해당 사항이 없을 경우, 일반적인 NULL 심볼로 표시합니다. 레이어 심볼을 바탕으로 하는 이 방식으로 어떤 레이어의 어떤 피처 유형이 사용자의 관심 지역에 들어오는 지 손쉽게 알아볼 수 있습니다.
 Filter Legend by Expression: helps you apply an
expression to remove from the selected layer tree styles that have no feature
satisfying the condition. This can be used for example to highlight features
that are within a given area/feature of another layer.
From the drop-down list, you can edit and clear the expression set.
Filter Legend by Expression: helps you apply an
expression to remove from the selected layer tree styles that have no feature
satisfying the condition. This can be used for example to highlight features
that are within a given area/feature of another layer.
From the drop-down list, you can edit and clear the expression set. Expand All 또는
  Collapse All: 레이어 패널에 있는 모든 레이어 및 그룹을 펼치거나 접을 수 있습니다.
- and
 Remove Layer/Group currently selected.
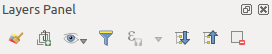
레이어 패널의 레이어 툴바
주석
Tools to manage the layers panel are also available to layout the map and legend items of the print composer
Preset the layers visibility
The button allows you to add Presets views in the legend.
Presets are a way to save and easily restore a combination of layers with their
current style. To add a preset view, just set visible the layers you want, with
their desired symbology, and click on button.
Choose Add Preset... from the drop-down menu and give a name to the preset.
The added preset is listed at the bottom of the drop-down menu and is recalled by
clicking on it.
The Replace Preset ‣ option helps you overwrite a preset content with the current map view while the Remove Current Preset button deletes the active preset.
All the added presets are also present in the map composer in order to allow you to create a map layout based on your specific views (see 주요 속성).
레이어 패널의 컨텍스트 메뉴 개요
At the bottom of the toolbar, the main component of the Layers panel is the frame listing vector or raster layers added to the project and, those layers can be organized in groups. Depending on the item selected in the panel, a right-click shows a dedicated set of options presented below.
옵션 |
벡터 레이어 |
래스터 레이어 |
그룹 |
|---|---|---|---|
 Zoom to Layer/Group Zoom to Layer/Group |
 |
|
|
 Show in Overview Show in Overview |
|
|
|
 Zoom to Native Resolution (100%) Zoom to Native Resolution (100%) |
|
||
| Stretch Using Current Extent | |
||
| Remove |
|
|
|
 Duplicate Duplicate |
|
|
|
| Set Layer Scale Visibility | |
|
|
| Zoom to Visible Scale | |
|
|
| Set Layer/Group CRS | |
|
|
| Set Project CRS from Layer | |
|
|
| Styles ‣ | |
|
|
| Copy Style | |
|
|
| Paste Style | |
|
|
 Open Attribute Table Open Attribute Table |
|
||
 Toggle Editing Toggle Editing |
|
||
 Current Edits ‣ Current Edits ‣ |
(in Edit mode) |
||
| Save As... | |
|
|
| Save As Layer Definition File... | |
|
|
| Filter... | |
||
| Show Feature Count |
|
||
| Properties | |
|
|
| Move to Top-level | |
|
|
| Rename | |
|
|
| Group Selected | |
|
|
| Set Group WMS Data | |
||
| Mutually Exclusive Group |
|
||
| Add Group |
|
표: 레이어 패널의 컨텍스트 메뉴 항목
GRASS 벡터 레이어의 경우, Toggle editing 을 사용할 수 없습니다. GRASS 벡터 레이어 편집에 대한 정보는 GRASS 벡터 레이어 디지타이즈 및 편집하기 을 참조하십시오.
Interact with Groups and layers
범례 창에 있는 레이어들을 그룹화할 수 있습니다. 그룹화하는 데에는 다음 두 가지 방법이 있습니다:
 아이콘을 클릭해서 새 그룹을 추가합니다. 그룹의 명칭을 입력한 다음 Enter 를 누르십시오. 이제 기존 레이어를 클릭한 채로 그룹으로 드래그하십시오.
- Select some layers, right click in the legend window and choose Group Selected. The selected layers will automatically be placed in a new group.
To bring a layer out of a group, you can drag it out, or right click on it and choose Move to top-level; the layer is placed at the same level than the group it was inside. Groups can also be nested inside other groups.
그룹의 체크박스를 한 번 클릭하는 것으로 그룹 안의 모든 레이어를 한꺼번에 보이게 하거나 숨길 수 있습니다.
Enabling the Mutually Exclusive Group option you can make a group have only one layer visible at the same time. Whenever a layer within the group is set visible the others will be toggled not visible.
It is possible to select more than one layer or group at the same time by holding down the Ctrl key while selecting the layers with the left mouse button. You can then move all selected layers to a new group at the same time.
You may also delete more than one layer or group at once by selecting several items with the Ctrl key and pressing Ctrl+D afterwards. This way, all selected layers or groups will be removed from the layers list.
벡터 레이어 스타일 편집 작업
From the Layers panel, you have shortcuts to easily and quickly edit the layer rendering. Right-click on a vector layer and select Styles ‣ in the list in order to:
- see the currently applied styles to the layer. In case you defined many styles for the layer, you can switch from one to another and have your layer rendering automatically updated in the map canvas.
현재 스타일을 복사해서, 이 스타일이 적용 가능한 다른 레이어에 붙여넣어 적용시킬 수 있습니다.
- rename the current style, add a new one (which is actually a copy of the current one) or delete the current style (when multiple styles available).
주석
The previous options are also available for raster layer.
Whether the features in the vector layer have all the same unique symbol or they are classified (in that case, the layer is displayed in a tree structure with each class as sub-item), the following options are available at layer level or class level:
- a Edit Symbol... button to open the 심볼 선택기 dialog and update any property (symbol, size, color...) of the layer or feature symbol. Double-clicking on a feature does also open the Symbol Selector dialog.
- a 색상 선택기 widget with a Color Wheel from which you can click a color and have it automatically update the symbol fill color. For convenience, Recent colors are available at the bottom of the color wheel.
- a
 Show All Items and
  Hide All
Items to toggle on or off the visibility of all the classes of features. This avoids
(un)checking items one by one.
Hide All
Items to toggle on or off the visibility of all the classes of features. This avoids
(un)checking items one by one.
참고
손쉽게 레이어 스타일 공유
From the context menu, copy the style of a layer and paste it to a group or a selection of layers: the style is applied to all the layers that are of the same type (vector vs raster) as the original layer and, in case of vector, have the same geometry type (point, line or polygon).
Working with the Legend independent layer order
There is a panel that allows you to define an independent drawing order for
the layers panel. You can activate it in the menu Settings
‣ Panels ‣ Layer Order Panel. This feature allows you to, for instance,
order your layers in order of importance, but still display them in the
correct order (see figure_layer_order; you can notice that the airports
features are displayed over the alaska polygon despite their layers
placement in the Layers panel).
Unchecking the Control rendering order box underneath
the list of layers will cause a revert to default behavior.

Define a legend independent layer order
레이어 스타일 작업 패널
This panel is somehow a shortcut to some of the features of the layer properties dialog. It indeed offers you a quick and handy way to define the rendering and the behavior of a layer, and to visualize its effects without opening the layer properties dialog.
Besides avoiding you dealing with the modal and blocking dialog of the layer properties, it also avoids you cluttering the screen with features dialogs given that it embeds most of them (color selector, effects properties, rule edit, label substitution...): e.g., clicking color buttons inside the layer style panel causes the color selector dialog to be opened inside the layer style panel itself rather than as a separate dialog.
레이어 패널에 있는 현재 레이어들의 드롭다운 목록에서 항목을 선택한 다음:
- set its symbology, transparency, and histogram in case of raster layer. These options are the same available in 레스터 속성 대화창
- set its symbology, and labels. These options are the same available in 벡터 속성 대화창
- manage the associated style(s) as described in 사용자 지정 스타일 관리하기
- follow the whole history of changes you applied to the layer style in the current project; you can therefore cancel or restore to any state by selecting it in the list and hit [Apply] button.
Another powerful feature of this panel is the Live update checkbox. Tick it and your changes are automatically rendered in the map canvas as you go on. You no longer need to hit the [Apply] button.
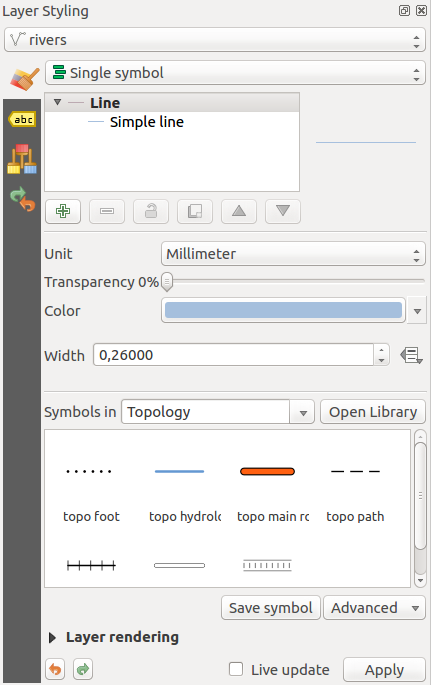
Defining a layer symbology from the layer styling panel
참고
Add custom tabs to the Layer Styling panel
Using PyQGIS, you can set new tabs to manage layer properties in the Layer Styling Panel. See https://nathanw.net/2016/06/29/qgis-style-dock-part-2-plugin-panels/ for an example.
통계 요약 패널
This panel can show some statistics on a specific vector layers. The panel allows users to choose:
- the vector layer;
- the column or the expression;
- filter statistics to selected features;
- refresh the informations;
- the statistics information to display with the bottom right button.
Statistic information available are (depending on the field’s type):
통계 정보 |
문자열 |
정수 |
실수 |
날짜 |
|---|---|---|---|---|
개수 |
|
|
|
|
고유 값(Distinct Value) 개수 |
|
|
||
누락 값(Missing value) 개수 |
|
|
||
합계 |
|
|
||
평균 |
|
|
|
|
표준 편차 |
|
|
||
표본 표준 편차 |
|
|
||
최소값 |
|
|
|
|
최대값 |
|
|
|
|
범위 |
|
|
|
|
소수 기준(Minority) |
|
|
||
다수 기준(Majority) |
|
|
||
다양도(Variety) |
|
|
||
제1사분위수(First Quartile) |
|
|
||
제3사분위수(Third Quartile) |
|
|
||
사분위간 범위(Inter Quartile Range) |
|
|
||
최소 길이 |
|
|||
최대 길이 |
|
표: 필드 유형에 따라 사용할 수 있는 통계
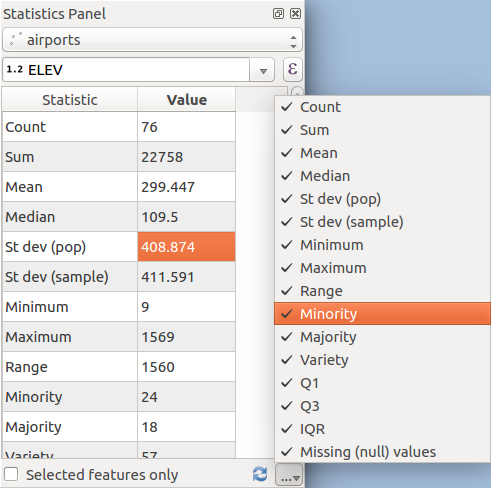
필드에 대한 통계정보 종류 표시
QGIS Overview Panel
In QGIS, you can use an overview panel that provides a full extent view of layers added to it. Within the view is a rectangle showing the current map extent. This allows you to quickly determine which area of the map you are currently viewing. Note that labels are not rendered to the map overview even if the layers in the map overview have been set up for labelling. If you click and drag the red rectangle in the overview that shows your current extent, the main map view will update accordingly.
로그 메시지 패널
When loading or processing some operations, you can track and follow messages
that appear in different tabs using the  Log Messages Panel.
It can be activated using the most right icon in the bottom status bar.
Log Messages Panel.
It can be activated using the most right icon in the bottom status bar.
실행 취소/재실행 패널
For each layer being edited, this panel shows the list of actions done, allowing to quickly undo a set of actions by simply selecting the action listed above. More details at Undo and Redo edits.
렌더링 작업
기본적으로 QGIS는 맵 캔버스를 업데이트할 때마다 모든 가시 레이어를 렌더링합니다. 다음과 같은 이벤트가 맵 캔버스 업데이트를 유발합니다:
- Adding a layer
- Panning or zooming
- Resizing the QGIS window
- Changing the visibility of a layer or layers
사용자는 QGIS 상에서 다양한 방법으로 렌더링 과정을 제어할 수 있습니다.
축척에 따른 렌더링
Scale-dependent rendering allows you to specify the minimum and maximum scales
at which a layer (raster or vector) will be visible. To set scale-dependent rendering,
open the Properties dialog by double-clicking on the layer in the legend.
On the General tab, tick the Scale
dependent visibility checkbox and enter the Minimum (exclusive) and
Maximum (inclusive) scale values.
You can also activate the scale dependent visibility on a layer from the Layers panel. Right-click on the layer and in the context menu, select Set Layer Scale Visibility.
The  Set to current canvas scale button helps you use
the current map canvas scale as boundary of the range visibility.
Set to current canvas scale button helps you use
the current map canvas scale as boundary of the range visibility.
주석
When a layer is not rendered in the map canvas due to the map scale out of its visibility scale range, the layer is greyed in the Layers panel and a new option Zoom to Visible Scale appears in the layer context menu. Select it and the map is zoomed to the layer’s nearest visibility scale.
맵 렌더링 제어
다음에서 설명하는 대로, 다양한 방법으로 맵 렌더링을 제어할 수 있습니다.
렌더링 보류
To suspend rendering, click the Render checkbox in the
lower right corner of the status bar. When the Render
checkbox is not checked, QGIS does not redraw the canvas in response to any of
the events described in section 렌더링 작업. Examples of when you
might want to suspend rendering include:
- Adding many layers and symbolizing them prior to drawing
- Adding one or more large layers and setting scale dependency before drawing
- Adding one or more large layers and zooming to a specific view before drawing
- Any combination of the above
Render 체크박스를 체크하면 렌더링을 활성화해서 즉시 맵 캔버스를 업데이트하게 됩니다.
레이어 추가 옵션 설정
You can set an option to always load new layers without drawing them. This
means the layer will be added to the map, but its visibility checkbox in the
legend will be unchecked by default. To set this option, choose menu option
Settings ‣ Options and click on the Rendering
tab. Uncheck the By default new layers added to the map
should be displayed checkbox. Any layer subsequently added to the map will be off
(invisible) by default.
렌더링 중단
To stop the map drawing, press the ESC key. This will halt the refresh of the map canvas and leave the map partially drawn. It may take a bit of time between pressing ESC and the time the map drawing is halted.
주석
현재 렌더링을 중단하는 것은 불가능합니다. 사용자 인터페이스 문제 및 소프트웨어 오류 등의 이유 때문에 Qt4 포팅 버전에서는 비활성화된 상태입니다.
렌더링 질 변경
QGIS는 맵의 렌더링 질을 변경할 수 있는 옵션을 보유하고 있습니다. Settings ‣ Options 메뉴 옵션을 선택하고, Rendering 탭을 클릭한 다음 Make lines appear less jagged at the expense of some drawing performance 체크박스를 체크하거나 해제해보십시오.
렌더링 속도 향상
몇 가지 설정으로 렌더링 속도를 향상시킬 수 있습니다. Settings ‣ Options 메뉴 옵션으로 QGIS 설정 대화창을 열고, Rendering 탭으로 이동해서 다음 체크박스들을 체크하거나 해제해보십시오:
- Use render caching where possible to speed up redraws
- Render layers in parallel using many CPU cores 를 체크한 다음 Max cores to use 를 설정
백그라운드에서 맵을 별개의 이미지로 렌더링해서 각
Map Update interval 시간마다 이 (오프스크린) 이미지의 내용을 가져다가 맵 캔버스를 업데이트하게 됩니다. 하지만 렌더링 작업이 이 간격보다 빨리 끝나는 경우, 그 즉시 화면에 업데이트됩니다.- With Enable Feature simplification by default for newly
added layers, you simplify features’ geometry (less nodes) and as a result,
they quickly display.
Be aware that you can also face rendering inconsistencies.
레이어 속성 저장 및 공유
사용자 지정 스타일 관리하기
When a vector layer is added to map canvas, QGIS uses by default a random symbol/color to render its features. You can however set a default symbol in Project ‣ Project Properties ‣ Default styles that will be applied to each newly added layer according to its geometry type.
But, most of the time, you’d prefer to have a custom and more complex style that can be applied automatically or manually (with less efforts) to the layers. You can achieve this goal using the Style combobox at the bottom of the Layer Properties dialog. This combobox provides you with functions to create, load and manage styles.
A style stores any information set in the layer properties dialog to render or interact with the features (including symbology, labeling, action, diagram... settings) for vector layer, or the pixels (band or color rendering, transparency, pyramids, histogram ...) for raster.
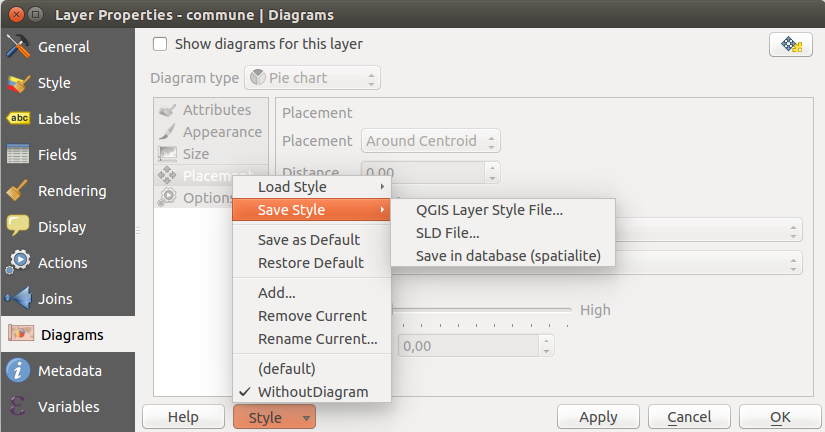
벡터 레이어 스타일 콤보박스 옵션들
By default, the style applied to a loaded layer is named default. Once you
have got the ideal and appropriate rendering for your layer, you can save it by
clicking the  Style combobox and choose:
- Rename Current: The active style gets renamed and updated with the current options
Add: 현재 옵션으로 새 스타일을 생성합니다. 기본적으로 QGIS 프로젝트 파일 안에 저장될 겁니다. 스타일을 다른 파일로 또는 데이터베이스에 저장하는 방법은 다음 항을 참조하세요.
- Remove: delete unwanted style, in case you have more than one style defined for the layer.
At the bottom of the Style drop-down list, you see the styles set for the layer and the active one is checked.
Note that each time you validate the layer properties dialog, the active style is updated with the changes you’ve done.
You can create as many styles as you wish for a layer but only one can be active at a time. Combined to layer visibility preset, this offers a quick and powerful way to manage complex projects with few layers (no need to duplicate any layer in the map legend).
참고
레이어 컨텍스트 메뉴에서 스타일 관리하기
Right-click on the layer in Layers Panel to add, rename or remove layer style.
Storing Style in a File or a Database
While created styles from the Style combobox are by default saved inside the project and can be copied and pasted from layer to layer in the project, it’s also possible to save them outside the project so that they can be loaded in another project.
Save in plain text file
Style ‣ Save Style 메뉴를 클릭하면, 스타일을 다음 텍스트 파일로 저장할 수 있습니다:
QGIS 레이어 스타일 파일 (.qml)
- or SLD file (.sld), only available for vector layers.
Used on file based format layers (.shp, .tab...), Save as Default generates a .qml file along the layer (with the same name). SLDs can be exported from any type of renderer – single symbol, categorized, graduated or rule-based – but when importing an SLD, either a single symbol or rule-based renderer is created. That means that categorized or graduated styles are converted to rule-based. If you want to preserve those renderers, you have to stick to the QML format. On the other hand, it can be very handy sometimes to have this easy way of converting styles to rule-based.
데이터베이스에 저장
Vector layer style can also be stored in a database if the layer datasource is a database provider. Supported formats are PostGIS, GeoPackage, SpatiaLite, MSSQL and Oracle. The layer style is saved inside a table (named layer_styles) of the database. Click on Save Style ‣ Save in database item then fill in the dialog to define a style name, add a description, a .ui file if applicable and check if the style should be the default style.
You can save several styles for a single table in the database. However each table can have only one default style. Default style can be saved in the layer database or in the QGIS local database, a SQLite database in the ~/.qgis2/ directory (where QGIS stores its local settings).
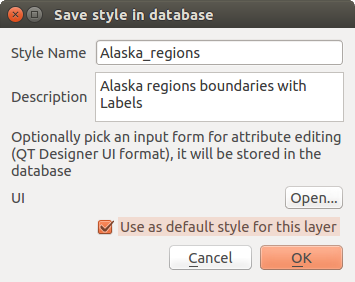
데이터베이스 대화창에서 스타일 저장
참고
데이터베이스들 사이에서 스타일 파일 공유하기
레이어가 데이터베이스 기반일 경우에만 해당 데이터베이스에 사용자 스타일을 저장할 수 있습니다. 데이터베이스 사이에서 (예를 들어 Oracle 레이어와 MS SQL 스타일은) 호환되지 않습니다. 데이터베이스들 사이에서 스타일을 공유하려면 암호화되지 않은 텍스트 파일을 대신 이용하십시오.
주석
You may encounter issues to restore the layer_styles table from a PostgreSQL database backup. Follow QGIS layer_style 테이블 및 데이터베이스 백업 to fix that.
스타일 불러오기
When loading a layer in QGIS, if a default style already exists for this layer, QGIS loads the layer with this style. Also Style ‣ Restore Default looks for and loads that file when pressed, replacing current style of the layer.
The Style ‣ Load Style helps you apply any saved style to a layer. While plain text file style (.sld or .qml) can be applied to any layer whatever its format is, loading styles stored in database is only possible if the layer is from the same database or the style is stored in the QGIS local database.
The Load Style from Database dialog displays a list of related styles to the layer found in the database and all the other styles saved in it, with name and description.
참고
프로젝트 내부에서 손쉽게 레이어 스타일 공유
You can also share layer style within a project without importing a file or database style: right-click on the layer in the Layers Panel and, from the Styles combobox , copy the style of a layer and paste it to a group or a selection of layers: the style is applied to all the layers that are of the same type (vector vs raster) as the original layer and, in case of vector, have the same geometry type (point, line or polygon).
색상 선택기
The select color dialog will appear whenever you push
the 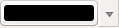 icon to choose a color. The features of this dialog
depends on the state of the Use native color chooser dialogs parameter
checkbox in Settings ‣ Options ‣ General menu.
When checked, the color dialog used is the one of the OS being used. Otherwise,
QGIS custom color chooser is used.
icon to choose a color. The features of this dialog
depends on the state of the Use native color chooser dialogs parameter
checkbox in Settings ‣ Options ‣ General menu.
When checked, the color dialog used is the one of the OS being used. Otherwise,
QGIS custom color chooser is used.
참고
Dynamically change the color with the live-updating option
Check the Use live-updating color chooser dialogs option in the Settings ‣ Options ‣ General menu to have the color applied to your items as soon as you pick it in the color chooser dialog.
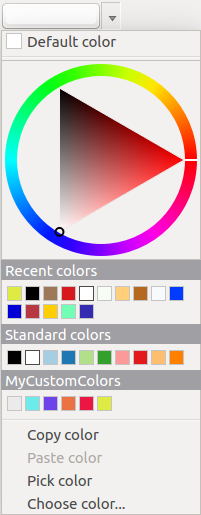
The custom color chooser dialog has four different tabs which allow you to
select colors by  color ramp,
  color wheel,
 color swatches or
  color picker
(not available under
color picker
(not available under  ).
).
Whatever method you use, the selected color is always described through color sliders for HSV (Hue, Saturation, Value) and RGB (Red, Green, Blue) values. The color is also identifiable as a HTML notation. Finally, there is an opacity slider to set transparency level.
Modifying a color is as simple as clicking in the color wheel or ramp or in any of the color parameters sliders. You can adjust such parameters with the spinbox beside or, handy, scrolling the mouse wheel over the corresponding slider. You can also typeset the color html notation.
The dialog also provides a visual comparison between the current (applied to widget) and the new (being selected) colors. Thanks to drag-and-drop, any of these colors can be saved in a slot for an easy access.
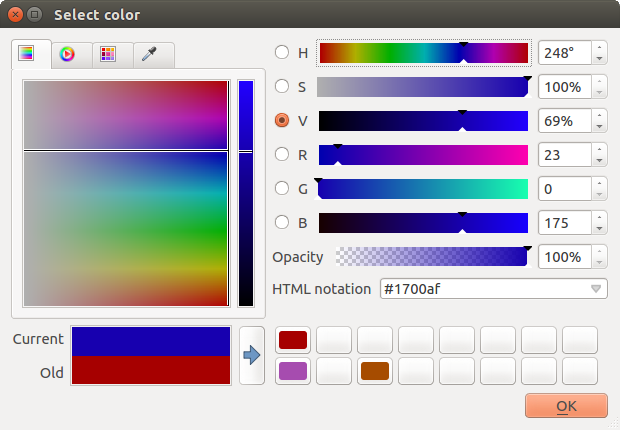
색상 선택기의 색상표 탭
With color ramp or color wheel tab,
you can browse to all possible color combinations and apply it to the item.
In the color swatches tab, you can choose from a
preselected list of color palettes:
- Recent colors,
- Standard colors, a user-defined list of colors set under Settings ‣ Options ‣ Colors menu
- or Project colors, a user-defined list of colors set under Project ‣ Project Properties ‣ Default Styles.
The latest palettes can be modified thanks to the  and
and  buttons at the bottom of the frame.
The ... button nearby the palette combobox also offers several
options to:
buttons at the bottom of the frame.
The ... button nearby the palette combobox also offers several
options to:
색상을 복사, 붙여넣기, 불러오기 또는 내보내기
- create, import or remove color palettes. Check the Show in Color Buttons option to add the custom palette to the color selector widget (see figure_color_selector).
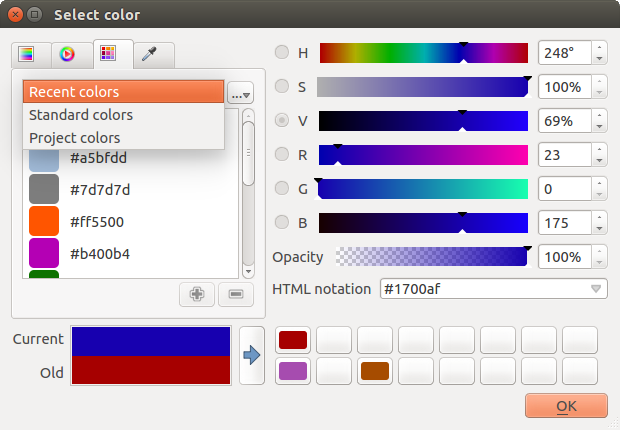
Color selector switcher tab
Another option is to use the color picker which allows
you to sample a color from under your mouse pointer at any part of
QGIS or even from another application by pressing the space bar. Please note
that the color picker is OS dependent and is currently not supported by macOS.
참고
빠른 색상 조정
Click the drop-down arrow at the right of the color box button
to display a widget for a quick color selection, either in the color wheel or
from existing color palettes. You can also use it to copy or
paste a color.
빠른 색상 선택기 메뉴
혼합 모드
QGIS offers different options for special rendering effects with these tools that you may previously only know from graphics programs. Blending modes can be applied on layers, on features but also on print composer items:
Normal: 표준 혼합 모드로, 위에 있는 픽셀의 알파 채널을 이용해서 밑에 있는 픽셀과 혼합합니다. 색상은 섞이지 않습니다.
Lighten: 위에 있는 픽셀과 밑에 있는 픽셀로부터 각 요소의 최대값을 선택합니다. 이 모드의 산출물은 경계가 도드라져 보기 안 좋은 경향이 있다는 사실을 주의하십시오.
- Screen: Light pixels from the source are painted over the destination, while dark pixels are not. This mode is most useful for mixing the texture of one item with another item (e.g., you can use a hillshade to texture another layer).
- Dodge: Dodge will brighten and saturate underlying pixels based on the lightness of the top pixel. So, brighter top pixels cause the saturation and brightness of the underlying pixels to increase. This works best if the top pixels aren’t too bright; otherwise the effect is too extreme.
- Addition: This blend mode simply adds pixel values of one item with the other. In case of values above one (in the case of RGB), white is displayed. This mode is suitable for highlighting features.
- Darken: This creates a resultant pixel that retains the smallest components of the foreground and background pixels. Like lighten, the results tend to be jagged and harsh.
- Multiply: Here, the numbers for each pixel of the top item are multiplied with the corresponding pixels for the bottom item. The results are darker pictures.
- Burn: Darker colors in the top item cause the underlying items to darken. Burn can be used to tweak and colorise underlying layers.
- Overlay: This mode combines the multiply and screen blending modes. In the resulting picture, light parts become lighter and dark parts become darker.
- Soft light: This is very similar to overlay, but instead of using multiply/screen it uses color burn/dodge. This is supposed to emulate shining a soft light onto an image.
Hard light: 이 모드도 Overlay 모드와 매우 비슷합니다. 이미지 상에 아주 강렬한 빛을 비추는 것 같은 효과를 낸다고 합니다.
- Difference: Difference subtracts the top pixel from the bottom pixel, or the other way around, to always get a positive value. Blending with black produces no change, as the difference with all colors is zero.
- Subtract: This blend mode simply subtracts pixel values of one item from the other. In case of negative values, black is displayed.
확대/축소 및 이동
QGIS는 사용자의 관심 지역으로 확대/축소하거나 이동할 수 있는 도구를 제공합니다.
Apart from using the  pan and
  zoom-in /
  zoom-out icons on the toolbar
with the mouse, navigating can also be done with the mouse wheel, spacebar
and the arrow keys. A Zoom factor can be set under the
Settings ‣
zoom-out icons on the toolbar
with the mouse, navigating can also be done with the mouse wheel, spacebar
and the arrow keys. A Zoom factor can be set under the
Settings ‣  Options ‣ Map tools
menu to define the scale behavior while zooming.
Options ‣ Map tools
menu to define the scale behavior while zooming.
마우스 휠 사용법
You can press the mouse wheel to pan inside of the main window (on macOS, you may need to hold cmd key). You can roll the mouse wheel to zoom in and out on the map; the mouse cursor position will be the center of the zoomed area of interest. Holding down Ctrl while rolling the mouse wheel results in a finer zoom.
방향 키 사용법
Panning the map is possible with the arrow keys. Place the mouse cursor inside the map area, and click on the right arrow key to pan east, left arrow key to pan west, up arrow key to pan north, and down arrow key to pan south.
You can also use the space bar to temporarily cause mouse movements to pan the map. The PgUp and PgDown keys on your keyboard will cause the map display to zoom in or out following the zoom factor set. Pressing Ctrl + or Ctrl - also performs an immediate zoom in/out on the map canvas.
When certain map tools are active (Identify, Measure...), you can perform a zoom by holding down Shift and dragging a rectangle on the map to zoom to that area. This is enabled for the map tools which are not selection tools (since they use Shift for adding to selection) nor edit tools.
측정
일반 정보
QGIS는 도형을 측정하는 네 가지 방법을 제공하고 있습니다:
- the interactive measurement tools
 ,
, - measuring in the
 Field Calculator,
 - derived measures in the Identify Features tool,
- and a vector analysis tool: Vector ‣ Geometry Tools ‣ Export/Add Geometry Columns
측정 작업은 (UTM 같은) 투영좌표계 및 투영체가 정의되지 않은 데이터 안에서 이루어집니다. 처음 세 가지 측정 도구의 습성은 일반 투영 설정과 동일합니다:
- If “on the fly” CRS transformation (see 실시간(OTF) 좌표계 변환 정의) is enabled, the default measurement metric is - different from most other GIS - ellipsoidal, using the ellipsoid defined in File ‣ Project properties ‣ General. This is true both when geographic and projected coordinate systems are defined for the project.
- If you want to calculate the projected / planimetric area or distance using cartesian maths, the measurement ellipsoid has to be set to “None / Planimetric” (File ‣ Project properties ‣ CRS). However, with a geographic (= unprojected) CRS defined for the data and project, area and distance measurement will be ellipsoidal.
- If “on the fly” CRS transformation is disabled, the measurement metric is planimetric when the project coordinate system is projected and ellipsoidal when the project coordinate system is unprojected / geographic.
However, neither the identify tool nor the field calculator will transform your data to the project CRS before measuring. If you want to achieve this, you have to use the vector analysis tool: Vector ‣ Geometry Tools ‣ Export/Add Geometry Columns. Here, measurement is by default planimetric except if you choose the ellipsoidal measure.
Measure length, areas and angles interactive
Click the icon in the Attribute toolbar to begin measurements.
The downward arrow near the icon helps you switch to the convenient tool to measure
length,  area or
  angle.
The default unit used in the dialog is the one set in Project ‣
Project Properties ‣ General menu.
angle.
The default unit used in the dialog is the one set in Project ‣
Project Properties ‣ General menu.
주석
측정 도구 환경 설정
While measuring length or area, clicking the Configuration button at the bottom of the widget helps you define in menu Settings ‣ Options ‣ Map Tools the rubberband color, the precision of the measurements and the unit behavior. You can also choose your preferred measurement or angle units but keep in mind that those values are superseded in the current project by options made in Project ‣ Project Properties ‣ General menu.
모든 측정 모듈은 디지타이즈 작업 모듈의 스냅 설정(스냅 허용 오차 및 검색 반경 설정 참조)을 이용합니다. 따라서 라인 피처를 따라서든 폴리곤 피처를 돌아서든, 정확히 측정하려면 먼저 레이어 스냅 허용 오차를 설정해야 합니다. 그러면 측정 도구 사용 시 (허용 오차 설정 범위 내의) 각 마우스 클릭이 해당 레이어에 스냅할 것입니다.
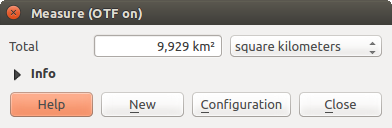
By default, Measure Line: QGIS measures real distances
between given points according to a defined ellipsoid.
The tool then allows you to click points on the map. Each segment length,
as well as the total, shows up in the measure window.
To stop measuring, click your right mouse button.
Note that you can use the drop-down list near the total to interactively change the measurement units while measuring. This unit is kept for the widget until a new or another project is opened.
The Info section in the dialog explains how calculations are made according to CRS settings available.

거리 측정
Measure Area: Areas can also be measured. In the
measure window, the accumulated area size appears. Right-click to stop drawing.
The Info section is also available as well as the ability to switch between
different area units.
면적 측정
Measure Angle: You can also measure angles. The
cursor becomes cross-shaped. Click to draw the first segment of the angle you
wish to measure, then move the cursor to draw the desired angle. The measure
is displayed in a pop-up dialog.
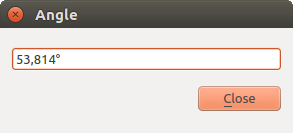
각도 측정
피처 선택
QGIS provides several tools to select features in the map canvas. Selection tools are available in View ‣ Select menu or in the Attributes toolbar.
주석
선택 도구는 현재 활성화된 레이어 상에서 동작합니다.
Selecting manually in the map canvas
To select one or several features with the mouse, you can use one of the following tools:
 Select Features by area or single click
 Select Features by Polygon
 Select Features by Freehand
 Select Features by Radius
주석
Except the Select Features by Polygon tool, these
manual selection tools allow you to select feature(s) in the map canvas with a
single click.
While using the Select Feature(s) tool,
holding Shift or Ctrl toggles whether feature is selected
(ie either adds to the current selection or remove from it).
For the other tools, different behaviors can be performed holding:
Shift: 현재 선택 집합에 피처를 추가
Ctrl: 현재 선택 집합에서 피처를 제거
- Ctrl + Shift: intersect with current selection, ie only keep overlapping features from the current selection
- Alt: select features that are totally within the selection shape. Combined to Shift or Ctrl keys, you can add or substract features to/from the current selection.
자동 선택
The other selection tools, also available from the Attribute table, perform a selection based on feature’s attribute or its selection state (note that attribute table and map canvas show the same information, so if you select one feature in attribute table, it will be selected in map canvas also):
 Select By Expression... allows user to select
features using expression dialog.
Select By Expression... allows user to select
features using expression dialog. Select Features By Value... 도구 또는 F3 키
 Deselect Features from All Layers or press
Ctrl+Shift+A to deselect all selected features in all layers.
Deselect Features from All Layers or press
Ctrl+Shift+A to deselect all selected features in all layers. Select All Features or press Ctrl+A to select all
features in the current layer.
Select All Features or press Ctrl+A to select all
features in the current layer. Invert Feature Selection to invert the selection in
the current layer.
Invert Feature Selection to invert the selection in
the current layer.
For example, if you want to find regions that are boroughs from
regions.shp of the QGIS sample data, you can use the
Select features using an Expression icon. Then, you open the
Fields and Values menu and choose the field that you want to query.
Double-click the field ‘TYPE_2’ and also click [Load all unique values]
in the right panel. From the list, choose and double-click ‘Borough’. In the
Expression field, then you’d write the following query:
"TYPE_2" = 'Borough'
From the expression builder dialog, you can also use the Function list ‣ Recent (Selection) to make a selection that you used before. The dialog remembers the last 20 used expressions. See 표현식 chapter for more information and some example.
참고
사용자 선택 집합을 새 파일로 저장
Users can save selected features into a New Temporary Scratch Layer or a New Vector Layer using Edit ‣ Copy Features and Edit ‣ Paste Features as in the wanted format.
값으로 피처 선택
This selection tool opens the layer’s feature form allowing the user to choose, for each field, which value to look for, if the search should be case sensitive, and the operation that should be used.
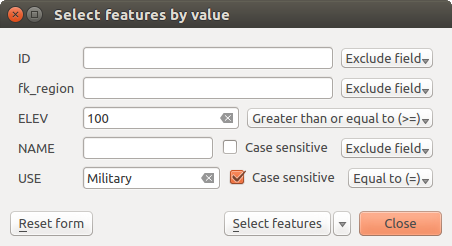
양식 대화창을 이용해 피처 필터링/선택
Alongside each field, there is a drop-down list with the operation options to control the search behaviour. The common options are:
- Exclude Field - The field will not be used for searching
- Equal to (=)
- Not equal to
- Is missing (null)
- Is not missing (not null)
For numeric and datetime fields, the additional options are:
- Greater than (>)
- Less than (<)
- Greater than or equal to (>=)
- Less than or equal to (<=)
- Between (inclusive)
- Is not between (inclusive)
For text fields, the additional options are:
- Contains
- Does not contain
For the text options above, it is also possible to use the
Case sensitive option.
After setting all search options, you can use the Select features button to select the matching features. The drop-down options are:
- Select features
- Add to current selection
- Filter current selection
- Remove from current current selection
You can also clean all search options using the Reset form button.
데이터 정의 무시 설정
Beside many options in the vector layer properties dialog or settings in the print
composer, you can find a  Data defined override icon.
Thanks to expressions based on layer attributes or item
settings, prebuild or custom functions and variables,
this tool allows you to set dynamic value for the concerned parameter. When enabled,
the value returned by this widget is applied to the parameter regardless its normal
value (checkbox, textbox, slider...).
Data defined override icon.
Thanks to expressions based on layer attributes or item
settings, prebuild or custom functions and variables,
this tool allows you to set dynamic value for the concerned parameter. When enabled,
the value returned by this widget is applied to the parameter regardless its normal
value (checkbox, textbox, slider...).
Clicking the Data defined override icon shows following entries:
- Description... that indicates if the option is enabled, which input is expected, the valid input type and the current definition. Hovering over the widget also pops up these information;
- Field type: an entry to select from the layer’s fields that match the valid input type;
- an entry to list the Variable available;
- Edit... button to create or edit the expression to use;
- Paste and Copy buttons;
Clear 버튼은 설정을 초기화합니다.
Parameters that can be used with data-defined tools are:
- Style and symbols parameters
- Labels parameters
- Composer parameters
참고
Use right-click to (de)activate the data overriding
You can enable or disable a configured data-defined
override button by simply clicking the widget with the mouse right button.
주석
When the data-defined override option is setup correctly the
icon is yellow  or
or  ; if it is broken,
the icon is red
; if it is broken,
the icon is red  or
or  .
.
Identify Features
식별 도구를 통해 맵 캔버스와 상호작용해서 팝업창으로 피처에 대한 정보를 얻을 수 있습니다. 피처를 식별하려면, 다음 도구를 이용하십시오:
- View ‣ Identify Features menu,
- or press Ctrl + Shift + I (or Cmd + Shift + I),
- or click the
 Identify Features icon on the Attributes toolbar.
피처 식별 도구 이용하기
QGIS offers two ways to identify features with the
Identify Features tool:
- left click will identify features according to the mode set in the Identify Results panel
- right click will fetch all the snapped features from all the visible layers. This will open a context menu, allowing the user to choose more precisely the features to identify.
참고
쿼리할 레이어를 피처 식별 도구로 필터링하기
Uncheck the Identifiable column in Project ‣
(or  Settings ‣), Project
Properties ‣ Identify layers menu in front of a layer to avoid it
being queried when using the Identify Features in a mode
other than Current Layer. This is a handy way to return features from only
layers that are of interest for you.
Settings ‣), Project
Properties ‣ Identify layers menu in front of a layer to avoid it
being queried when using the Identify Features in a mode
other than Current Layer. This is a handy way to return features from only
layers that are of interest for you.
If you click on feature(s), the Identify Results dialog will list information about the clicked feature(s). The default view is a tree view where the first item is the name of the layer and its children are its identified feature(s). Each feature is described by the name of a field along with its value. This field is the one set in Layer Properties ‣ Display. Then follows all the other information about the feature.
Feature informations
The Identify Results dialog can be customized to display custom fields, but by default it will display three kinds of information:
Actions: 피처 식별 창에 액션을 추가할 수 있습니다. 액션 라벨을 클릭해서 액션을 수행합니다. 기본적으로, 편집 작업을 위한 View feature form 이라는 액션 하나만 추가돼 있습니다. 레이어의 속성 대화창에서 더 많은 액션을 정의할 수 있습니다. (액션 속성 참조)
- Derived: This information is calculated or derived from other information.
This includes:
- general information about the feature and its geometry: feature id, length or perimeter and area in map units depending on its geometry, the count of spatial parts and the number of the clicked part in case of multi-geometry, the count of vertices in the feature and the number of the closest one to the point clicked
- coordinates information: the X and Y (and Z/M if available) coordinate values of the clicked point, the feature closest vertex and its first and last vertices. In case you click on a curved line using the info tool, QGIS will also display the radius of that section in the panel result.
Data attributes: 사용자가 클릭한 피처의 속성 필드 및 값들의 목록입니다.
주석
Links in feature’s attributes are clickable from the Identify Results panel and will open in your default web browser.
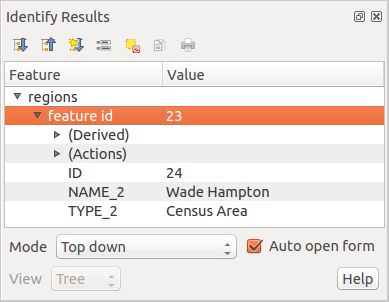
식별 결과 대화창
식별 결과 대화창
At the top of the window, you have seven icons:
- Expand tree
- Collapse tree
 Default behavior to define whether next
identified features information should be collapsed or expanded
Default behavior to define whether next
identified features information should be collapsed or expanded View the feature form
- Clear Results
 Copy selected feature to clipboard
 Print selected HTML response
At the bottom of the window, you have the Mode and View comboboxes. With the Mode combobox you can define from which layers features should be identified:
- Current layer : only features from the selected layer are identified. The layer may not be visible in the canvas.
- Top down, stop at first: for only features from the upper visible layer.
- Top down: for all features from the visible layers. The results are shown in the panel.
- and Layer selection: opens a context menu where the user selects the layer to identify features from. Operates like a right-click. Only the chosen features will be shown in the result panel.
주석
Identify tool configuration
You can configure the identify feature in Project ‣ Project Properties in the Identify layers tab. The table allows user to select layer(s) that can be used by this tool to identify features (column Identifiable). You can also put this layer in read-only mode with the checkbox in the last column.
View 를 트리, 테이블 또는 그래프 로 설정할 수 있습니다. 래스터 레이어에 대해서만 ‘테이블’과 ‘그래프’를 설정할 수 있습니다.
The identify tool allows you to Auto open a form.
If checked, each time a single feature is identified QGIS will open a form
showing its attributes. This is a handy way to quickly edit a feature’s attributes.
식별된 항목의 컨텍스트 메뉴에서 다른 기능도 찾아볼 수 있습니다. 예를 들면, 컨텍스트 메뉴를 통해 다음 작업을 할 수 있습니다:
피처 양식 보기
피처로 확대/축소
피처 복사: 모든 피처 도형 및 속성 복사
- Toggle feature selection: Adds identified feature to selection
속성값 복사: 사용자가 클릭한 속성값만 복사
피처 속성 복사: 피처의 속성을 복사
결과 삭제: 창에서 식별 결과를 제거
강조 삭제: 맵 상에서 강조된 피처를 제거
모든 피처 강조
레이어 강조
레이어 활성화: 활성화할 레이어를 선택
레이어 속성: 레이어 속성 창 열기
모두 확장
모두 접기
주석 도구
The  Text Annotation tool in the attribute
toolbar provides the possibility to place formatted text in a balloon on the
QGIS map canvas. Use the Text Annotation tool and click into the
map canvas.
Text Annotation tool in the attribute
toolbar provides the possibility to place formatted text in a balloon on the
QGIS map canvas. Use the Text Annotation tool and click into the
map canvas.
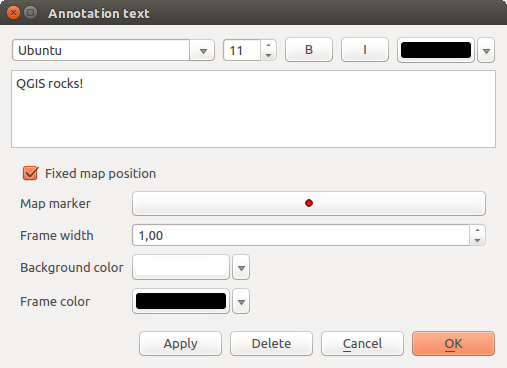
주석 텍스트 대화창
Double clicking on the item opens a dialog with various options. There is the text editor to enter the formatted text and other item settings. For instance, there is the choice of having the item placed on a map position (displayed by a marker symbol) or to have the item on a screen position (not related to the map). The item can be moved by map position (by dragging the map marker) or by moving only the balloon. The icons are part of the GIS theme, and they are used by default in the other themes, too.
The  Move Annotation tool allows you to move the
annotation on the map canvas.
Move Annotation tool allows you to move the
annotation on the map canvas.
Html annotations
The  Html Annotation tools in the attribute
toolbar provides the possibility to place the content of an html file in a
balloon on the QGIS map canvas. Using the Html Annotation tool,
click into the map canvas and add the path to the html file into the dialog.
Html Annotation tools in the attribute
toolbar provides the possibility to place the content of an html file in a
balloon on the QGIS map canvas. Using the Html Annotation tool,
click into the map canvas and add the path to the html file into the dialog.
SVG annotations
The  SVG Annotation tool in the attribute toolbar
provides the possibility to place an SVG symbol in a balloon on the QGIS map
canvas. Using the SVG Annotation tool, click into the map canvas and
add the path to the SVG file into the dialog.
SVG Annotation tool in the attribute toolbar
provides the possibility to place an SVG symbol in a balloon on the QGIS map
canvas. Using the SVG Annotation tool, click into the map canvas and
add the path to the SVG file into the dialog.
Form annotations
Additionally, you can also create your own annotation forms. The
Form Annotation tool is useful to display
attributes of a vector layer in a customized Qt Designer form (see
figure_custom_annotation). This is similar to the designer forms for the
Identify features tool, but displayed in an annotation item.
Also see this video https://youtu.be/0pDBuSbQ02o?t=2m25s from
Tim Sutton for more information.
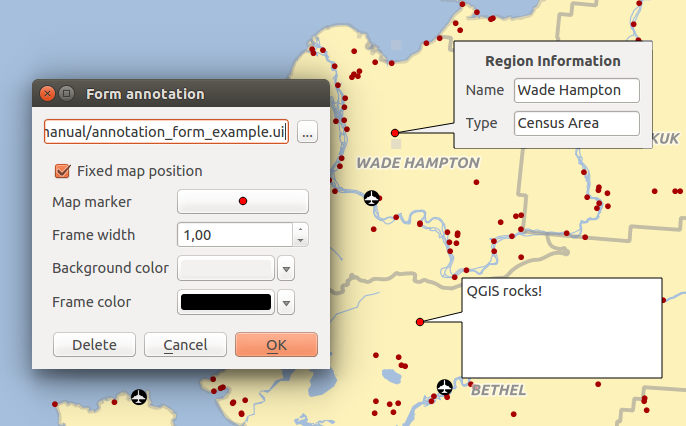
Customized qt designer annotation form
주석
If you press Ctrl+T while an Annotation tool is active (move annotation, text annotation, form annotation), the visibility states of the items are inverted.
공간 북마크
공간 북마크를 통해 지리적 위치에 “책갈피”를 끼워 나중에 다시 돌아올 수 있습니다. 기본적으로 북마크는 컴퓨터에 저장되는데, 동일한 컴퓨터일 경우 어떤 프로젝트에서도 사용할 수 있다는 뜻입니다. 북마크를 프로젝트 파일(.qgs)에 저장하고 싶은 경우, In Project 체크박스를 체크하면 됩니다.
북마크 생성
북마크를 생성하려면:
관심 지역으로 확대/축소 또는 이동하십시오.
- Select the menu option View ‣ New Bookmark or press Ctrl-B. The Spatial Bookmark panel opens with the newly created bookmark.
북마크를 잘 설명하는 명칭을 (영문자 255개까지 지원합니다) 입력하십시오.
북마크를 프로젝트 파일에 저장하고 싶다면 In Project 체크박스를 체크하십시오.
북마크를 추가하려면 Enter 를 누르거나 패널 외 다른 곳을 클릭하십시오.
북마크 여러 개를 동일한 명칭으로 만들 수 있다는 사실을 기억하십시오.
북마크 관련 작업
To use or manage bookmarks, select the menu option View ‣ Show Bookmarks. The Spatial Bookmarks panel allows you to:
북마크로 확대/축소: 원하는 북마크를 선택한 다음 Zoom To Bookmark 를 클릭하십시오. 북마크를 더블 클릭해도 해당 위치로 확대/축소할 수 있습니다.
북마크 삭제: 북마크를 선택한 다음 Delete Bookmark 를 클릭하십시오. 사용자가 한 번 더 확인해야 합니다.
- Import or Export a bookmark: To share or transfer your bookmarks between computers you can use the Import/Export Bookmarks pull down menu in the Spatial Bookmarks dialog. All the bookmarks are transferred.
프로젝트 내포 작업
Sometimes, you’d like to keep in different projects a bunch of layers with the same style. You can either create a default style for these layers or embed them from another project to save you tons of work.
기존 프로젝트로부터 레이어 및 그룹을 내포시키면 스타일과 관련해 몇몇 장점이 생깁니다:
- all types of layers (vector or raster, local or online...) can be added
- fetching groups and layers, you can keep the same tree structure of the “background” layers in your different projects
- While the embedded layers are editable, you can’t change their properties such as symbology, labels, forms, default values, actions... This ensures homogeneity throughout the projects
- modify the items in the original project and changes are propagated to all the other projects.
If you want to embed content from other project files into your project, select Layer ‣ Embed Layers and Groups and:
- Press
 to look for a project; you can see the content of the
project (see figure_embed_dialog).
to look for a project; you can see the content of the
project (see figure_embed_dialog). - Press Ctrl ( or Cmd) and click on the layers and
groups you wish to retrieve.
- Press [OK]. The selected layers and groups are embedded in the Layer panel and can be visualized in the map canvas now. Names of embedded items appear in italic to distinguish them from regular layers and groups.
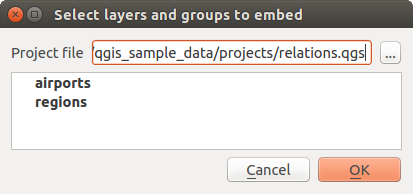
삽입할 레이어 및 그룹 선택
Like any other layer, an embedded layer can be removed from the project by
right-click on the layer and choose Remove.
참고
내포 레이어의 렌더링 변경
It’s not possible to change rendering of an embedded layer, unless you make the changes in the original project file. However, right-click on a layer and select Duplicate creates a layer which is fully-featured and not dependent to the original project. You can then safely remove the linked layer.
지도 장식
The Decorations of QGIS include the Grid, the Copyright Label, the North Arrow and the Scale Bar. They are used to ‘decorate’ the map by adding cartographic elements.
그리드
 Grid 를 통해 맵 캔버스에 좌표 격자 및 좌표 주석을 추가할 수 있습니다.
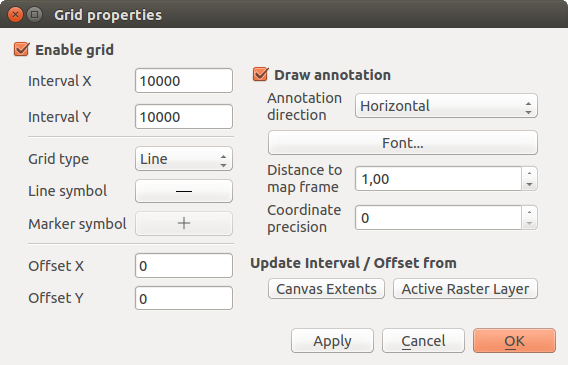
그리드 대화창
- Select from menu View ‣ Decorations ‣ Grid. The dialog starts (see figure_decorations_grid).
- Activate the Enable grid checkbox and set grid
definitions according to the layers loaded in the map canvas.
- Activate the Draw annotations checkbox and set
annotation definitions according to the layers loaded in the map canvas.
- Click [Apply] to verify that it looks as expected or [OK] if you’re satisfied.
저작권 라벨
 Copyright label adds a copyright label using the text
you prefer to the map.
Copyright label adds a copyright label using the text
you prefer to the map.

저작권 대화창
- Select from menu View ‣ Decorations ‣ Copyright Label. The dialog starts (see figure_decorations_copyright).
- Make sure the Enable Copyright Label checkbox is
checked.
- Enter the text you want to place on the map. You can use HTML as shown in the example.
Placement
콤보박스를 이용해서 라벨의 위치를 선택하십시오.- You can refine the placement of the item by setting a Horizontal and/or Vertical Marging from (Canvas) Edge. These values can be a distance in Millimeter or Pixels or set as Percentage of the width or height of the map canvas.
- You can change the color to apply.
- Click [Apply] to verify that it looks as expected or [OK] if you’re satisfied.
In the example above, which is the default, QGIS places a copyright symbol followed by the date in the lower right-hand corner of the map canvas.
방위표
![]() North Arrow places a simple north arrow on the map canvas.
Currently, there is only one style available. You can adjust the angle of the
arrow or let QGIS set the direction automatically.
If you choose to let QGIS determine the direction, it makes its best guess
as to how the arrow should be oriented.
For placement of the arrow, you have four options, corresponding to
the four corners of the map canvas.
You can refine the placement of the arrow by setting a Horizontal and/or Vertical
Marging from (Canvas) Edge. These values can be a distance in Millimeter or
Pixels or set as Percentage of the width or height of the map canvas.
North Arrow places a simple north arrow on the map canvas.
Currently, there is only one style available. You can adjust the angle of the
arrow or let QGIS set the direction automatically.
If you choose to let QGIS determine the direction, it makes its best guess
as to how the arrow should be oriented.
For placement of the arrow, you have four options, corresponding to
the four corners of the map canvas.
You can refine the placement of the arrow by setting a Horizontal and/or Vertical
Marging from (Canvas) Edge. These values can be a distance in Millimeter or
Pixels or set as Percentage of the width or height of the map canvas.
방위표 대화창
축척 막대
 Scale Bar 도구는 맵 캔버스에 단순한 축척 막대를 추가합니다. 사용자가 스타일과 위치는 물론 막대의 라벨도 제어할 수 있습니다.
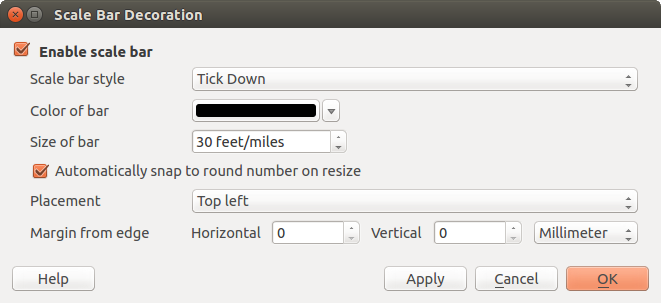
축척 막대 대화창
QGIS only supports displaying the scale in the same units as your map frame. So if the units of your layers are in meters, you can’t create a scale bar in feet. Likewise, if you are using decimal degrees, you can’t create a scale bar to display distance in meters.
축척 막대를 추가하려면:
- Select from menu View ‣ Decorations ‣ Scale Bar. The dialog starts (see figure_decorations_scale).
- Make sure the Enable scale bar checkbox is checked.
- Choose the style from the Scale bar style
combo box.
- Select the color for the bar Color of bar or use
the default black color.
- Set the Size of bar
 .
. - Optionally, check Automatically snap to round number
on resize to display values easy-to-read.
- Choose the placement from the Placement combo box.
- You can refine the placement of the item by setting a Horizontal and/or Vertical Marging from (Canvas) Edge. These values can be a distance in Millimeter or Pixels or set as Percentage of the width or height of the map canvas.
- Click [Apply] to verify that it looks as expected or [OK] if you’re satisfied.
참고
Settings of Decorations
When you save a .qgs project, any changes you have made to Grid, North Arrow, Scale Bar and Copyright will be saved in the project and restored the next time you load the project.
인증
QGIS has facility to store/retrieve authentication credentials in a secure manner. Users can securely save credentials into authentication configurations, which are stored in a portable database, can be applied to server or database connections, and safely referenced by their ID tokens in project or settings files. For more information see 인증 시스템.
인증 시스템 및 그 자체 데이터베이스를 처음 실행할 때 마스터 비밀번호를 설정해줘야 합니다.
Variables
In QGIS, you can use variables to store useful recurrent values (e.g. the project’s title, or the user’s full name) that can be used in expressions. Variables can be defined at the application’s global level, project level, layer level, composition level, and composer’s item level. Just like CSS cascading rules, variables can be overwritten - e.g., a project level variable will overwrite any application’s global level variables set with the same name. You can use these variables to build text strings or other custom expressions using the @ character before the variable name. For example in composer creating a label with this content:
This map was made using QGIS [% @qgis_version %]. The project file for this
map is: [% @project_path %]
다음과 같은 라벨로 렌더링됩니다:
This map was made using QGIS 2.14. The project file for this map is:
/gis/qgis-user-conference-2015.qgs
사전 설정된 읽기 전용 변수 이외에도, 사용자가 앞에서 언급한 모든 레벨에서 사용자 지정 변수를 정의할 수 있습니다. 다음 변수들을 관리할 수 있습니다:
- global variables from the Settings ‣ Options menu;
- project’s variables from Project properties (see 프로젝트 속성);
- vector layer’s variables from the Layer Properties dialog (see 벡터 속성 대화창);
- composition’s variables from the Composition panel in the Print composer (see Composition Panel);
- and composer item’s variables from the Item properties panel in the Print composer (see Composer Items Common Options).
To differentiate from editable variables, read-only variable’s names and values are emphasized in italic. On the other hand, higher level variables overwritten by lower level ones are strike through.
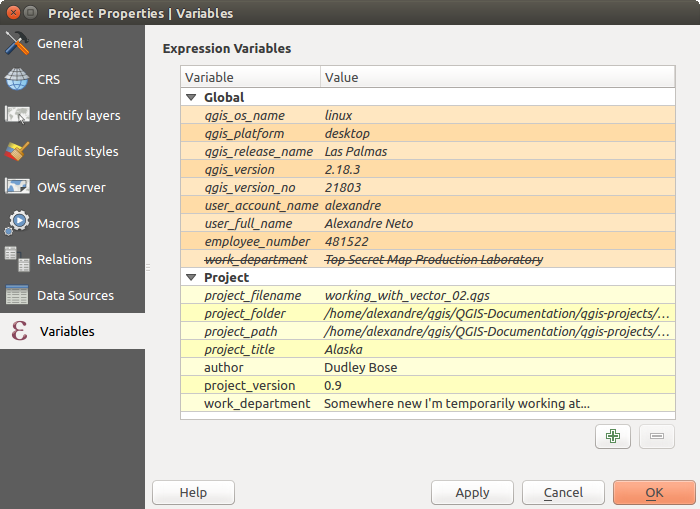
Variables editor at the project’s level
주석
You can read more about variables and find some examples in Nyall Dawson’s Exploring variables in QGIS 2.12, part 1, part 2 and part 3 blog posts.