` `
심볼 라이브러리
스타일 관리자
The Style Manager is the place where users can manage and create generic symbols to be used in several QGIS projects. You can open it with the Settings ‣ Style Manager or from the Style tab in the vector layer’s Properties. It allows users to:
- create, edit and remove symbols
- organize symbols in custom groups
- export and import symbols.
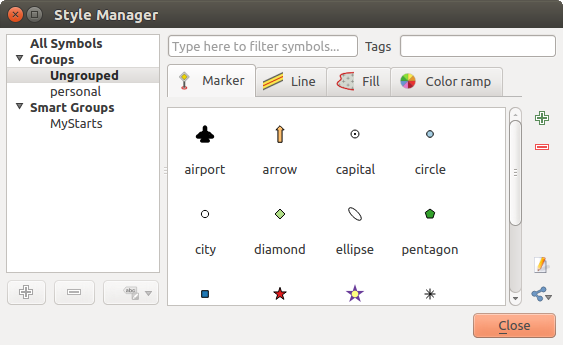
스타일 관리자
Groups and smart groups
You can organize symbols into different categories. These categories, listed in the panel at the left, can be static (called Group) or dynamic (named Smart Group). A group is smart when its symbols are dynamically fetched according to conditions set. See figure_smart_group:
To create a group, right click on an existing group or on the main Groups
directory in the left of the dialog.
You can also select a group and click the  Add Group
button. The new group will be a sub-group of the selected one.
Add Group
button. The new group will be a sub-group of the selected one.
Create Smart Group is similar to creating group, but instead select Smart Groups. The dialog box allows user to choose the expression to select symbols in order to appear in the smart group (contains some tags, member of a group, have a string in its name, etc.). Any symbol that satisfies the entered condition(s) is automatically added to the smart group.
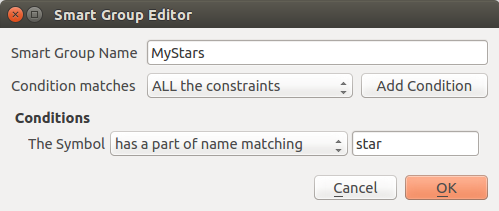
스마트 그룹 생성하기
To remove a group or a smart group, right click on the group and select
Remove Group or select it and push
 Remove Group button.
Unlike the smart groups that automatically fetch their belonged symbols,
simple groups are filled by the user.
To add a symbol into a group, you can either right click on a symbol, choose
Apply Group and then the group name. There is a second
way to add several symbols into a group: just select the group, click
 and choose Group Symbols. All
symbols display a checkbox that allows you to add the symbol into the selected
groups. When selection is finished, you can click the same button, and
choose Finish Grouping.
and choose Group Symbols. All
symbols display a checkbox that allows you to add the symbol into the selected
groups. When selection is finished, you can click the same button, and
choose Finish Grouping.
All the symbols that are not placed under a custom group belong to a default group named Ungrouped.
Add, Edit, Remove Symbol
Selecting a group returns in the right panel, if applicable, the list of symbols of the group (including its subgroups). These symbols are organized in four different tabs:
- Marker for point symbols
- Line for linear symbols
- Fill for surface symbols
- and 색상표.
To delete a symbol you no longer need, just select it and click
Remove item (also available through right-click).
The symbol will be deleted from the local symbols database.
The symbol list can be modified by adding new symbols with
Add item button or modifying existing ones with  Edit item.
See 심볼 선택기 for further information.
Edit item.
See 심볼 선택기 for further information.
Share symbols
The  Share item tool, at the right bottom of the Style
Library dialog, offers options to easily share symbols with others: users can
indeed export their symbols and import symbols to their library.
Share item tool, at the right bottom of the Style
Library dialog, offers options to easily share symbols with others: users can
indeed export their symbols and import symbols to their library.
Exporting symbols
You can export the selected symbols to PNG, SVG or XML file formats. Exporting to PNG or SVG (both not available for color ramp symbols) creates a file for each selected symbol, and the SVG folder can be added to SVG Paths in Settings ‣ Options to e.g. share these symbols on a network. The XML format generates a single file containing all the selected symbols. This file can then be imported in another user’s style library.
Importing symbols
You can extend your symbols library by importing new symbols. Just select
Import from the drop-down list at the right bottom of the dialog.
In the new dialog, you’ll need to :
- indicate the source of the symbols (it can be a .xml file on the disk or an url),
- give the name of the group under which the symbols will be put
- select the symbols you want to add to your library
- and press Import.
Note that import and export options are also available through right-click.
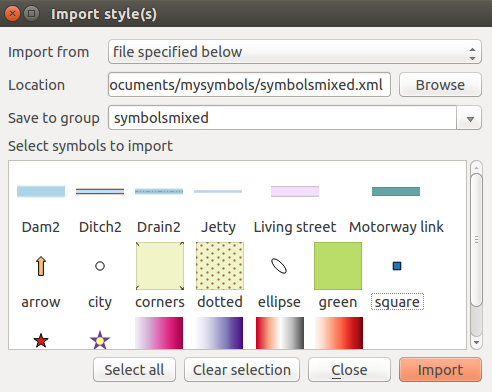
Importing symbols
색상표
The Color ramp tab in the Style Manager presents different types of color ramps you can use to style layers.
사용자 지정 색상표를 생성하려면, Color ramp 탭으로 가서 Add item 버튼을 클릭한 다음 드롭다운 목록에서 다음 색상표 유형 가운데 하나를 선택하십시오:
Gradient: 시작 및 끝 색상을 설정해서 연속적(continuous) 일수도 있고 비연속적(discrete) 일 수도 있는 색상표를 생성합니다. 색상표 미리보기를 더블 클릭하면 중간 색상 지점(intermediate color stop)을 사용자가 원하는 만큼 추가할 수 있습니다.
- Random: creates a random set of colors based on range of values for hue, saturation, value and opacity and a number of colors (classes)
- ColorBrewer: a set of predefined discrete color gradients you can custom the number of colors in the ramp
- or cpt-city: an access to a whole catalog of color gradients to locally save as gradient color.
참고
Easily custom the color stops of the gradient color ramp
색상표 미리보기를 더블 클릭하거나, 색상 스폿(color spot)에서 색상표 미리보기로 색상을 드래그&드롭하면 새 색상 지점을 추가합니다. 색상 선택기 위젯을 이용하거나, 색상 지점의 각 파라미터를 조정하면 각 색상 지점을 조정할 수 있습니다. 마우스, 방향키(Shift 키와 함께 누르면 더 길게 움직입니다) 또는 Relative position 스핀박스(spinbox)를 이용해서 색상 지점의 위치도 이동시킬 수 있습니다. DEL 키는 물론 Delete stop 버튼을 누르면 선택한 색상 지점을 삭제합니다.
You can use the  Invert option while
classifying the data with a color ramp. See figure_color_custom_ramp for an
example of a custom color ramp and figure_color_cpt_city for the cpt-city Colors dialog.
Invert option while
classifying the data with a color ramp. See figure_color_custom_ramp for an
example of a custom color ramp and figure_color_cpt_city for the cpt-city Colors dialog.
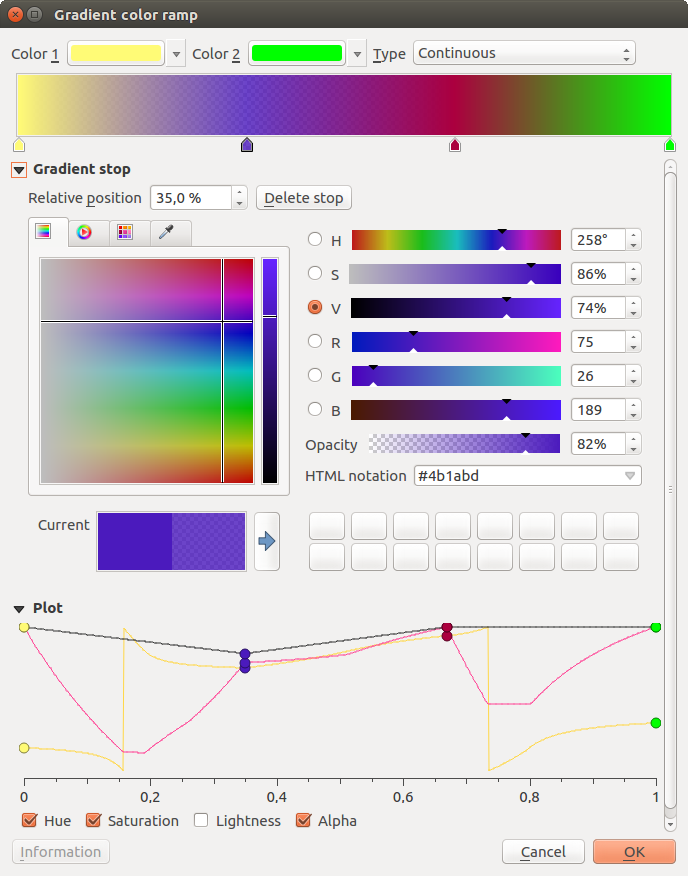
복수의 색상을 지정한 사용자 지정 그레이디언트 색상표의 예시
The cpt-city option opens a new dialog with hundreds of themes included ‘out of the box’.
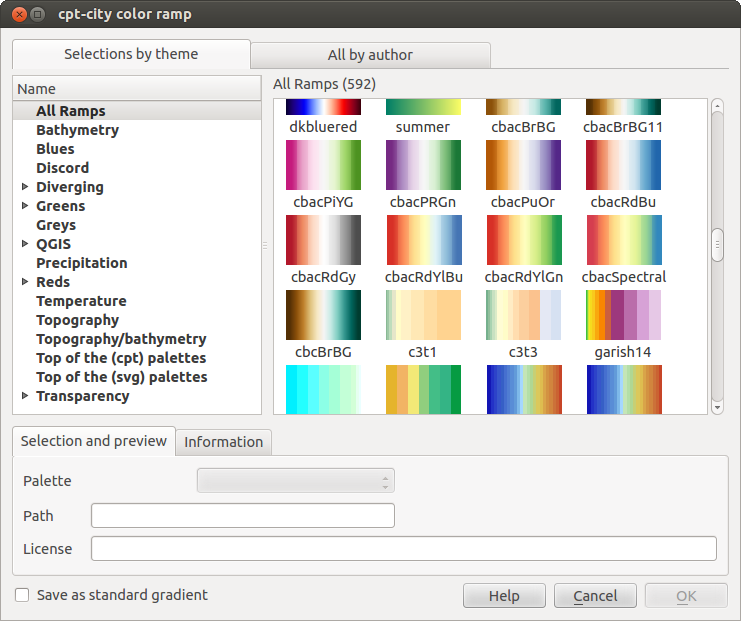
색상표 수백 개를 보유한 cpt-city 대화창
심볼 선택기
심볼 선택기는 심볼을 디자인하기 위한 주 대화창입니다. 마커(marker), 라인(line) 또는 필(fill) 심볼을 생성하거나 편집할 수 있습니다.
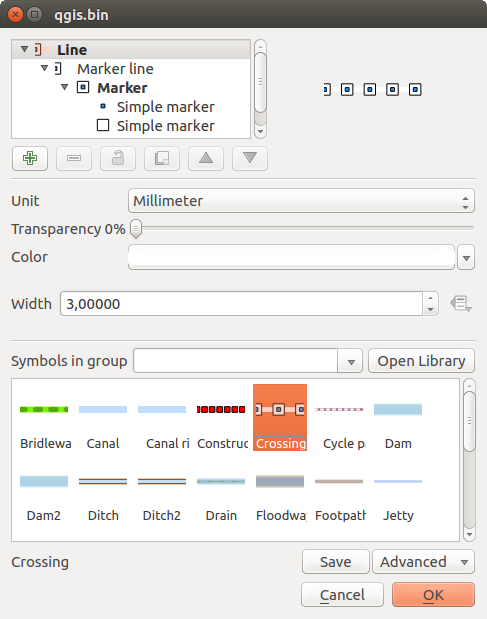
Designing a Marker symbol
다음은 심볼 선택기 대화창을 구성하는 주 요소 두 가지입니다:
심볼 트리: 이후에 결합해 새 전체 수준 심볼을 형성하는 심볼 레이어를 표시합니다.
설정: 트리에서 선택한 심볼 레이어의 환경을 설정합니다.
심볼 레이어 트리
심볼은 여러 Symbol layers 로 이루어질 수 있습니다. 심볼 트리는 이후에 결합해 새 전체 수준 심볼을 형성하는 이 심볼 레이어들의 적층(overlay)을 표시합니다. 게다가, 심볼 속성을 변경하자마자 동적인 심볼 표현이 업데이트됩니다.
심볼 트리 항목을 관리할 수 있는 도구 집합이 있는데, 선택한 수준에 따라 대화창 하단에 활성화되는 서로 다른 도구들을 통해 다음 작업을 할 수 있습니다:
- Add new symbol layer: 원하는 만큼 심볼들을 겹칠 수 있습니다.
- Remove the selected symbol layer
 Lock colors of symbol layer: 잠긴 색상은 사용자가 전체 (또는 그 이상) 심볼 수준에서 색상을 변경하더라도 영향을 받지 않습니다.
 Duplicate a (group of) symbol layer(s)
 : 심볼 레이어를 위 또는 아래로 이동합니다.
심볼 환경 설정
QGIS는 심볼, 그 다음 심볼 레이어라는 두 단계를 거쳐 심볼 환경을 설정합니다.
심볼
트리의 최상 수준에서, 심볼은 레이어 도형에 따라 마커, 라인 또는 필 유형이 될 수 있습니다. 각 심볼은 하나 이상의 (어느 유형이든) 심볼 또는 심볼 레이어를 내장할 수 있습니다.
전체 수준 심볼에 적용되는 다음 몇몇 파라미터를 설정할 수 있습니다:
- Unit: it can be Millimeter, Pixels or Map unit
- Transparency
Color: 사용자가 이 파라미터를 변경하면, 잠기지 않은 모든 하위 심볼 색상에 그 색상값을 반영합니다.
Size 및 Rotation: 마커 심볼 전용 파라미터입니다.
Width: 라인 심볼 전용 파라미터입니다.
주석
The Data-defined override button beside the last layer-related parameters is inactive when setting the symbol from the Style manager dialog. When the symbol is connected to a map layer, this button offers access to the size assistant dialog which helps to create proportional or multivariate analysis rendering.
The symbols used at this level are items you can pick from the symbols library. A list of available symbols of the same type from your symbol library is shown and can be filtered by selecting a group in the drop-down list just above. Click the Save button to add the designed symbol to your symbol library.
With the Advanced  option, you can:
심볼 수준 설정: 맵 캔버스에 있는 심볼 레이어들이 서로 연결되는 방식을 정의합니다. (자세한 내용은 Symbols levels 을 참조하세요.)
캔버스 범위로 피처 잘라내기: 라인 및 필 심볼 전용 설정입니다.
참고
Symbol layers 창의 낮은 수준에서 크기를 설정하고 나서도, 최고 수준에 있는 (마커 심볼 용) Size 또는 (라인 심볼 용) Width 메뉴로 전체 심볼의 크기를 변경할 수 있다는 사실을 기억하십시오. 낮은 수준의 크기가 비율을 유지한 채 알맞게 변경됩니다.
심볼 레이어
트리의 낮은 수준에서, 심볼 레이어를 사용자 지정할 수 있습니다. 사용할 수 있는 심볼 레이어 유형은 상위 심볼 유형을 따릅니다. 심볼 렌더링을 향상시키기 위해 심볼 레이어에 그리기 효과 를 적용할 수 있습니다.
Because describing all the options of all the symbol layer types would not be possible, only particular and significative ones are mentioned below.
공통 파라미터
심볼 레이어가 마커, 라인, 필 하위 유형인지 상관없이, 심볼 레이어를 작성하는 데 다음 공통 옵션 및 위젯을 쓸 수 있습니다:
색상 선택기 위젯: 색상을 쉽게 조정할 수 있습니다.
- Units: it can be Millimeter, Pixels or Map unit
 Data-defined Override 위젯: 거의 모든 옵션들 옆에 있으며, 각 심볼을 사용자 지정하는 능력을 확장합니다. (자세한 내용은 데이터 정의 무시 설정 을 참조하세요.)
주석
다음에 설명할 내용이 심볼 레이어 유형이 피처 도형에 종속된다고 가정하고 있긴 하지만, 심볼 레이어를 다른 심볼 레이어 안에 삽입할 수 있다는 사실을 기억하십시오. 이 경우, 낮은 수준의 심볼 레이어 파라미터(위치, 오프셋 등등)가 피처 도형 자체가 아니라 높은 수준의 심볼에 종속될 수도 있습니다.
마커 심볼
포인트 도형 피처에 적합한 마커 심볼은 다음과 같은 여러 Symbol layer types 를 가지고 있습니다:
Simple marker (기본값)
Ellipse marker: 단순 마커 심볼 레이어로, 너비 및 높이를 사용자 지정할 수 있습니다.
- Filled marker: similar to the simple marker symbol layer, except that it uses a fill sub symbol to render the marker. This allows use of all the existing QGIS fill (and outline) styles for rendering markers, e.g. gradient or shapeburst fills;
Font marker: 설치된 폰트를 마커 심볼로 사용합니다.
Geometry generator (도형 생성기 참조)
Vector Field marker (벡터장 마커 참조)
SVG marker: provides you with images from your SVG paths (set in Settings ‣ Options ‣ System menu) to render as marker symbol. Each SVG file colors and outline can be adapted.
주석
사용자 지정 SVG 마커 심볼의 요구사항
To have the possibility to change the colors of a SVG marker, you have to add the placeholders param(fill) for fill color, param(outline) for outline color and param(outline-width) for stroke width. These placeholders can optionally be followed by a default value, e.g.:
<svg width="100%" height="100%">
<rect fill="param(fill) #ff0000" stroke="param(outline) #00ff00" stroke-width="param(stroke-width) 10" width="100" height="100">
</rect>
</svg>
각 마커 심볼 레이어 유형마다, 다음 속성을 설정할 수 있습니다:
- Color for the fill and/or stroke, using all the capabilities of the 색상 선택기 widget;
- Size
- Outline style
- Outline width
- Join style
- Rotation
- Offset X,Y: You can shift the symbol in the x- or y- direction;
Anchor point
대부분의 마커 심볼 대화창에, 사용자가 선택할 수 있는 사전 정의된 심볼을 미리 볼 수 있는 프레임이 있습니다.
라인 심볼
Appropriate for line geometry features, line symbols have following symbol layer types:
Simple line (기본값): 다음 옵션을 설정할 수 있습니다:
- Color
- Pen width
- Pen style
- Join style
- Cap style
- Offset
- Use custom dash pattern: overrides the Pen
style setting with a custom dash.
Arrow: 설정할 수 있는 너비, 길이 및 두께를 가진, 한쪽 혹은 양쪽에 화살 표시가 있는 만곡(또는 직선) 화살표로 라인을 그립니다. 만곡 화살표를 생성하려면 라인 객체가 꼭지점을 적어도 3개 이상 보유하고 있어야만 합니다. 또 화살표 본체를 렌더링하는 데 그레이디언트나 부풀리기 같은 필 심볼 도 이용합니다. 도형 생성기와 결합하면, 이 심볼 레이어 유형으로 흐름 맵 을 표현할 수 있습니다.
Geometry generator (도형 생성기 참조)
Marker line: 라인을 따라 마커 심볼을 표시합니다. 일정한 간격으로 표시할 수도 있고, 도형에 따라 처음, 마지막 또는 각 꼭짓점에, 아니면 중심점에, 혹은 만곡 포인트마다 표시할 수도 있습니다. 마커 심볼에 대해 라인을 따라 오프셋을 설정하거나, 아예 라인 자체에 오프셋을 설정할 수도 있습니다. Rotate marker 옵션을 통해 마커 심볼이 라인 방향을 따라야 하는지 아닌지 설정할 수 있습니다.
필 심볼
폴리곤 도형 피처에 적합한 필 심볼은 다음과 같은 여러 Symbol layer types 을 가지고 있습니다:
Simple fill (기본값): 다음 옵션을 설정할 수 있습니다:
- Fill color
- Outline color
- Fill style
- Outline style
- Outline width
- Join style
- Offset X,Y
Centroid fill: places a marker symbol at the centroid of the visible feature. The position of the marker may however not be the real centroid of the feature because calculation takes into account the polygon(s) clipped to area visible in map canvas for rendering and ignores holes. Use 도형 생성기 if you want the exact centroid.
여러 부분으로 이루어진 객체의 모든 부분에 마커를 그리거나 또는 가장 큰 부분에만 그릴 수도 있고, 폴리곤 내부에 그리도록 강제할 수도 있습니다.
Geometry generator (see geometry_generator_symbol);
Gradient fill: 단순한 2 색상 그레이디언트 또는 사전 정의된 그레이디언트 색상표 를 바탕으로 방사형, 선형 또는 원추형 그레이디언트를 사용해서 폴리곤 레이어를 채웁니다. 그레이디언트를 회전시킬 수도 있고, 단일 객체에 한해 또는 전체 맵 범위에 걸쳐 적용할 수도 있습니다. 또 좌표를 통해 또는 (객체 또는 맵의) 중심을 이용해서 시작점 및 종단점을 설정할 수도 있습니다.
Line pattern fill: 라인 심볼 레이어의 해치(hatch) 패턴으로 폴리곤을 채웁니다. 라인 사이의 간격 및 객체 경계선으로부터의 오프셋을 설정할 수 있습니다.
Point pattern fill: 마커 심볼 레이어의 해치(hatch) 패턴으로 폴리곤을 채웁니다. 포인트 사이의 간격 및 객체 경계선으로부터의 오프셋을 설정할 수 있습니다.
Raster image fill: 폴리곤을 래스터 이미지 타일로 채울 수 있습니다. (데이터 정의) 파일명, 투명도, 이미지 크기(픽셀, 밀리미터 또는 맵 단위), 좌표 모드(객체 또는 뷰) 그리고 기울기 옵션을 설정할 수 있습니다.
SVG fill: SVG 마커 를 이용해서 폴리곤을 채웁니다.
Shapeburst fill: 이 옵션은 그레이디언트 채우기에 버퍼를 적용하는데, 폴리곤의 경계선에서 중심을 향해 그레이디언트를 그립니다. 경계선에서 음영까지의 거리, 색상표 사용 또는 단순한 2 색상 그레이디언트 사용, (선택적인) 채우기의 번짐 효과, 그리고 오프셋 파라미터를 설정할 수 있습니다.
Outline: Arrow: 라인 화살표 심볼 을 이용해서 폴리곤 경계선을 표현합니다.
Outline: Marker line: 마커 라인 심볼 레이어를 이용해서 폴리곤 경계선을 표현합니다.
Outline: simple line: 단순 라인 심볼 레이어를 이용해서 폴리곤 경계선을 표현합니다. Draw line only inside polygon 옵션을 선택하면 폴리곤 안쪽에 폴리곤 경계선을 그리는데, 서로 인접한 폴리곤들의 경계선을 명확하게 표현하는 데 유용합니다.
주석
도형 유형이 폴리곤인 경우, 라인/폴리곤을 자동적으로 캔버스 범위에 맞춰 자르는 옵션을 비활성화할 수 있습니다. 어떤 경우 이 옵션이 심볼 스타일에 방해가 되기도 하기 때문입니다. (예를 들어 중심 채우기 유형은 중심이 언제나 객체의 실제 중심이어야만 합니다.)
도형 생성기
모든 심볼 유형에 대해 사용할 수 있는 Geometry Generator 심볼 레이어는 렌더링 과정 중에 실시간으로 도형을 생성하는 표현식 문법 을 사용할 수 있습니다. 생성된 도형은 원본 도형 유형과 일치할 필요가 없고, 서로 다르게 수정된 여러 심볼 레이어들을 적층해서 추가할 수 있습니다.
다음은 몇몇 예시입니다:
-- render the centroid of a feature
centroid( $geometry )

-- visually overlap features within a 100 map units distance from a point
-- feature, i.e generate a 100m buffer around the point
buffer( $geometry, 100 )

-- Given polygon layer1( id1, layer2_id, ...) and layer2( id2, fieldn...)
-- render layer1 with a line joining centroids of both where layer2_id = id2
make_line( centroid( $geometry ),
           centroid( geometry( get_feature( 'layer2', 'id2', attribute(
               $currentfeature, 'layer2_id') ) )
         )
벡터장 마커
지구의 변화, 조류(潮流)의 흐름 등과 같은 벡터장(vector field) 데이터를 표시하는 데 벡터장 마커를 이용합니다. 이 마커는 선택한 데이터 포인트의 속성에 따라 축척 및 방향이 정의된 라인으로 (화살표가 낫습니다) 벡터를 표시합니다. 포인트 데이터를 렌더링하는 데에만 이 마커를 사용할 수 있습니다. 라인 및 폴리곤 레이어를 이 심볼로 그릴 수는 없습니다.
벡터장은 데이터의 속성으로 정의되는데, 다음 방법 가운데 하나로 벡터장을 표현할 수 있습니다:
데카르트 요소 (벡터장의 x 및 y 요소)
극(polar) 좌표: 이 경우, 속성이 Length 와 Angle 을 정의합니다. 각도는 북쪽에서 시계 방향으로 또는 동쪽에서 반시계 방향으로 측정될 수도 있고, 도 또는 라디안 단위일 수도 있습니다.
높이만 있는(height only) 데이터: 데이터의 속성을 이용해서 축척을 정의한 수직 화살표를 표시합니다. 예를 들어 지구 변화의 수직적 요소를 표시하는 데 적합합니다.
벡터장을 살펴보기 위해 벡터장의 규모를 적절한 크기로 늘리거나 줄일 수 있습니다.